The same plot in 13 other libraries — Python: Altair, Bokeh, lets-plot, Matplotlib, Plotly, Seaborn; R: ggplot2; Julia: Makie.jl; JavaScript: Chart.js, D3.js, Apache ECharts, Highcharts, MUI X Charts. Compare all 14 side by side: 3D Scatter Plot in Python, R, Julia and JavaScript.
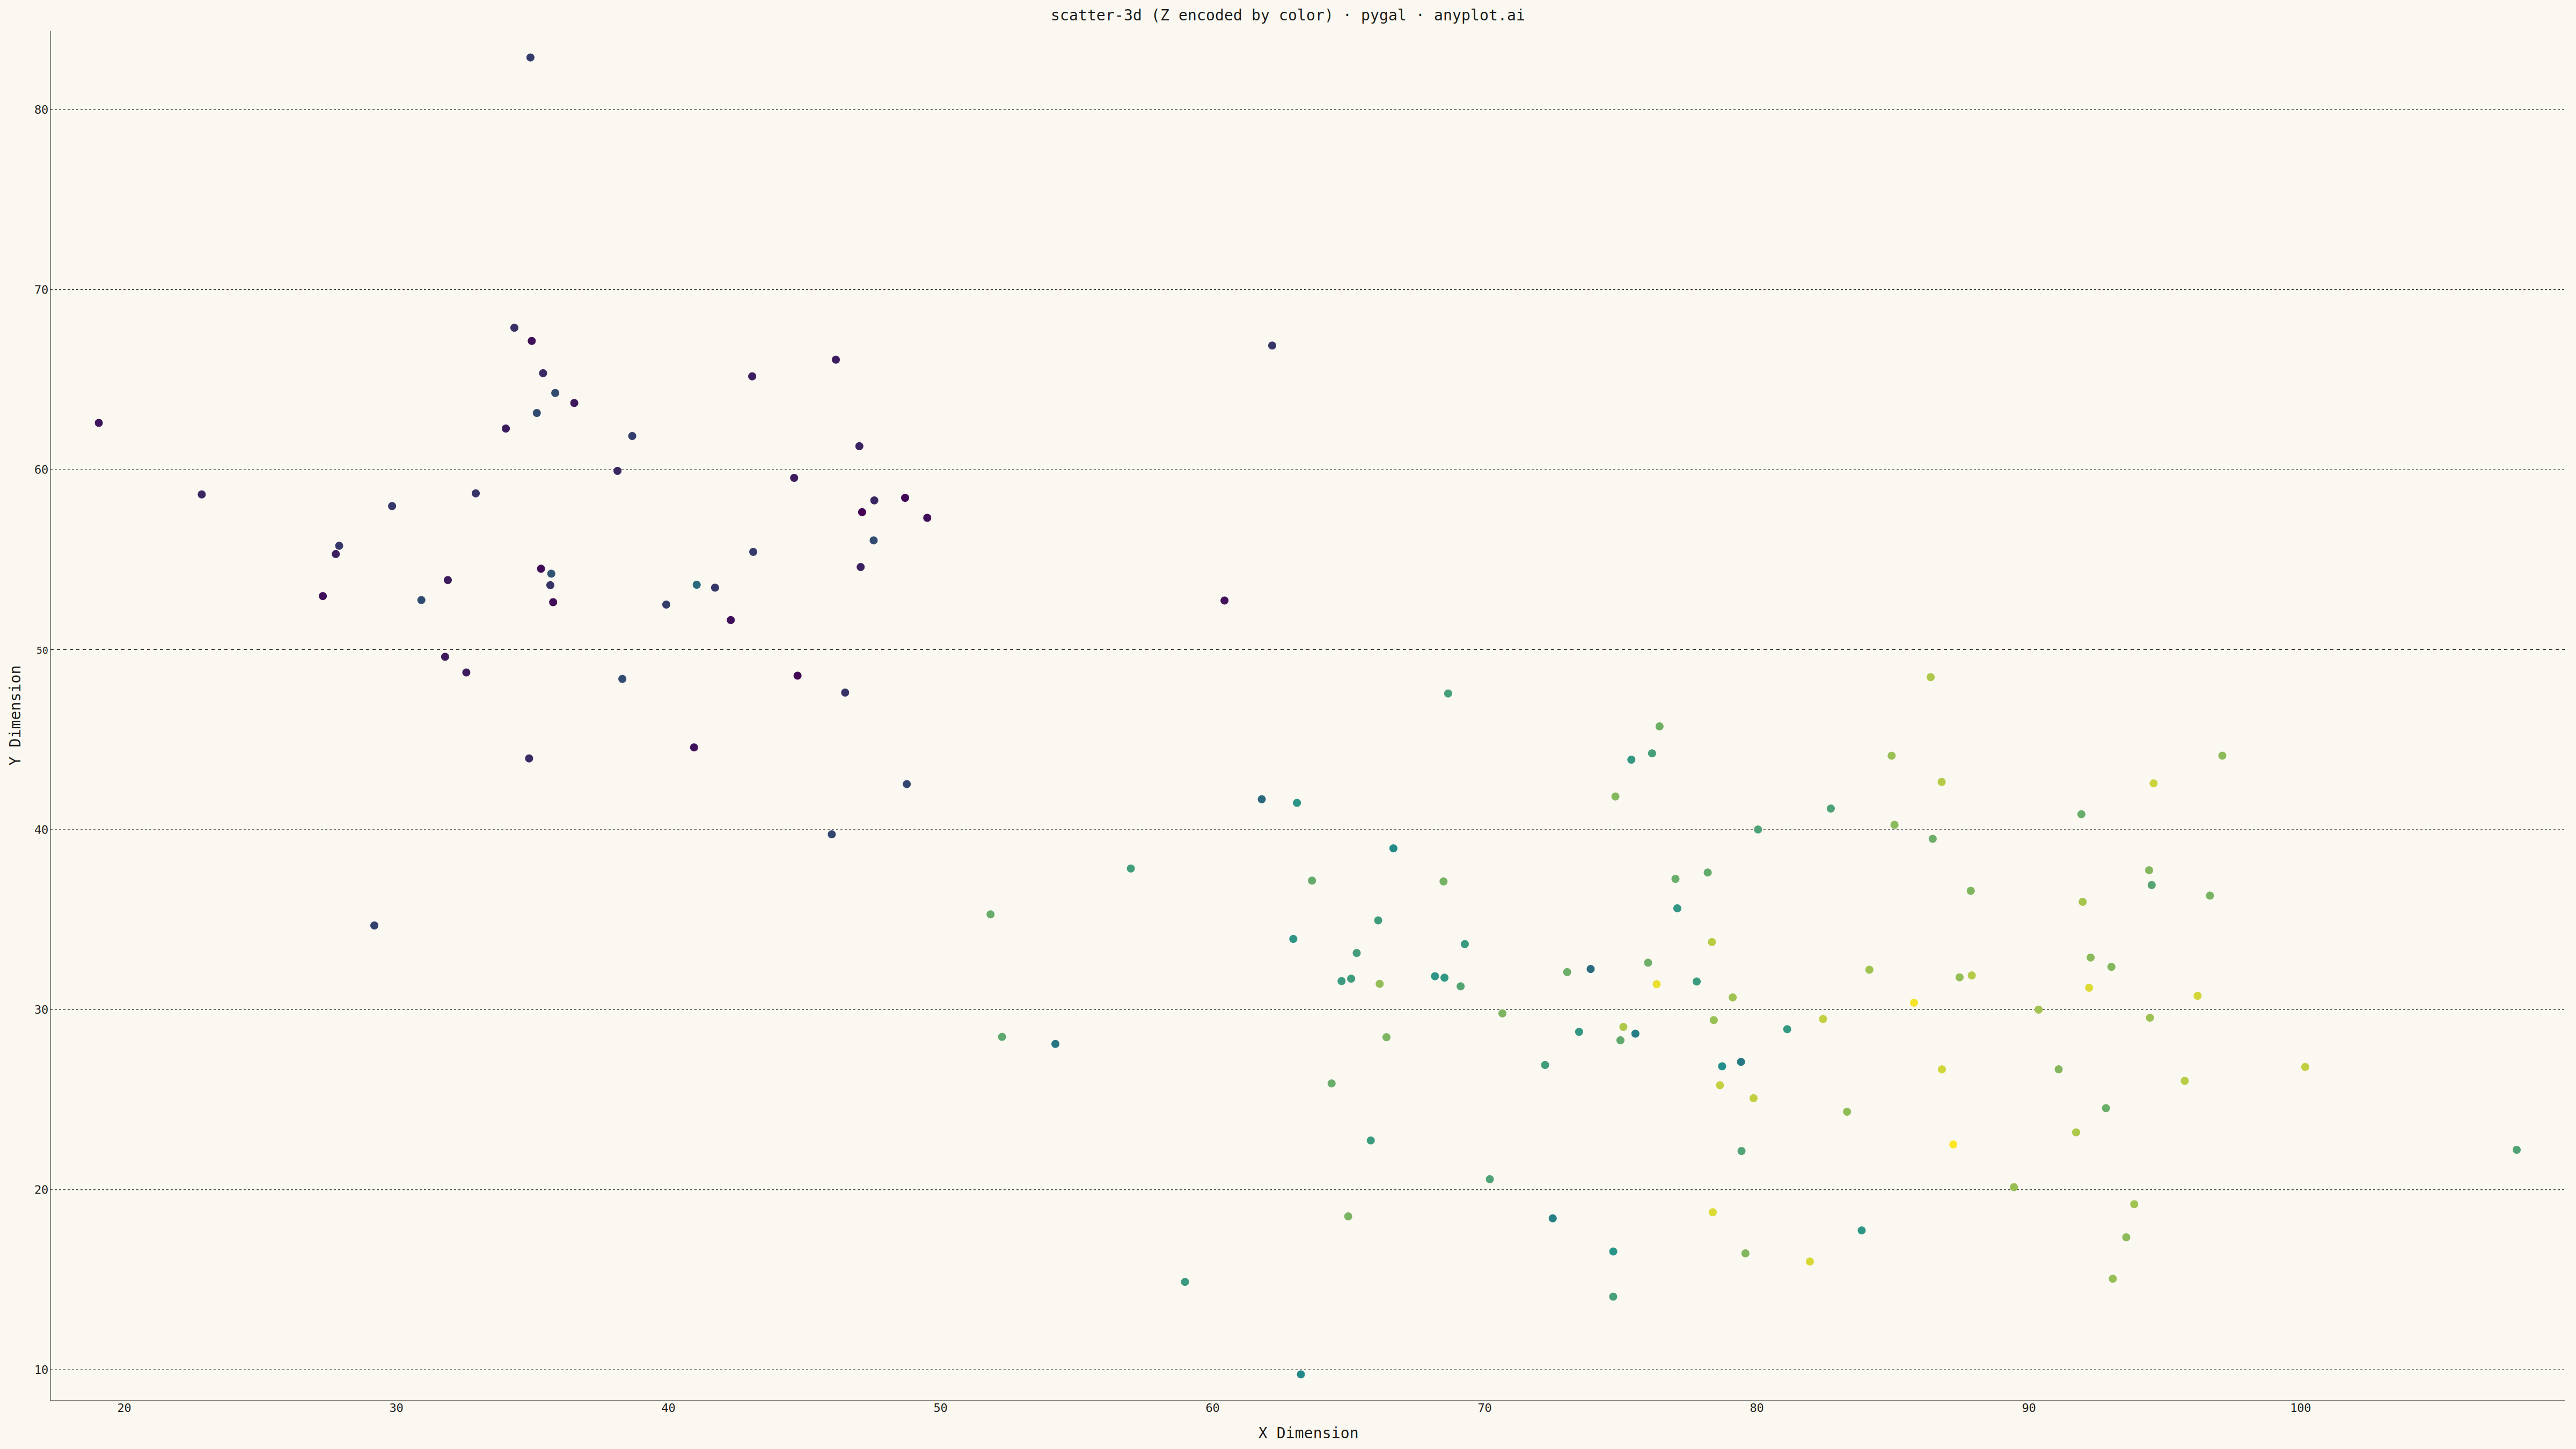
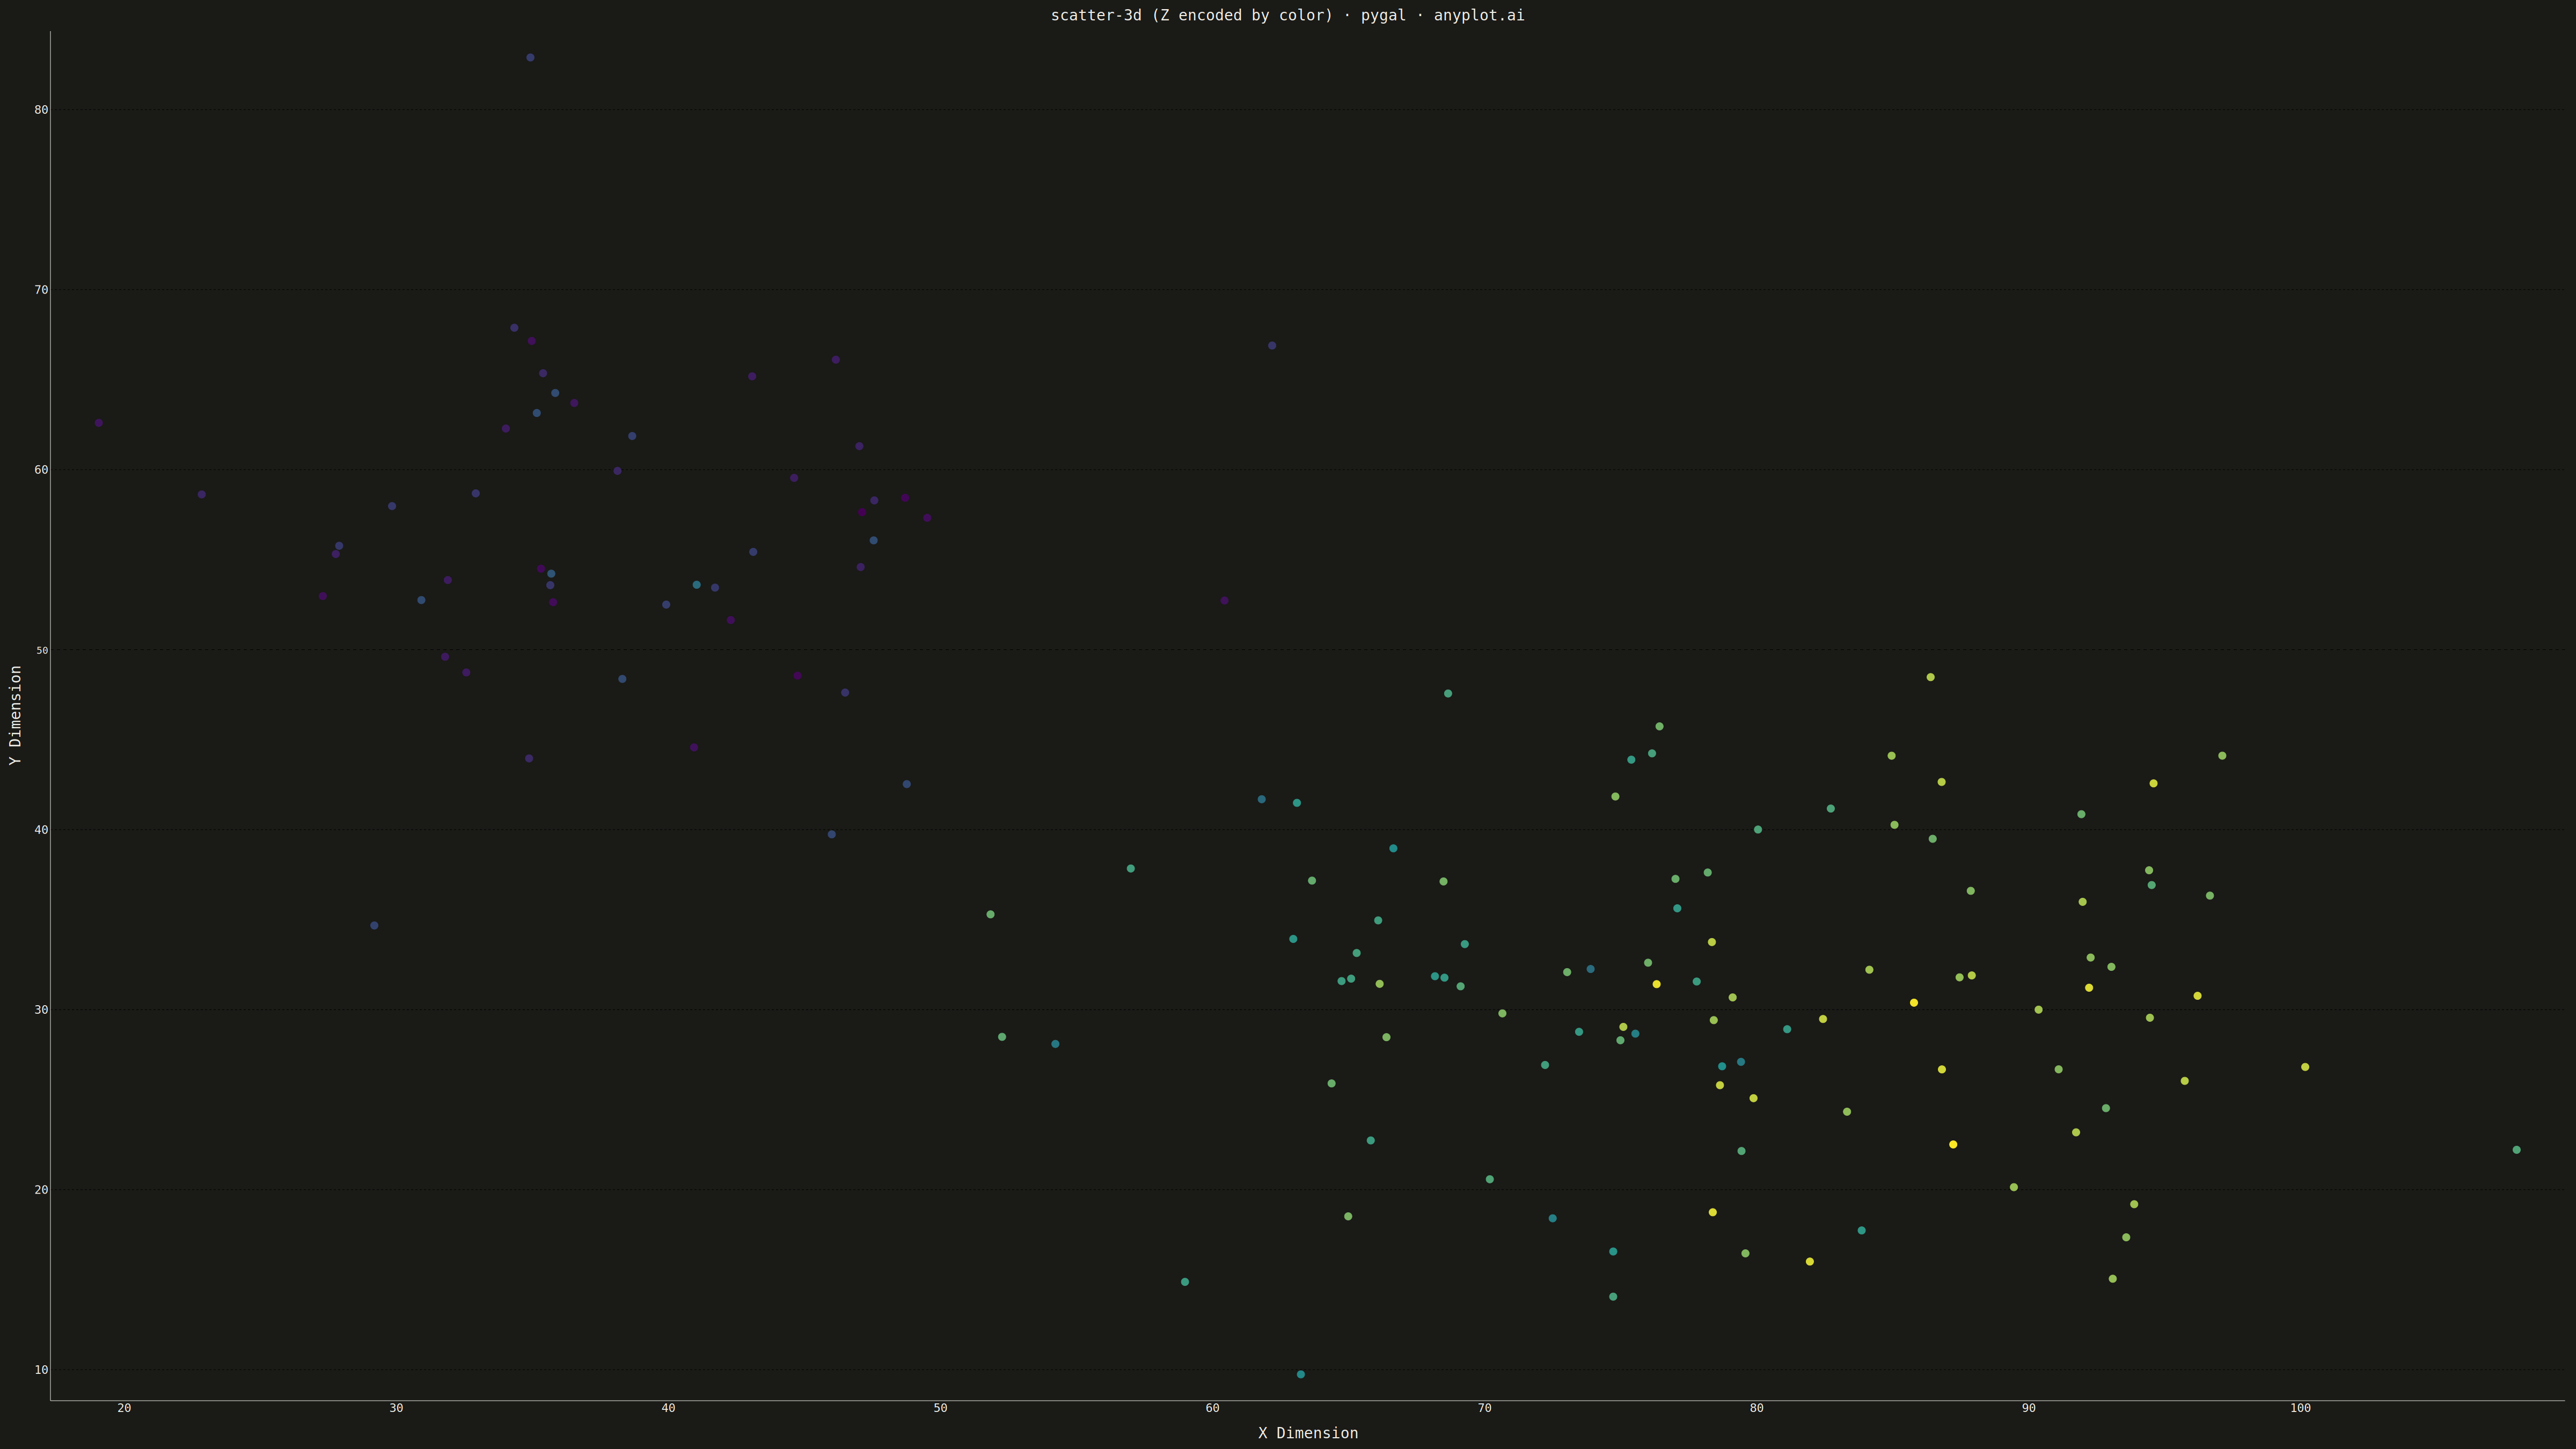
A three-dimensional scatter plot that displays the relationship between three numeric variables by plotting points in 3D space. This visualization extends the classic 2D scatter plot to reveal patterns, clusters, and correlations across three dimensions simultaneously, making it invaluable for multivariate data exploration.
""" anyplot.ai
scatter-3d: 3D Scatter Plot
Library: pygal 3.1.0 | Python 3.13.13
Quality: 83/100 | Created: 2026-05-08
"""

import os
import site
import sys

import numpy as np


sys.path.insert(0, site.getsitepackages()[0])

import pygal
from pygal.style import Style


THEME = os.getenv("ANYPLOT_THEME", "light")
PAGE_BG = "#FAF8F1" if THEME == "light" else "#1A1A17"
INK = "#1A1A17" if THEME == "light" else "#F0EFE8"
INK_SOFT = "#4A4A44" if THEME == "light" else "#B8B7B0"
INK_MUTED = "#6B6A63" if THEME == "light" else "#A8A79F"

np.random.seed(42)
n_samples = 150
n_clusters = 3

clusters_x = np.random.uniform(10, 90, n_clusters)
clusters_y = np.random.uniform(20, 80, n_clusters)
clusters_z = np.random.uniform(15, 85, n_clusters)

points_x = []
points_y = []
points_z = []

for i in range(n_clusters):
    cluster_points_x = np.random.normal(clusters_x[i], 8, n_samples // n_clusters)
    cluster_points_y = np.random.normal(clusters_y[i], 8, n_samples // n_clusters)
    cluster_points_z = np.random.normal(clusters_z[i], 8, n_samples // n_clusters)

    points_x.extend(cluster_points_x)
    points_y.extend(cluster_points_y)
    points_z.extend(cluster_points_z)

points_x = np.array(points_x)
points_y = np.array(points_y)
points_z = np.array(points_z)

z_norm = (points_z - points_z.min()) / (points_z.max() - points_z.min())


def viridis(t):
    """Approximate viridis colormap (t in [0, 1])."""
    if t < 0.5:
        r = int(68 + (33 - 68) * (t * 2))
        g = int(1 + (145 - 1) * (t * 2))
        b = int(84 + (140 - 84) * (t * 2))
    else:
        r = int(33 + (253 - 33) * ((t - 0.5) * 2))
        g = int(145 + (231 - 145) * ((t - 0.5) * 2))
        b = int(140 + (37 - 140) * ((t - 0.5) * 2))
    return f"#{r:02x}{g:02x}{b:02x}"


z_hex_colors = tuple(viridis(z) for z in z_norm)

custom_style = Style(
    background=PAGE_BG,
    plot_background=PAGE_BG,
    foreground=INK,
    foreground_strong=INK,
    foreground_subtle=INK_MUTED,
    colors=z_hex_colors,
    title_font_size=28,
    label_font_size=22,
    major_label_font_size=18,
    legend_font_size=16,
    stroke_width=0,
)

chart = pygal.XY(
    width=4800,
    height=2700,
    style=custom_style,
    title="scatter-3d (Z encoded by color) · pygal · anyplot.ai",
    x_title="X Dimension",
    y_title="Y Dimension",
    show_legend=False,
    show_dots=True,
    dots_size=7,
)

for i in range(n_samples):
    chart.add(f"Z: {points_z[i]:.1f}", [(points_x[i], points_y[i])])

chart.render_to_png(f"plot-{THEME}.png")

with open(f"plot-{THEME}.html", "wb") as f:
    f.write(chart.render())
Runnable source as JSON, for any HTTP client: https://api.anyplot.ai/specs/scatter-3d/pygal/code. Any spec id and library id listed in llms-full.txt fit the same URL shape; every URL below is complete and callable.
{
  "spec_id": "scatter-3d",
  "language": "python",
  "library": "pygal",
  "page": "https://anyplot.ai/scatter-3d/python/pygal",
  "hub": "https://anyplot.ai/scatter-3d",
  "code_json": "https://api.anyplot.ai/specs/scatter-3d/pygal/code",
  "spec_json": "https://api.anyplot.ai/specs/scatter-3d",
  "render_light_png": "https://storage.googleapis.com/anyplot-images/plots/scatter-3d/python/pygal/plot-light.png",
  "render_dark_png": "https://storage.googleapis.com/anyplot-images/plots/scatter-3d/python/pygal/plot-dark.png",
  "interactive_light_html": "https://storage.googleapis.com/anyplot-images/plots/scatter-3d/python/pygal/plot-light.html",
  "interactive_dark_html": "https://storage.googleapis.com/anyplot-images/plots/scatter-3d/python/pygal/plot-dark.html",
  "quality_score": 83.0,
  "license": "MIT",
  "guide": "https://anyplot.ai/llms.txt"
}
Part of 3D Scatter Plot on anyplot.ai.