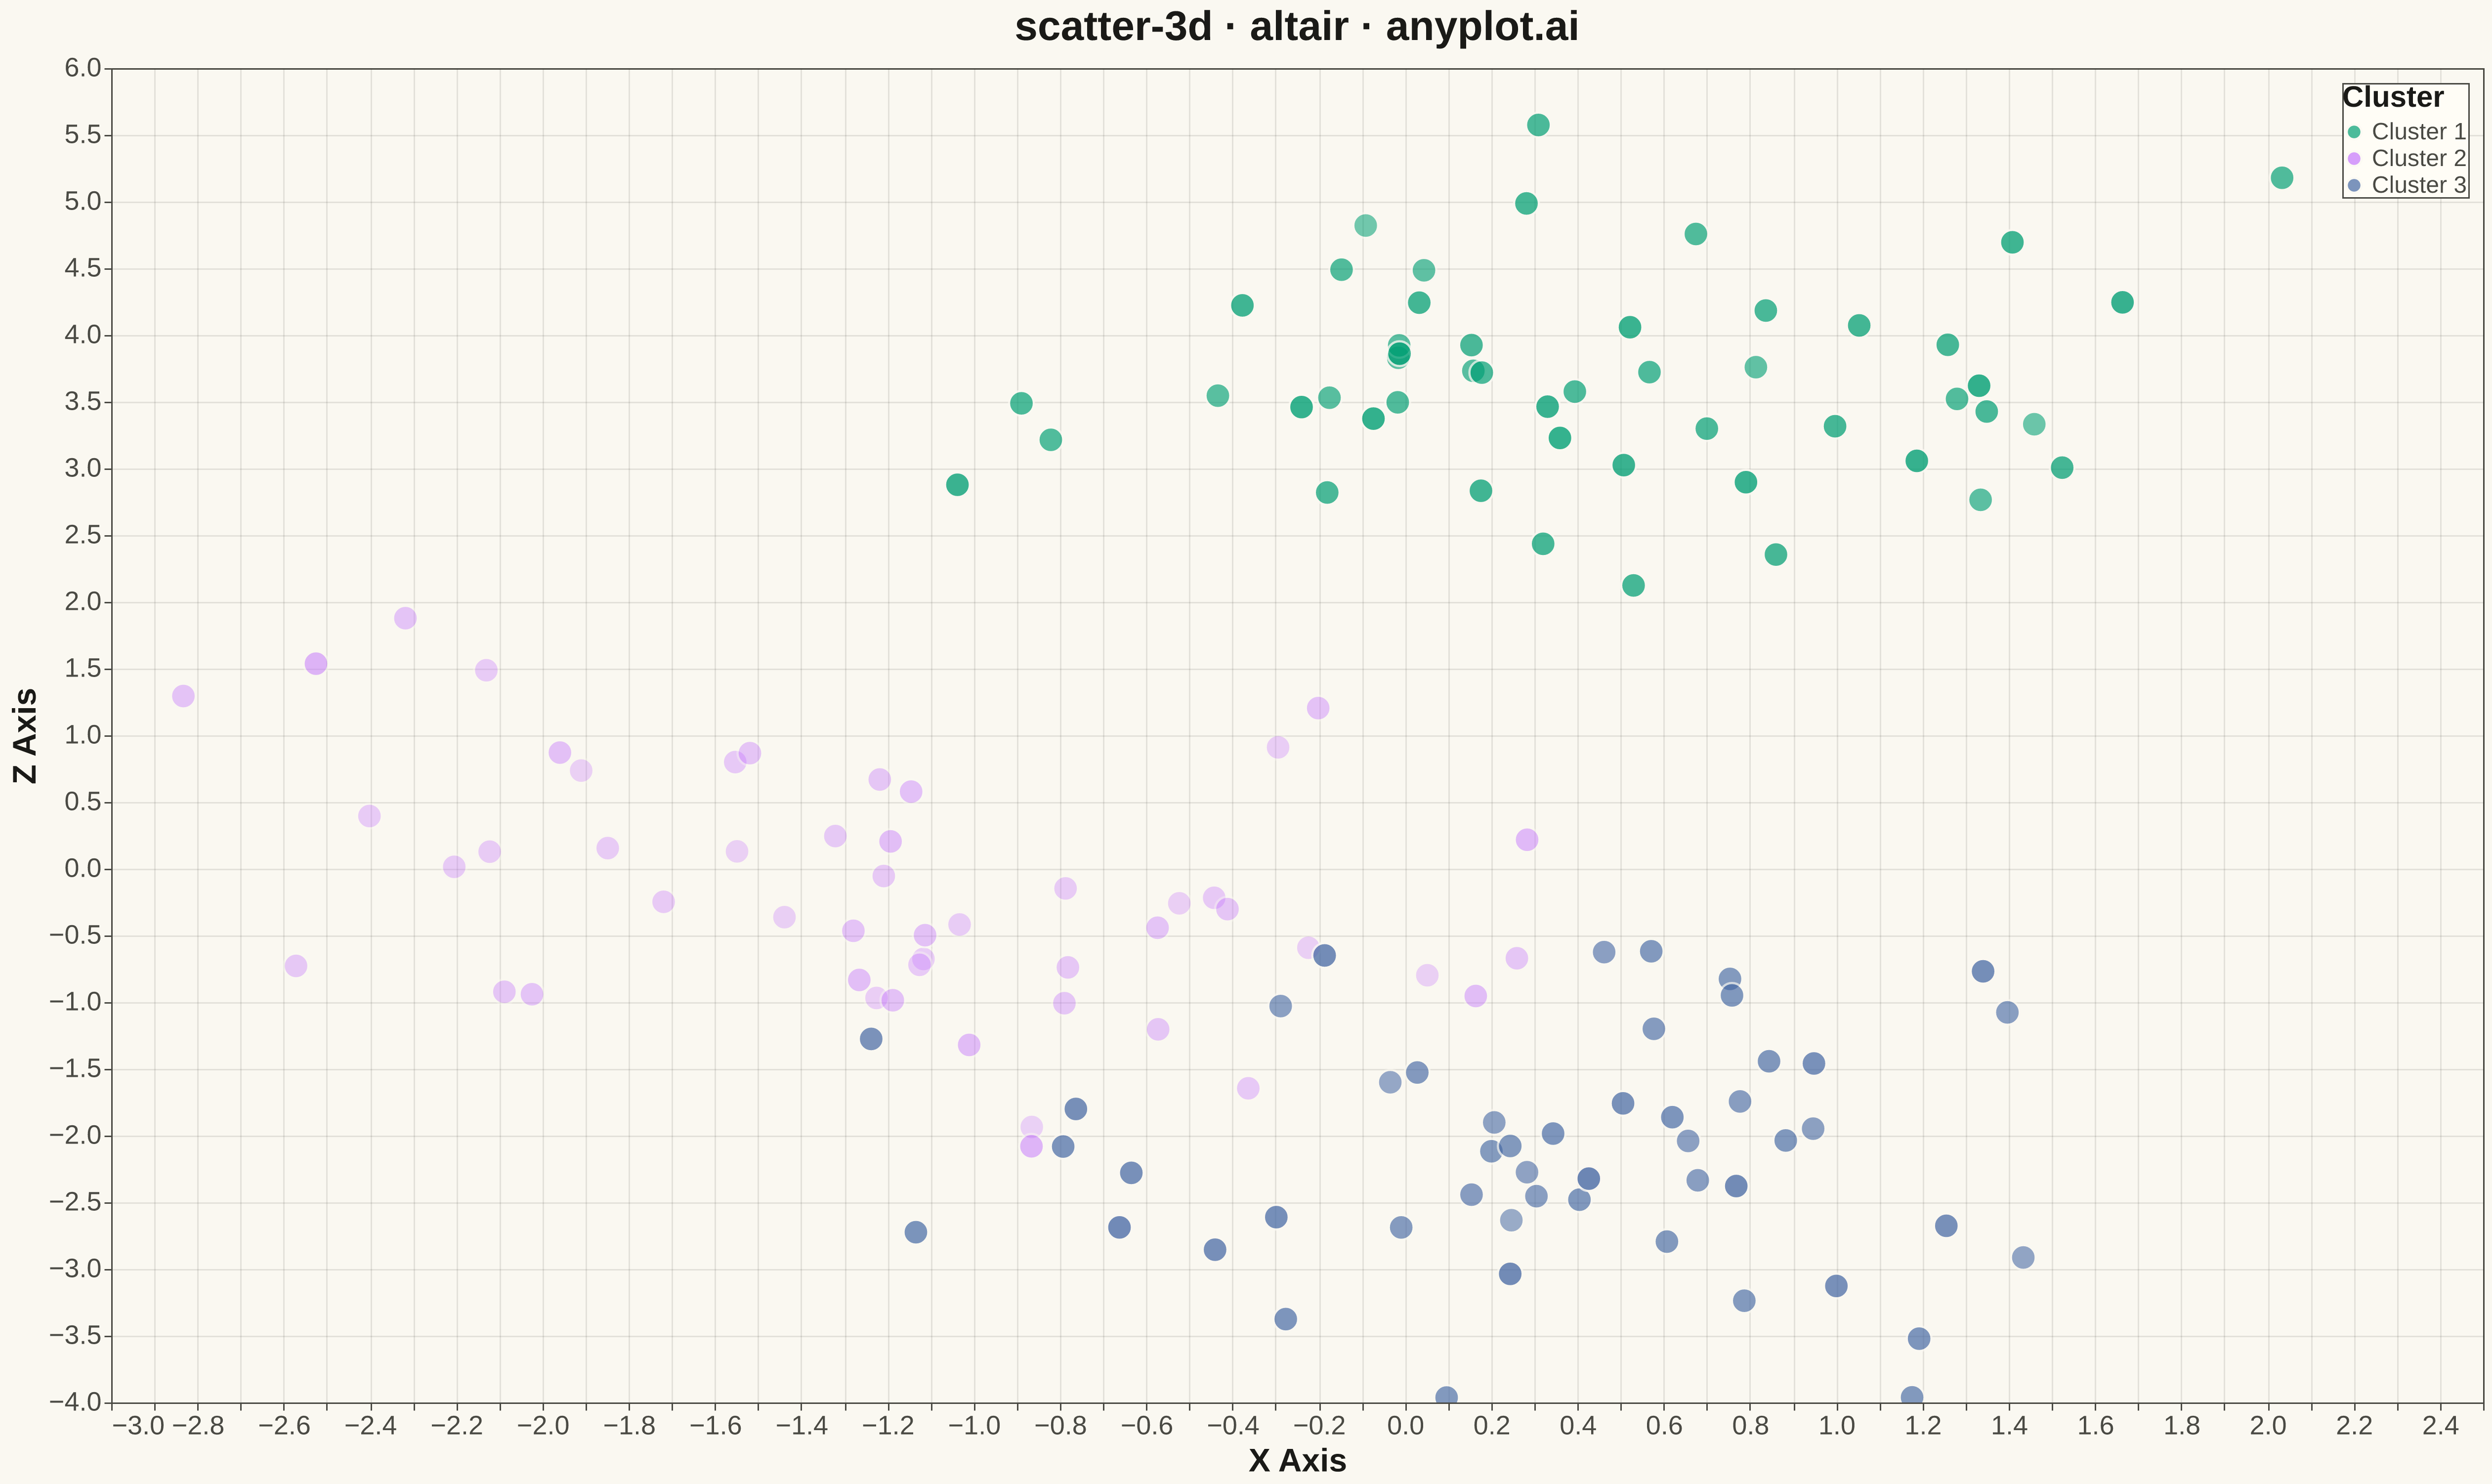
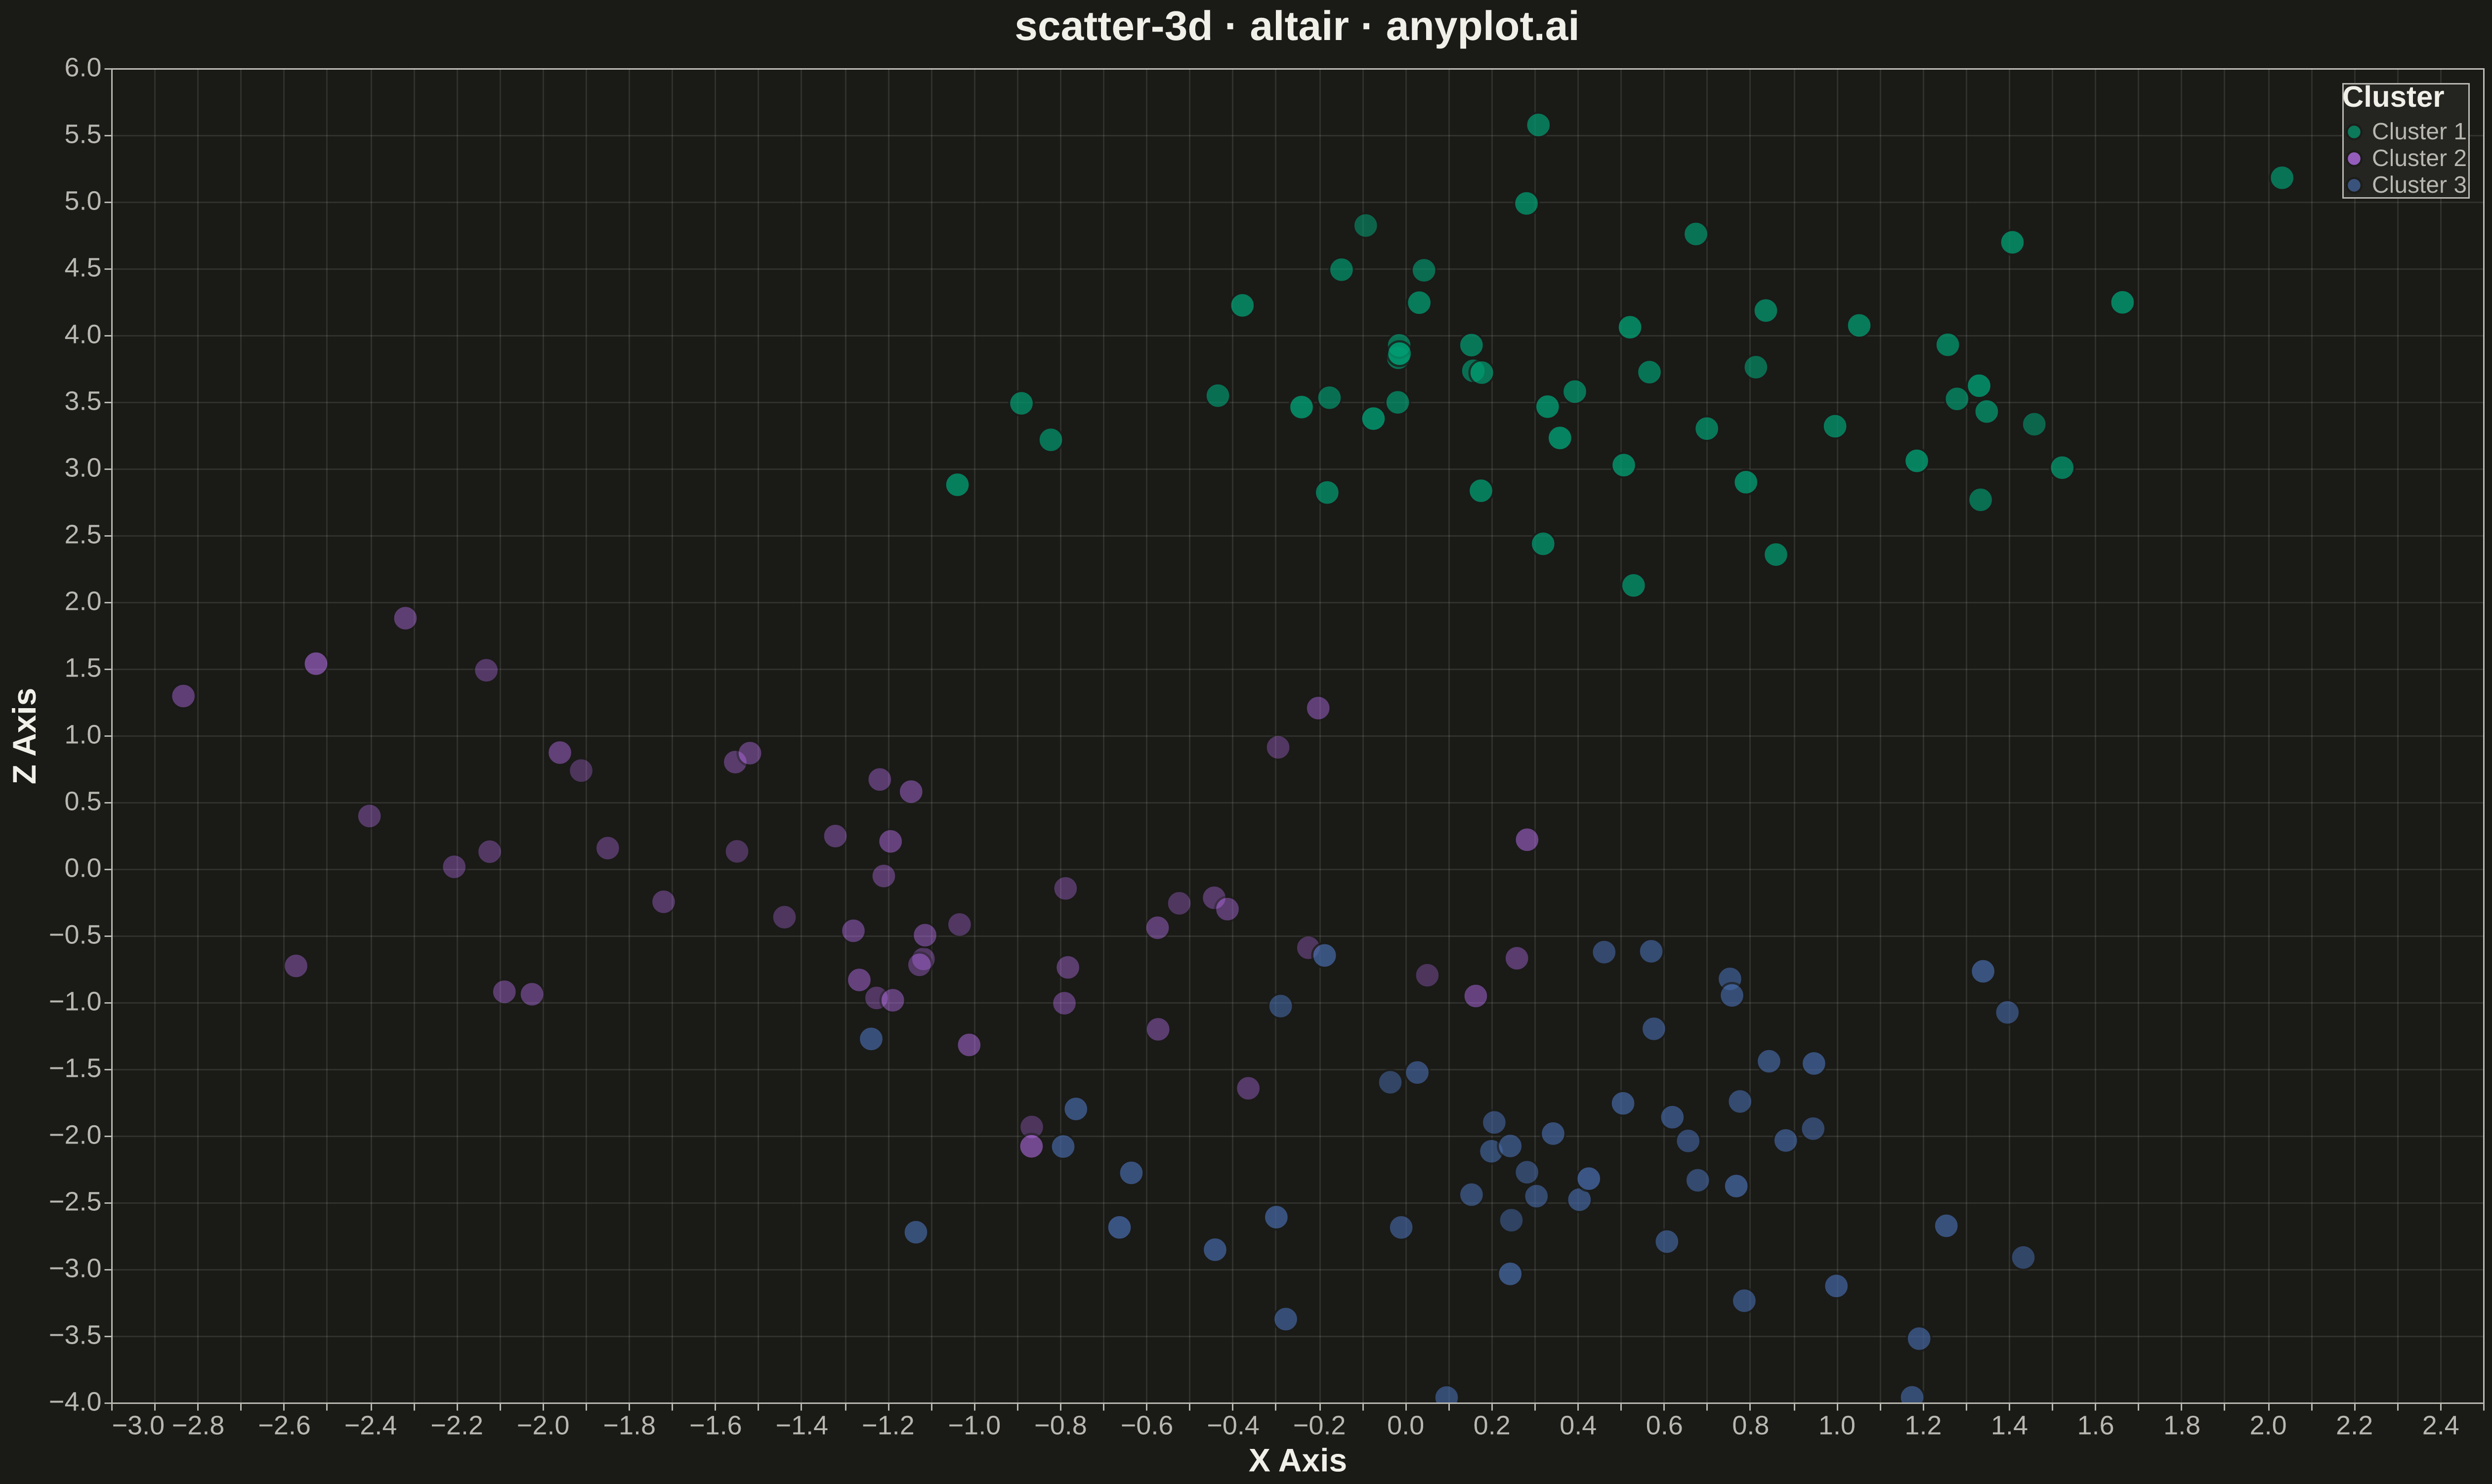
A three-dimensional scatter plot that displays the relationship between three numeric variables by plotting points in 3D space. This visualization extends the classic 2D scatter plot to reveal patterns, clusters, and correlations across three dimensions simultaneously, making it invaluable for multivariate data exploration.
""" anyplot.ai
scatter-3d: 3D Scatter Plot
Library: altair 6.1.0 | Python 3.13.13
Quality: 93/100 | Updated: 2026-05-08
"""

import os

import altair as alt
import numpy as np
import pandas as pd


THEME = os.getenv("ANYPLOT_THEME", "light")
PAGE_BG = "#FAF8F1" if THEME == "light" else "#1A1A17"
ELEVATED_BG = "#FFFDF6" if THEME == "light" else "#242420"
INK = "#1A1A17" if THEME == "light" else "#F0EFE8"
INK_SOFT = "#4A4A44" if THEME == "light" else "#B8B7B0"

IMPRINT = ["#009E73", "#C475FD", "#4467A3"]

# Data - create 3D clusters to demonstrate spatial relationships
np.random.seed(42)

n_points = 150

# Create three distinct clusters in 3D space
clusters = []
centers = [(2.5, 2.5, 2.5), (-2.5, -1.5, 1.0), (0.5, 0.0, -2.5)]

for i, (cx, cy, cz) in enumerate(centers):
    n_cluster = n_points // 3
    x = np.random.randn(n_cluster) * 0.8 + cx
    y = np.random.randn(n_cluster) * 0.8 + cy
    z = np.random.randn(n_cluster) * 0.8 + cz
    clusters.append(pd.DataFrame({"x": x, "y": y, "z": z, "cluster": f"Cluster {i + 1}"}))

df = pd.concat(clusters, ignore_index=True)

# 3D to 2D isometric projection (elevation=25°, azimuth=35°)
elev_rad = np.radians(25)
azim_rad = np.radians(35)

# Rotation around z-axis (azimuth)
df["x_rot"] = df["x"] * np.cos(azim_rad) - df["y"] * np.sin(azim_rad)
df["y_rot"] = df["x"] * np.sin(azim_rad) + df["y"] * np.cos(azim_rad)

# Rotation around x-axis (elevation) and project to 2D
df["x_proj"] = df["x_rot"]
df["z_proj"] = df["y_rot"] * np.sin(elev_rad) + df["z"] * np.cos(elev_rad)

# Calculate depth for point ordering (painters algorithm)
df["depth"] = df["y_rot"] * np.cos(elev_rad) - df["z"] * np.sin(elev_rad)

# Normalize depth for opacity (further points slightly more transparent)
depth_min = df["depth"].min()
depth_max = df["depth"].max()
df["opacity"] = 0.65 + 0.35 * (df["depth"] - depth_min) / (depth_max - depth_min + 1e-6)

# Scatter chart with clusters
scatter = (
    alt.Chart(df)
    .mark_circle(size=280, strokeWidth=1.5, stroke=PAGE_BG)
    .encode(
        x=alt.X("x_proj:Q", axis=alt.Axis(title="X Axis", labelFontSize=18, titleFontSize=22)),
        y=alt.Y("z_proj:Q", axis=alt.Axis(title="Z Axis", labelFontSize=18, titleFontSize=22)),
        color=alt.Color(
            "cluster:N",
            scale=alt.Scale(domain=["Cluster 1", "Cluster 2", "Cluster 3"], range=IMPRINT),
            legend=alt.Legend(title="Cluster", titleFontSize=20, labelFontSize=16, orient="top-right", offset=10),
        ),
        opacity=alt.Opacity("opacity:Q", legend=None),
        order=alt.Order("depth:Q", sort="ascending"),
        tooltip=[
            alt.Tooltip("x:Q", title="X", format=".2f"),
            alt.Tooltip("y:Q", title="Y", format=".2f"),
            alt.Tooltip("z:Q", title="Z", format=".2f"),
            alt.Tooltip("cluster:N", title="Cluster"),
        ],
    )
)

# Add pan and zoom interactivity
pan_zoom = scatter.interactive()

# Final chart
chart = (
    pan_zoom.properties(
        width=1600,
        height=900,
        background=PAGE_BG,
        title=alt.Title(text="scatter-3d · altair · anyplot.ai", fontSize=28),
    )
    .configure_view(fill=PAGE_BG, stroke=INK_SOFT)
    .configure_axis(
        domainColor=INK_SOFT, tickColor=INK_SOFT, gridColor=INK, gridOpacity=0.10, labelColor=INK_SOFT, titleColor=INK
    )
    .configure_title(color=INK)
    .configure_legend(fillColor=ELEVATED_BG, strokeColor=INK_SOFT, labelColor=INK_SOFT, titleColor=INK)
)

# Save outputs
chart.save(f"plot-{THEME}.png", scale_factor=3.0)
chart.save(f"plot-{THEME}.html")
Runnable source as JSON, for any HTTP client: https://api.anyplot.ai/specs/scatter-3d/altair/code. Any spec id and library id listed in llms-full.txt fit the same URL shape; every URL below is complete and callable.
{
  "spec_id": "scatter-3d",
  "language": "python",
  "library": "altair",
  "page": "https://anyplot.ai/scatter-3d/python/altair",
  "hub": "https://anyplot.ai/scatter-3d",
  "code_json": "https://api.anyplot.ai/specs/scatter-3d/altair/code",
  "spec_json": "https://api.anyplot.ai/specs/scatter-3d",
  "render_light_png": "https://storage.googleapis.com/anyplot-images/plots/scatter-3d/python/altair/plot-light.png",
  "render_dark_png": "https://storage.googleapis.com/anyplot-images/plots/scatter-3d/python/altair/plot-dark.png",
  "interactive_light_html": "https://storage.googleapis.com/anyplot-images/plots/scatter-3d/python/altair/plot-light.html",
  "interactive_dark_html": "https://storage.googleapis.com/anyplot-images/plots/scatter-3d/python/altair/plot-dark.html",
  "quality_score": 93.0,
  "license": "MIT",
  "guide": "https://anyplot.ai/llms.txt"
}
Part of 3D Scatter Plot on anyplot.ai.