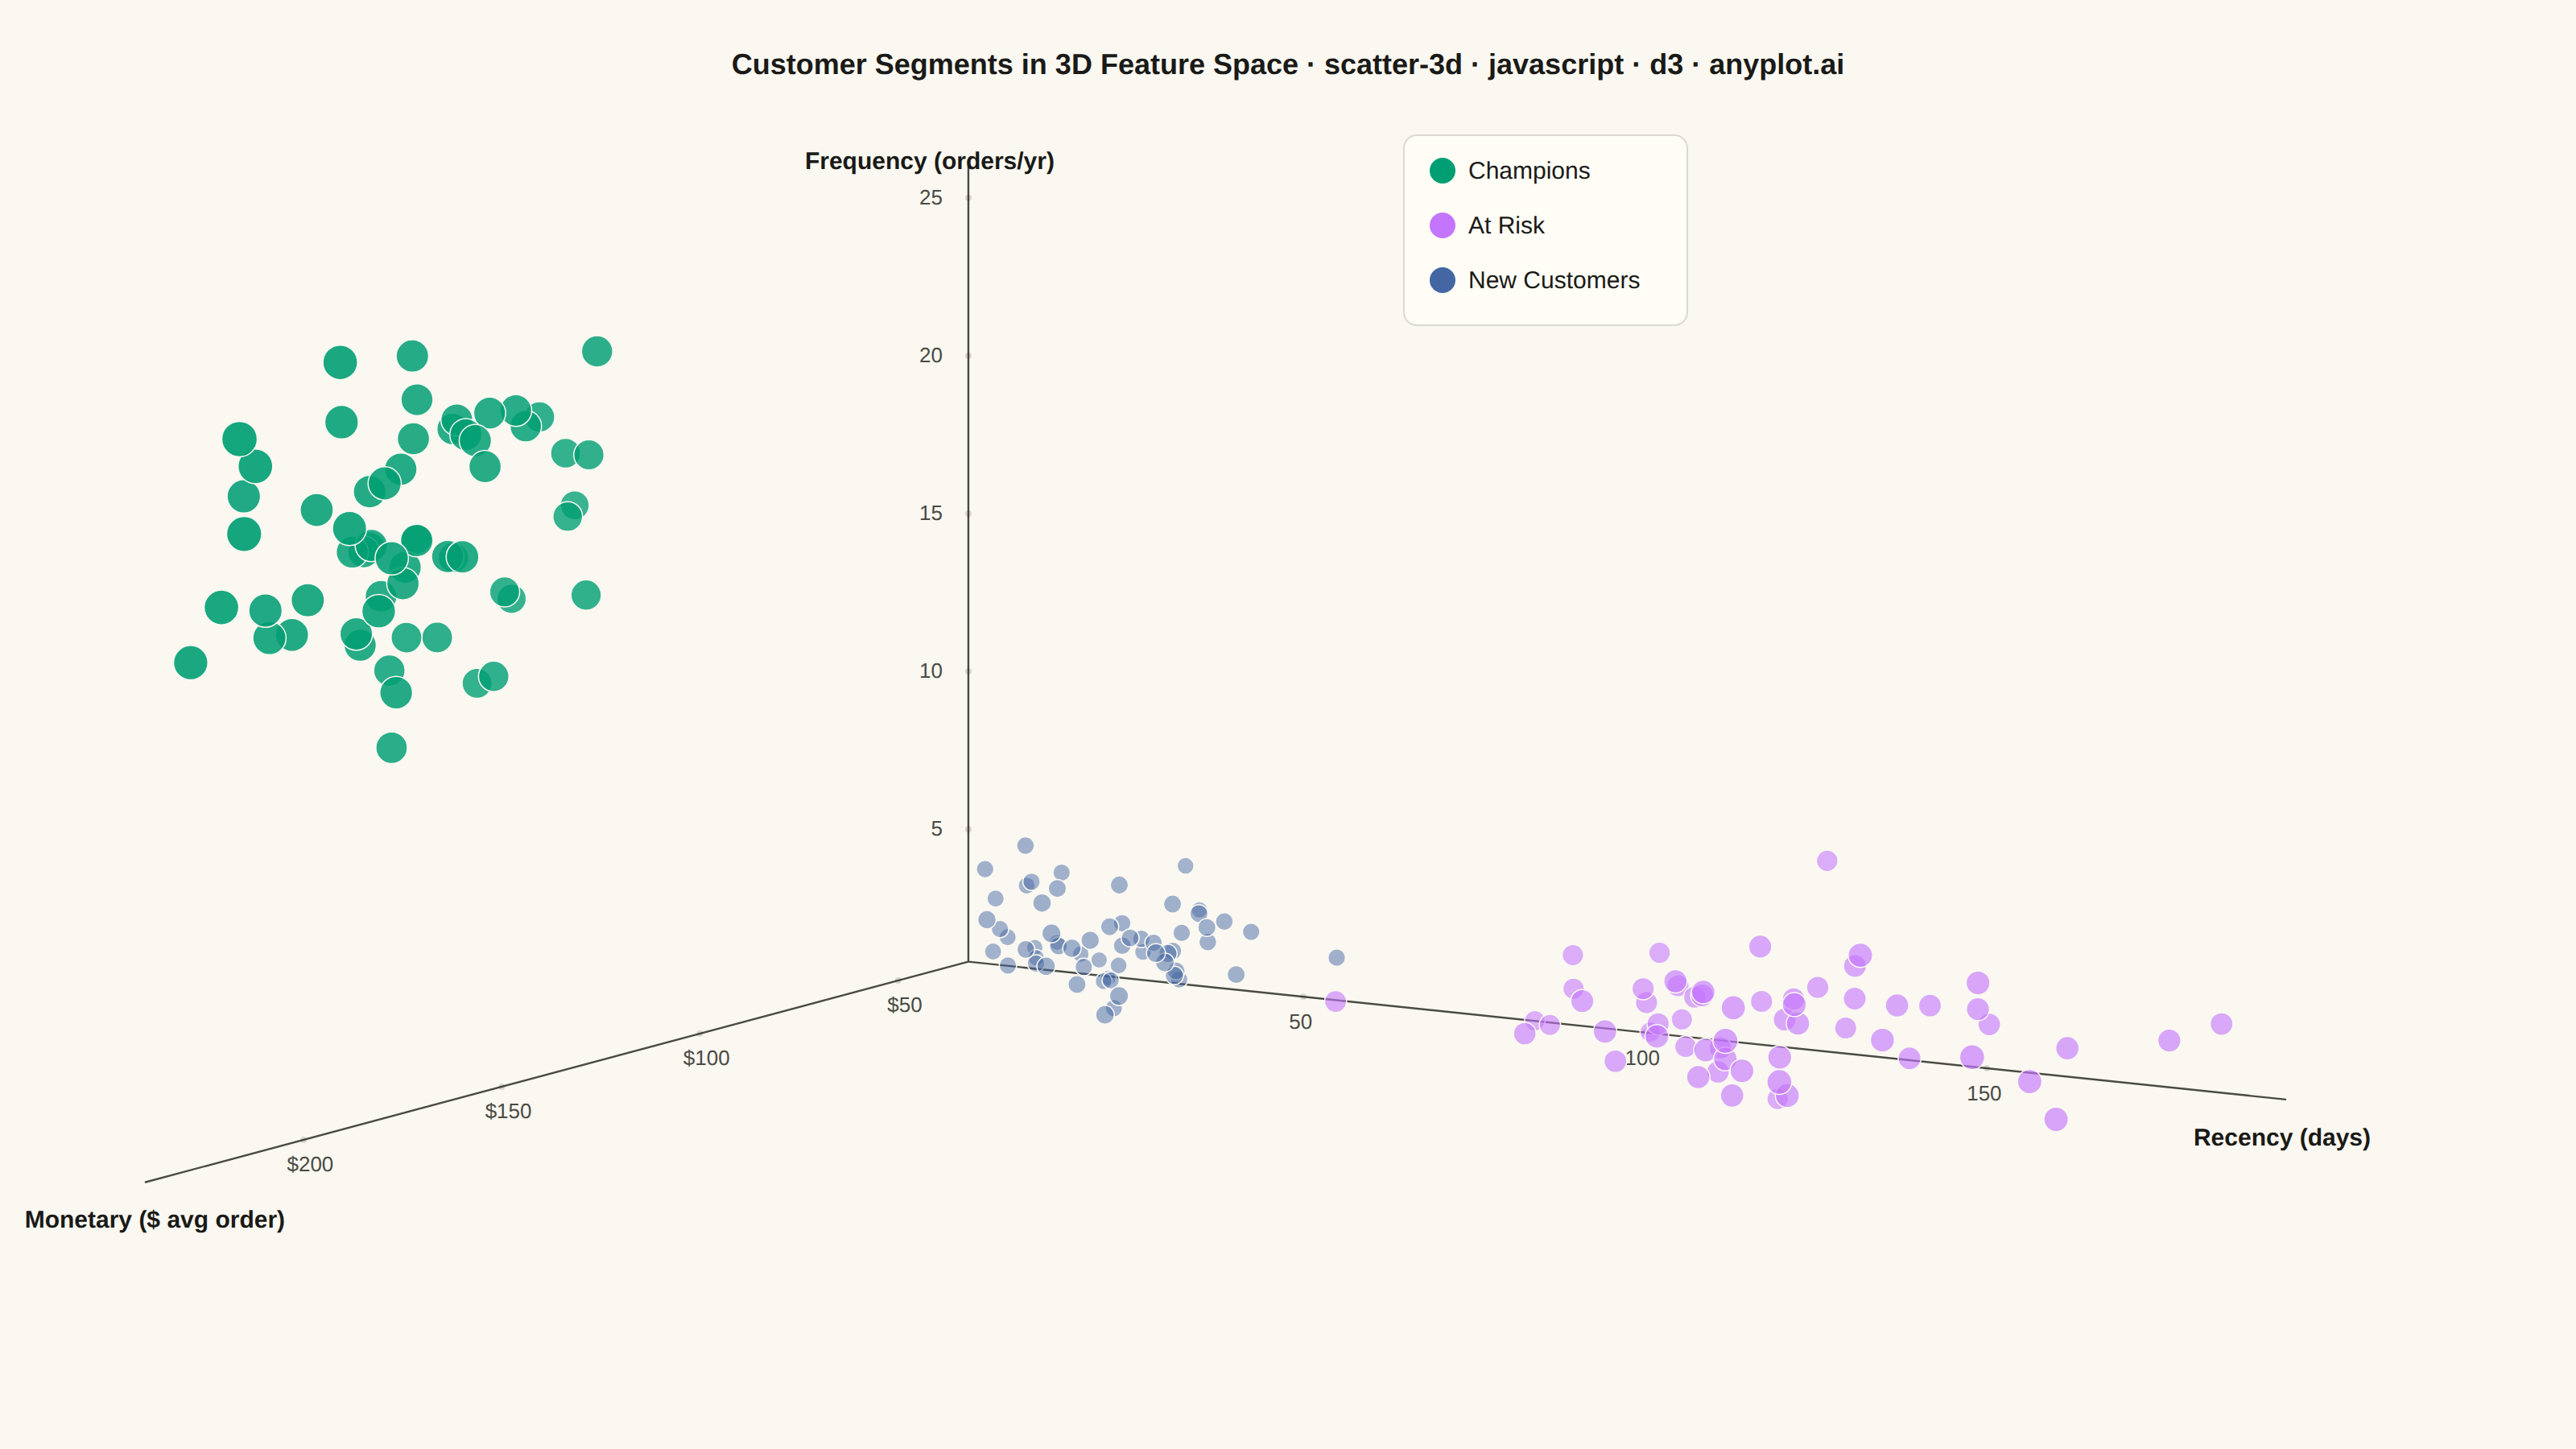
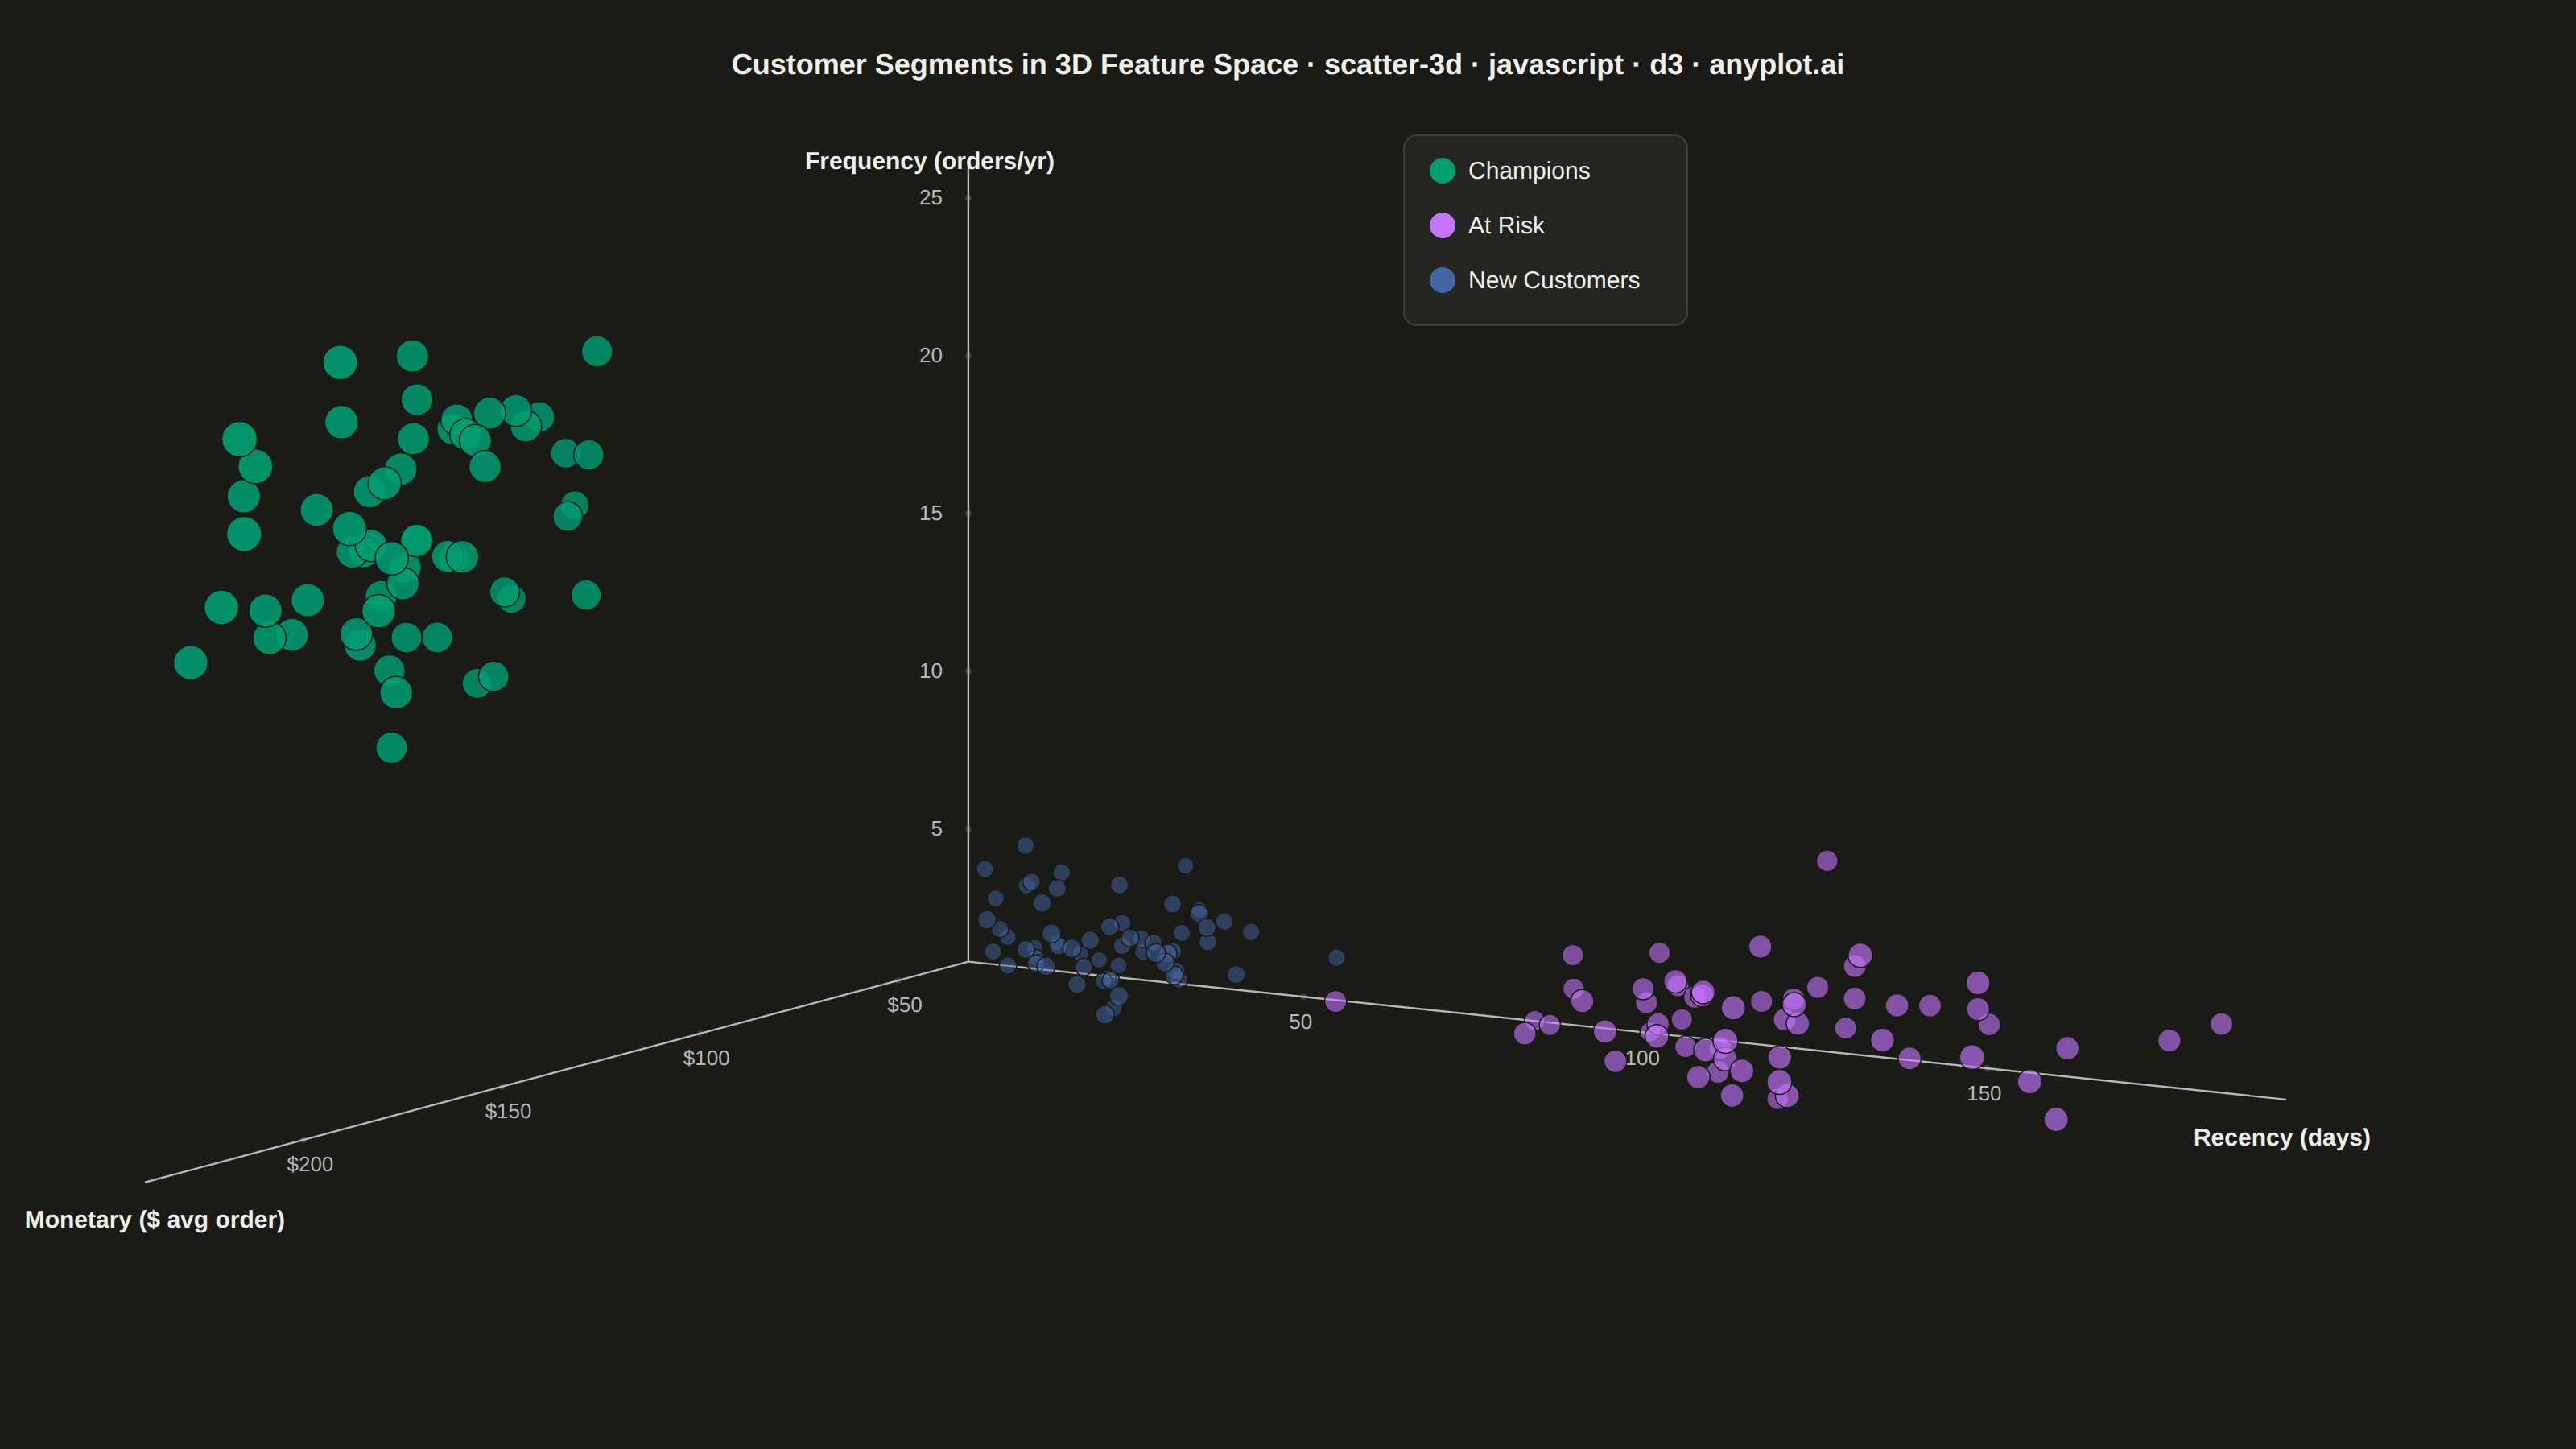
The same plot in 13 other libraries — JavaScript: Chart.js, Apache ECharts, Highcharts, MUI X Charts; Python: Altair, Bokeh, lets-plot, Matplotlib, Plotly, Pygal, Seaborn; R: ggplot2; Julia: Makie.jl. Compare all 14 side by side: 3D Scatter Plot in Python, R, Julia and JavaScript.
A three-dimensional scatter plot that displays the relationship between three numeric variables by plotting points in 3D space. This visualization extends the classic 2D scatter plot to reveal patterns, clusters, and correlations across three dimensions simultaneously, making it invaluable for multivariate data exploration.
// anyplot.ai
// scatter-3d: 3D Scatter Plot
// Library: d3 7.9.0 | JavaScript 22.23.2
// Quality: 89/100 | Created: 2026-09-10

const t = window.ANYPLOT_TOKENS;
const { width, height } = window.ANYPLOT_SIZE;

// --- Data: customer segments across three RFM behavioral dimensions --------
// (Recency, Frequency, Monetary — a classic feature space for spotting
// customer clusters in retention/marketing analysis.)
function mulberry32(seed) {
  return function () {
    seed |= 0;
    seed = (seed + 0x6d2b79f5) | 0;
    let x = Math.imul(seed ^ (seed >>> 15), 1 | seed);
    x = (x + Math.imul(x ^ (x >>> 7), 61 | x)) ^ x;
    return ((x ^ (x >>> 14)) >>> 0) / 4294967296;
  };
}
const random = mulberry32(42);
function gaussian() {
  const u1 = Math.max(random(), 1e-9);
  const u2 = random();
  return Math.sqrt(-2 * Math.log(u1)) * Math.cos(2 * Math.PI * u2);
}

const segments = [
  { name: "Champions", n: 60, recency: [12, 4], frequency: [20, 3], monetary: [190, 25] },
  { name: "At Risk", n: 60, recency: [150, 22], frequency: [4, 1.4], monetary: [85, 15] },
  { name: "New Customers", n: 60, recency: [32, 9], frequency: [3, 1], monetary: [55, 12] },
];

const points = [];
segments.forEach((seg, segIndex) => {
  for (let i = 0; i < seg.n; i++) {
    points.push({
      segment: seg.name,
      segIndex,
      recency: Math.max(1, seg.recency[0] + gaussian() * seg.recency[1]),
      frequency: Math.max(0.5, seg.frequency[0] + gaussian() * seg.frequency[1]),
      monetary: Math.max(10, seg.monetary[0] + gaussian() * seg.monetary[1]),
    });
  }
});

// --- Normalize each axis into a [-1, 1] cube for the 3D projection ---------
const normX = d3.scaleLinear().domain(d3.extent(points, (d) => d.recency)).range([-1, 1]);
const normY = d3.scaleLinear().domain(d3.extent(points, (d) => d.frequency)).range([-1, 1]);
const normZ = d3.scaleLinear().domain(d3.extent(points, (d) => d.monetary)).range([-1, 1]);

// --- Axonometric projection: fixed camera angle, no interactive rotation ---
// (D3 has no native 3D scene graph — this rotates the normalized cube with a
// standard yaw/pitch rotation matrix and keeps the post-rotation z as a depth
// value for painter's-algorithm ordering and near/far size + opacity cueing.)
const yaw = (-32 * Math.PI) / 180;
const pitch = (18 * Math.PI) / 180;

function project(x, y, z) {
  const x1 = x * Math.cos(yaw) + z * Math.sin(yaw);
  const z1 = -x * Math.sin(yaw) + z * Math.cos(yaw);
  const y2 = y * Math.cos(pitch) - z1 * Math.sin(pitch);
  const z2 = y * Math.sin(pitch) + z1 * Math.cos(pitch);
  return { sx: x1, sy: y2, depth: z2 };
}

// Frame the view from the 8 cube corners so the projection is data-independent.
const corners = [];
for (const cx of [-1, 1]) for (const cy of [-1, 1]) for (const cz of [-1, 1]) corners.push(project(cx, cy, cz));

const margin = { top: 100, right: 180, bottom: 80, left: 90 };
const screenX = d3.scaleLinear().domain(d3.extent(corners, (c) => c.sx)).range([margin.left, width - margin.right]);
const screenY = d3.scaleLinear().domain(d3.extent(corners, (c) => c.sy)).range([height - margin.bottom, margin.top]);

const projected = points.map((d) => ({ ...d, ...project(normX(d.recency), normY(d.frequency), normZ(d.monetary)) }));
const depthExtent = d3.extent(projected, (d) => d.depth);
const radiusScale = d3.scaleLinear().domain(depthExtent).range([6, 11]);
const opacityScale = d3.scaleLinear().domain(depthExtent).range([0.55, 0.92]);
// Push the "Champions" segment forward as the focal cluster by keeping it at
// full size/opacity while slightly de-emphasizing the two background segments.
const emphasis = (segIndex) => (segIndex === 0 ? 1 : 0.82);

const color = d3.scaleOrdinal().domain(segments.map((s) => s.name)).range(t.palette);

// --- SVG mount ---------------------------------------------------------------
const svg = d3.select("#container").append("svg").attr("width", width).attr("height", height);

// --- 3D axes: three edges from the cube's front-bottom-left corner ---------
const axes = [
  { label: "Recency (days)", from: [-1, -1, -1], to: [1, -1, -1], scale: normX, format: d3.format(".0f") },
  { label: "Frequency (orders/yr)", from: [-1, -1, -1], to: [-1, 1, -1], scale: normY, format: d3.format(".0f") },
  { label: "Monetary ($ avg order)", from: [-1, -1, -1], to: [-1, -1, 1], scale: normZ, format: (v) => `$${d3.format(".0f")(v)}` },
];

// The three axes share one corner; offset tick labels and axis titles
// perpendicular to each axis line, pointing away from that shared tripod
// center, so labels never crowd the axis line or a neighboring title.
const axisEndsPx = axes.map((axis) => {
  const p0 = project(...axis.from);
  const p1 = project(...axis.to);
  return { x0: screenX(p0.sx), y0: screenY(p0.sy), x1: screenX(p1.sx), y1: screenY(p1.sy) };
});
const tripodCenter = {
  x: d3.mean([axisEndsPx[0].x0, ...axisEndsPx.map((e) => e.x1)]),
  y: d3.mean([axisEndsPx[0].y0, ...axisEndsPx.map((e) => e.y1)]),
};

const axisGroup = svg.append("g");
axes.forEach((axis, i) => {
  const { x0, y0, x1, y1 } = axisEndsPx[i];
  const dx = x1 - x0;
  const dy = y1 - y0;
  const len = Math.hypot(dx, dy) || 1;
  const dir = { x: dx / len, y: dy / len };
  let perp = { x: -dir.y, y: dir.x };
  const mid = { x: (x0 + x1) / 2, y: (y0 + y1) / 2 };
  if (perp.x * (mid.x - tripodCenter.x) + perp.y * (mid.y - tripodCenter.y) < 0) {
    perp = { x: -perp.x, y: -perp.y };
  }
  const anchorFor = (vx) => (vx > 0.35 ? "start" : vx < -0.35 ? "end" : "middle");

  axisGroup
    .append("line")
    .attr("x1", x0)
    .attr("y1", y0)
    .attr("x2", x1)
    .attr("y2", y1)
    .attr("stroke", t.inkSoft)
    .attr("stroke-width", 1.2);

  axis.scale.ticks(4).forEach((value) => {
    const tPos = axis.scale(value);
    const point = axis.from.map((v, idx) => (axis.to[idx] !== v ? tPos : v));
    const pr = project(...point);
    const px = screenX(pr.sx);
    const py = screenY(pr.sy);
    axisGroup
      .append("circle")
      .attr("cx", px)
      .attr("cy", py)
      .attr("r", 2)
      .attr("fill", t.grid);
    const lx = px + perp.x * 16;
    const ly = py + perp.y * 16;
    axisGroup
      .append("text")
      .attr("x", lx)
      .attr("y", ly)
      .attr("dy", "0.32em")
      .attr("text-anchor", anchorFor(perp.x))
      .attr("fill", t.inkSoft)
      .style("font-size", "13px")
      .text(axis.format(value));
  });

  // Titles stay "middle"-anchored (long strings would overflow the canvas
  // edge under a directional anchor near the tripod's outer corners) and are
  // only nudged perpendicular to the axis, clear of the last tick label.
  const tx = x1 + perp.x * 24;
  const ty = y1 + perp.y * 24;
  axisGroup
    .append("text")
    .attr("x", tx)
    .attr("y", ty)
    .attr("dy", "0.32em")
    .attr("text-anchor", "middle")
    .attr("fill", t.ink)
    .style("font-size", "15px")
    .style("font-weight", "600")
    .text(axis.label);
});

// --- Scatter points, painter's algorithm (far to near) ----------------------
svg
  .append("g")
  .selectAll("circle.point")
  .data([...projected].sort((a, b) => a.depth - b.depth))
  .join("circle")
  .attr("class", "point")
  .attr("cx", (d) => screenX(d.sx))
  .attr("cy", (d) => screenY(d.sy))
  .attr("r", (d) => radiusScale(d.depth) * emphasis(d.segIndex))
  .attr("fill", (d) => color(d.segment))
  .attr("fill-opacity", (d) => opacityScale(d.depth) * emphasis(d.segIndex))
  .attr("stroke", t.pageBg)
  .attr("stroke-width", 0.75);

// --- Legend -------------------------------------------------------------------
// Placed inside the plot's own empty upper-mid-right region (above the "At
// Risk" cluster, beside "Champions") rather than the far outer margin, so it
// reads as part of the composition instead of an isolated corner element.
const innerWidth = width - margin.left - margin.right;
const legendX = margin.left + innerWidth * 0.6;
const legendY = margin.top + 6;
const legend = svg.append("g").attr("transform", `translate(${legendX}, ${legendY})`);
legend
  .append("rect")
  .attr("x", -16)
  .attr("y", -22)
  .attr("width", 176)
  .attr("height", segments.length * 34 + 16)
  .attr("rx", 8)
  .attr("fill", t.elevatedBg)
  .attr("stroke", t.grid)
  .attr("stroke-width", 1);
segments.forEach((seg, i) => {
  const row = legend.append("g").attr("transform", `translate(0, ${i * 34})`);
  row.append("circle").attr("r", 8).attr("cx", 8).attr("cy", 0).attr("fill", color(seg.name));
  row.append("text").attr("x", 24).attr("y", 5).attr("fill", t.ink).style("font-size", "15px").text(seg.name);
});

// --- Title --------------------------------------------------------------------
const titleText = "Customer Segments in 3D Feature Space · scatter-3d · javascript · d3 · anyplot.ai";
const titleFontSize = Math.max(15, Math.round(22 * Math.min(1, 67 / titleText.length)));
svg
  .append("text")
  .attr("x", width / 2)
  .attr("y", 46)
  .attr("text-anchor", "middle")
  .attr("fill", t.ink)
  .style("font-size", `${titleFontSize}px`)
  .style("font-weight", "600")
  .text(titleText);
Runnable source as JSON, for any HTTP client: https://api.anyplot.ai/specs/scatter-3d/d3/code. Any spec id and library id listed in llms-full.txt fit the same URL shape; every URL below is complete and callable.
{
  "spec_id": "scatter-3d",
  "language": "javascript",
  "library": "d3",
  "page": "https://anyplot.ai/scatter-3d/javascript/d3",
  "hub": "https://anyplot.ai/scatter-3d",
  "code_json": "https://api.anyplot.ai/specs/scatter-3d/d3/code",
  "spec_json": "https://api.anyplot.ai/specs/scatter-3d",
  "render_light_png": "https://storage.googleapis.com/anyplot-images/plots/scatter-3d/javascript/d3/plot-light.png",
  "render_dark_png": "https://storage.googleapis.com/anyplot-images/plots/scatter-3d/javascript/d3/plot-dark.png",
  "interactive_light_html": "https://storage.googleapis.com/anyplot-images/plots/scatter-3d/javascript/d3/plot-light.html",
  "interactive_dark_html": "https://storage.googleapis.com/anyplot-images/plots/scatter-3d/javascript/d3/plot-dark.html",
  "quality_score": 89.0,
  "license": "MIT",
  "guide": "https://anyplot.ai/llms.txt"
}
Part of 3D Scatter Plot on anyplot.ai.