The same plot in 13 other libraries — JavaScript: Chart.js, D3.js, Apache ECharts, MUI X Charts; Python: Altair, Bokeh, lets-plot, Matplotlib, Plotly, Pygal, Seaborn; R: ggplot2; Julia: Makie.jl. Compare all 14 side by side: 3D Scatter Plot in Python, R, Julia and JavaScript.
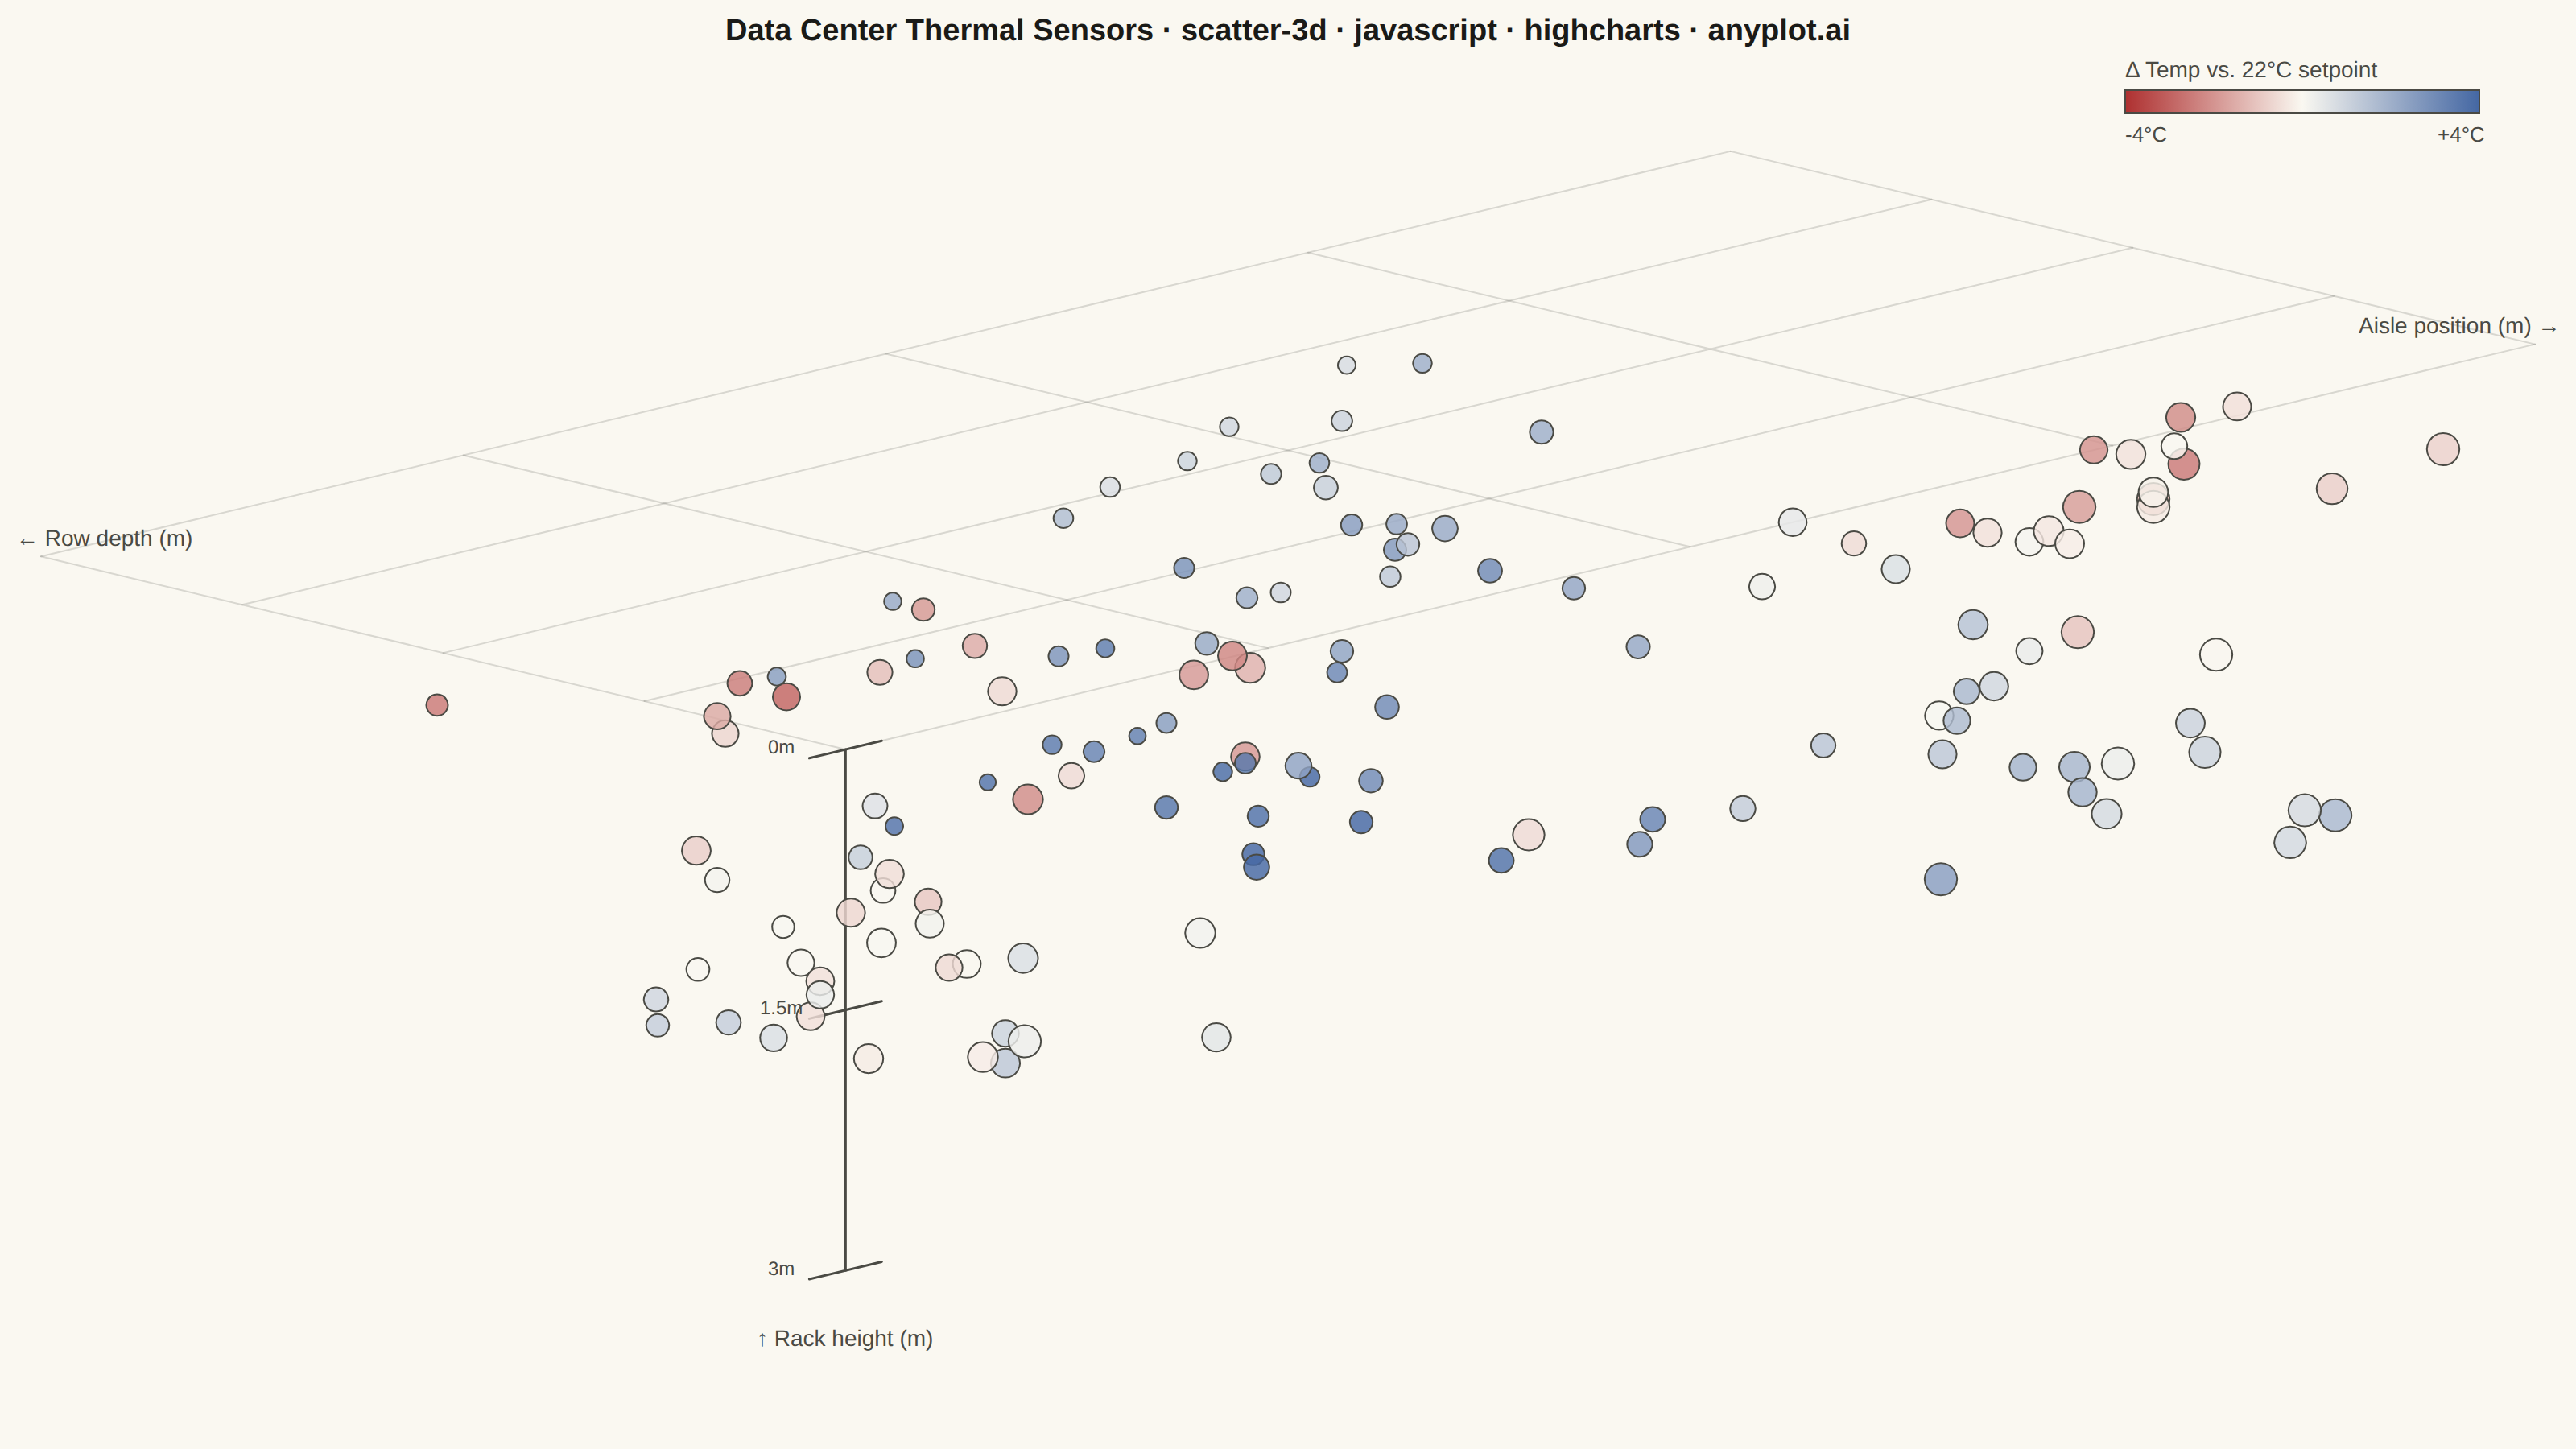
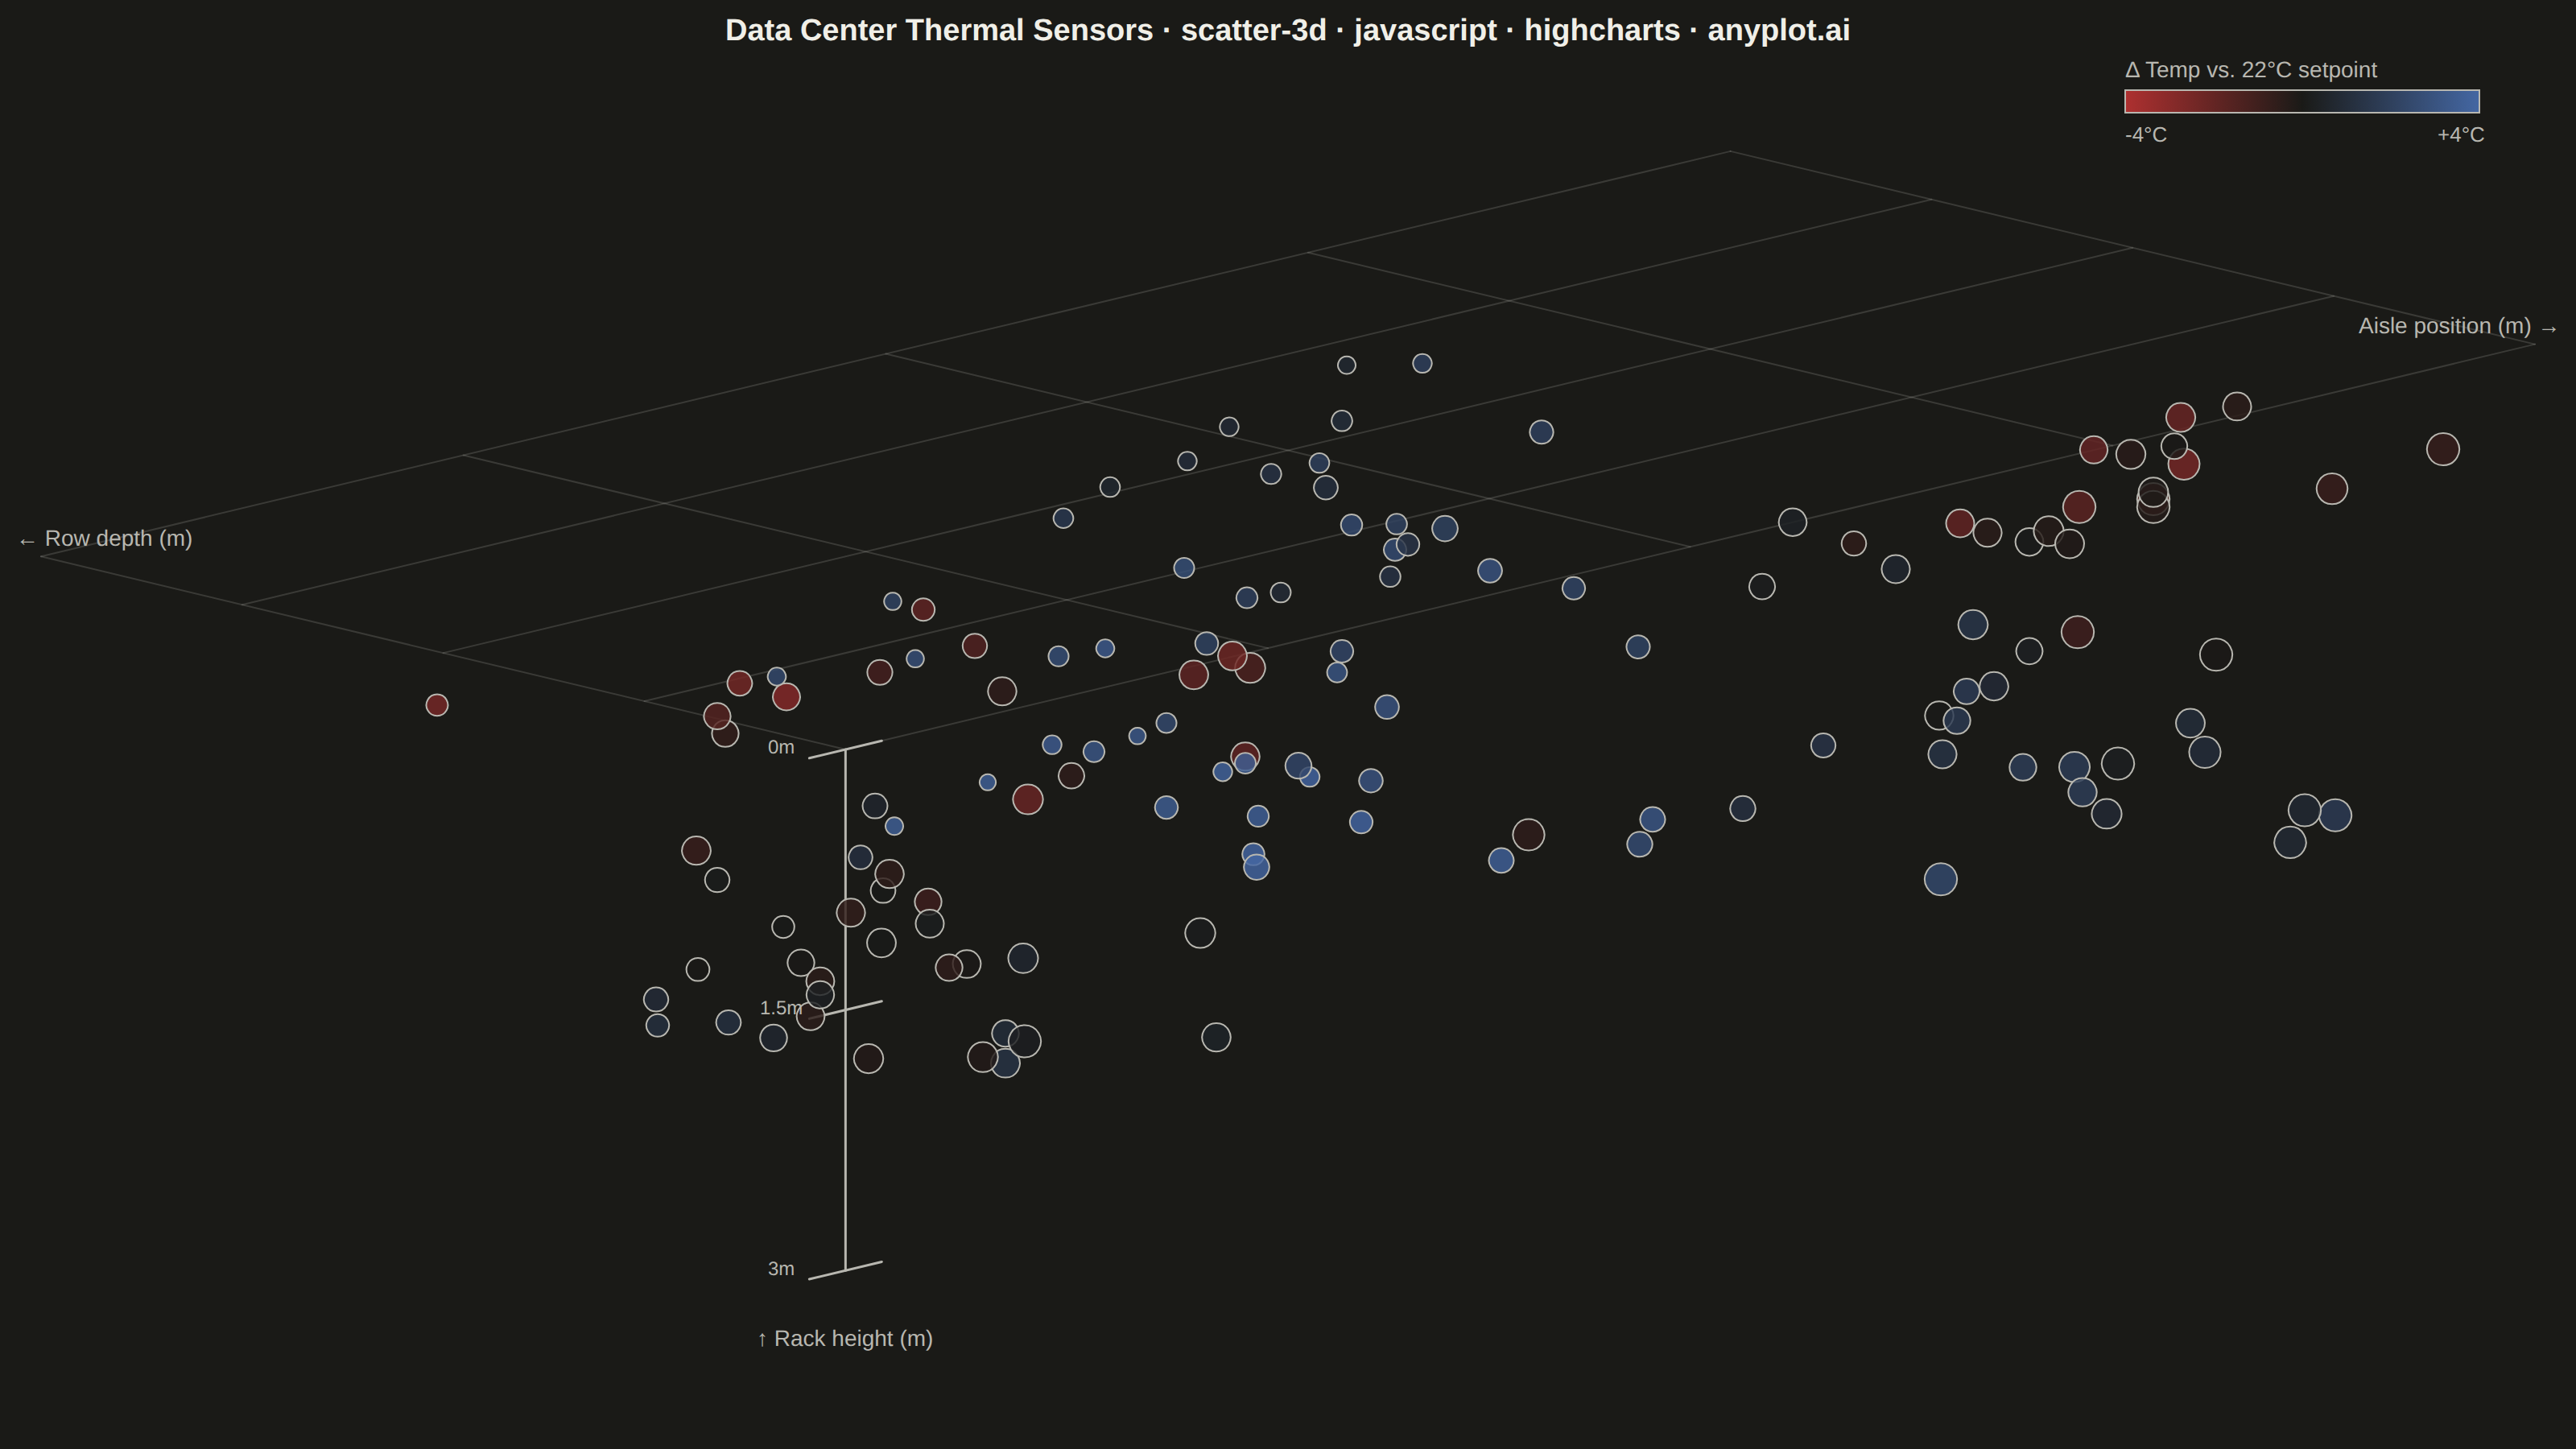
A three-dimensional scatter plot that displays the relationship between three numeric variables by plotting points in 3D space. This visualization extends the classic 2D scatter plot to reveal patterns, clusters, and correlations across three dimensions simultaneously, making it invaluable for multivariate data exploration.
// anyplot.ai
// scatter-3d: 3D Scatter Plot
// Library: highcharts 12.6.0 | JavaScript 22.23.2
// Quality: 84/100 | Created: 2026-09-10

const t = window.ANYPLOT_TOKENS;

// --- Data (in-memory, deterministic) ----------------------------------------
// Server-hall thermal sensors: x = aisle position (m), z = row depth (m),
// y = rack height (m). Points fall into three rack rows (clusters); color
// encodes the temperature deviation from the 22 °C cooling setpoint — the
// fourth, continuous variable from the spec.
function makeLcg(seed) {
  let state = seed;
  return function lcg() {
    state = (state * 1103515245 + 12345) & 0x7fffffff;
    return state / 0x7fffffff;
  };
}
const rand = makeLcg(42);
function gaussian() {
  const u1 = Math.max(rand(), 1e-6);
  const u2 = rand();
  return Math.sqrt(-2 * Math.log(u1)) * Math.cos(2 * Math.PI * u2);
}

const X_MAX = 42; // aisle extent, m
const Z_MAX = 20; // row depth extent, m
const Y_MAX = 3; // rack height extent, m
const VERTICAL_EXAGGERATION = 9; // exaggerate height so the y-axis reads clearly

const CLUSTERS = [
  { x: 8, z: 6, biasC: -0.6, n: 46 }, // Row A
  { x: 24, z: 14, biasC: 2.6, n: 50 }, // Row B — hot aisle
  { x: 34, z: 4, biasC: 0.4, n: 44 }, // Row C
];

const sensors = [];
CLUSTERS.forEach((cluster) => {
  for (let i = 0; i < cluster.n; i += 1) {
    const xPos = Math.min(Math.max(cluster.x + gaussian() * 3.2, 0), X_MAX);
    const zPos = Math.min(Math.max(cluster.z + gaussian() * 3.2, 0), Z_MAX);
    const height = Math.min(Math.max(0.3 + rand() * 2.4, 0), Y_MAX);
    const tempDeviation = cluster.biasC + (height - 1.5) * 1.15 + gaussian() * 0.7;
    sensors.push({ x: xPos, y: height, z: zPos, colorValue: tempDeviation });
  }
});

// --- Isometric projection ----------------------------------------------------
// Highcharts core has no 3D module (highcharts-3d is an add-on, out of scope —
// see prompts/library/highcharts.md). A classic axonometric transform still
// gives an honest 3D read from plain x/y scatter coordinates, no z-axis needed.
const ISO_ANGLE = Math.PI / 6;
function project(x, y, z) {
  return {
    px: (x - z) * Math.cos(ISO_ANGLE),
    py: (x + z) * Math.sin(ISO_ANGLE) - y * VERTICAL_EXAGGERATION,
  };
}

// Plain `scatter` series isn't in Highcharts' colorAxis-composed series list
// (only scatter3d/bubble/heatmap/… are), so per-point colorAxis coloring is
// silently ignored for it — interpolate the imprint_div stops by hand instead.
const TEMP_RANGE = 4; // °C, symmetric around the setpoint
function hexToRgb(hex) {
  const n = parseInt(hex.slice(1), 16);
  return [(n >> 16) & 255, (n >> 8) & 255, n & 255];
}
function lerpHex(hexA, hexB, frac) {
  const a = hexToRgb(hexA);
  const b = hexToRgb(hexB);
  const rgb = a.map((v, i) => Math.round(v + (b[i] - v) * frac));
  return `rgb(${rgb.join(",")})`;
}
function divergingColor(value) {
  const frac = Math.min(Math.max((value + TEMP_RANGE) / (2 * TEMP_RANGE), 0), 1);
  return frac < 0.5 ? lerpHex(t.div[0], t.div[1], frac / 0.5) : lerpHex(t.div[1], t.div[2], (frac - 0.5) / 0.5);
}
// Light alpha blending so overlapping sensors in the denser clusters stay legible.
const POINT_ALPHA = 0.82;
function withAlpha(rgb, alpha) {
  return rgb.replace("rgb(", "rgba(").replace(")", `,${alpha})`);
}

const sensorPoints = sensors.map((s) => {
  const { px, py } = project(s.x, s.y, s.z);
  const depthT = s.z / Z_MAX; // farther rows (larger z) sit smaller — depth cue
  return {
    x: px,
    y: py,
    colorValue: s.colorValue,
    color: withAlpha(divergingColor(s.colorValue), POINT_ALPHA),
    origX: s.x,
    origY: s.y,
    origZ: s.z,
    marker: { radius: 10 - depthT * 5 },
  };
});

// --- Reference wireframe (floor grid + height axis) ---------------------------
function gridLine(a, b) {
  return [project(a[0], a[1], a[2]), project(b[0], b[1], b[2])].map((p) => [p.px, p.py]);
}
const floorLines = [];
for (let z = 0; z <= Z_MAX; z += Z_MAX / 4) floorLines.push(gridLine([0, 0, z], [X_MAX, 0, z]));
for (let x = 0; x <= X_MAX; x += X_MAX / 4) floorLines.push(gridLine([x, 0, 0], [x, 0, Z_MAX]));

const heightAxisLine = gridLine([0, 0, 0], [0, Y_MAX, 0]);

// Numeric tick marks along the height axis so absolute values are readable,
// not just the "↑ Rack height (m)" direction label.
const HEIGHT_TICKS = [0, 1.5, 3];
const heightTickLines = HEIGHT_TICKS.map((h) => gridLine([-0.9, h, 0], [0.9, h, 0]));
const heightTickLabels = HEIGHT_TICKS.map((h) => {
  const p = project(-1.6, h, 0);
  return { x: p.px, y: p.py, name: `${h}m` };
});

const axisLabelPoints = [
  { p: project(X_MAX, 0, 0), text: "Aisle position (m) →" },
  { p: project(0, 0, Z_MAX), text: "← Row depth (m)" },
  // Sits a bit past the topmost tick (Y_MAX) so it doesn't collide with it.
  { p: project(0, Y_MAX + 0.5, 0), text: "↑ Rack height (m)" },
].map((d) => ({ x: d.p.px, y: d.p.py, name: d.text }));

// --- Chart --------------------------------------------------------------------
// Highcharts' built-in colorAxis legend only composes onto series types that
// ship in add-on modules (bubble/heatmap/…), none of which are loaded — so the
// Δ-temp color scale is drawn by hand with the core renderer once the chart
// has laid out (chart.events.load), reading the same divergingColor() stops
// used to color the points above.
function drawColorLegend(chart) {
  const barWidth = 220;
  const barHeight = 14;
  const barX = chart.chartWidth - barWidth - 60;
  const barY = 56;
  chart.renderer
    .text("Δ Temp vs. 22°C setpoint", barX, barY - 8)
    .css({ color: t.inkSoft, fontSize: "14px" })
    .add();
  chart.renderer
    .rect(barX, barY, barWidth, barHeight)
    .attr({
      fill: {
        linearGradient: { x1: 0, y1: 0, x2: 1, y2: 0 },
        stops: [
          [0, t.div[0]],
          [0.5, t.div[1]],
          [1, t.div[2]],
        ],
      },
      stroke: t.inkSoft,
      "stroke-width": 1,
    })
    .add();
  chart.renderer
    .text(`${-TEMP_RANGE}°C`, barX, barY + barHeight + 18)
    .css({ color: t.inkSoft, fontSize: "13px" })
    .add();
  chart.renderer
    .text(`+${TEMP_RANGE}°C`, barX + barWidth - 26, barY + barHeight + 18)
    .css({ color: t.inkSoft, fontSize: "13px" })
    .add();
}

Highcharts.chart("container", {
  chart: {
    type: "scatter",
    backgroundColor: "transparent",
    animation: false,
    style: { fontFamily: "inherit" },
    events: { load: function onLoad() { drawColorLegend(this); } },
  },
  credits: { enabled: false },
  colors: t.palette,
  title: {
    text: "Data Center Thermal Sensors · scatter-3d · javascript · highcharts · anyplot.ai",
    style: { color: t.ink, fontSize: "19px", fontWeight: "600" },
  },
  xAxis: { visible: false },
  yAxis: { visible: false, title: { text: null } },
  legend: { enabled: false },
  tooltip: {
    pointFormat:
      "Aisle: {point.origX:.1f} m<br/>Row depth: {point.origZ:.1f} m<br/>" +
      "Rack height: {point.origY:.1f} m<br/>ΔTemp: {point.colorValue:.1f}°C",
  },
  plotOptions: {
    series: { animation: false },
  },
  series: [
    ...floorLines.map((line) => ({
      type: "line",
      data: line,
      color: t.grid,
      lineWidth: 1,
      marker: { enabled: false },
      enableMouseTracking: false,
      showInLegend: false,
    })),
    {
      type: "line",
      data: heightAxisLine,
      color: t.inkSoft,
      lineWidth: 1.5,
      marker: { enabled: false },
      enableMouseTracking: false,
      showInLegend: false,
    },
    ...heightTickLines.map((line) => ({
      type: "line",
      data: line,
      color: t.inkSoft,
      lineWidth: 1.5,
      marker: { enabled: false },
      enableMouseTracking: false,
      showInLegend: false,
    })),
    {
      type: "scatter",
      name: "Height ticks",
      data: heightTickLabels,
      marker: { enabled: false },
      enableMouseTracking: false,
      showInLegend: false,
      dataLabels: {
        enabled: true,
        format: "{point.name}",
        style: { color: t.inkSoft, fontSize: "12px", fontWeight: "normal", textOutline: "none" },
      },
    },
    {
      type: "scatter",
      name: "Axis labels",
      data: axisLabelPoints,
      marker: { enabled: false },
      enableMouseTracking: false,
      showInLegend: false,
      dataLabels: {
        enabled: true,
        format: "{point.name}",
        style: { color: t.inkSoft, fontSize: "14px", fontWeight: "normal", textOutline: "none" },
      },
    },
    {
      type: "scatter",
      name: "Sensors",
      data: sensorPoints,
      showInLegend: false,
      // Fill is the diverging color, which equals PAGE_BG right at the
      // midpoint — an inkSoft stroke (not PAGE_BG) keeps near-zero-deviation
      // points from vanishing into the background. Explicit circle symbol
      // avoids Highcharts' default per-series-index symbol cycling (which
      // otherwise lands this series on squares).
      marker: { symbol: "circle", lineColor: t.inkSoft, lineWidth: 1 },
    },
  ],
});
Runnable source as JSON, for any HTTP client: https://api.anyplot.ai/specs/scatter-3d/highcharts/code. Any spec id and library id listed in llms-full.txt fit the same URL shape; every URL below is complete and callable.
{
  "spec_id": "scatter-3d",
  "language": "javascript",
  "library": "highcharts",
  "page": "https://anyplot.ai/scatter-3d/javascript/highcharts",
  "hub": "https://anyplot.ai/scatter-3d",
  "code_json": "https://api.anyplot.ai/specs/scatter-3d/highcharts/code",
  "spec_json": "https://api.anyplot.ai/specs/scatter-3d",
  "render_light_png": "https://storage.googleapis.com/anyplot-images/plots/scatter-3d/javascript/highcharts/plot-light.png",
  "render_dark_png": "https://storage.googleapis.com/anyplot-images/plots/scatter-3d/javascript/highcharts/plot-dark.png",
  "interactive_light_html": "https://storage.googleapis.com/anyplot-images/plots/scatter-3d/javascript/highcharts/plot-light.html",
  "interactive_dark_html": "https://storage.googleapis.com/anyplot-images/plots/scatter-3d/javascript/highcharts/plot-dark.html",
  "quality_score": 84.0,
  "license": "MIT",
  "guide": "https://anyplot.ai/llms.txt"
}
Part of 3D Scatter Plot on anyplot.ai.