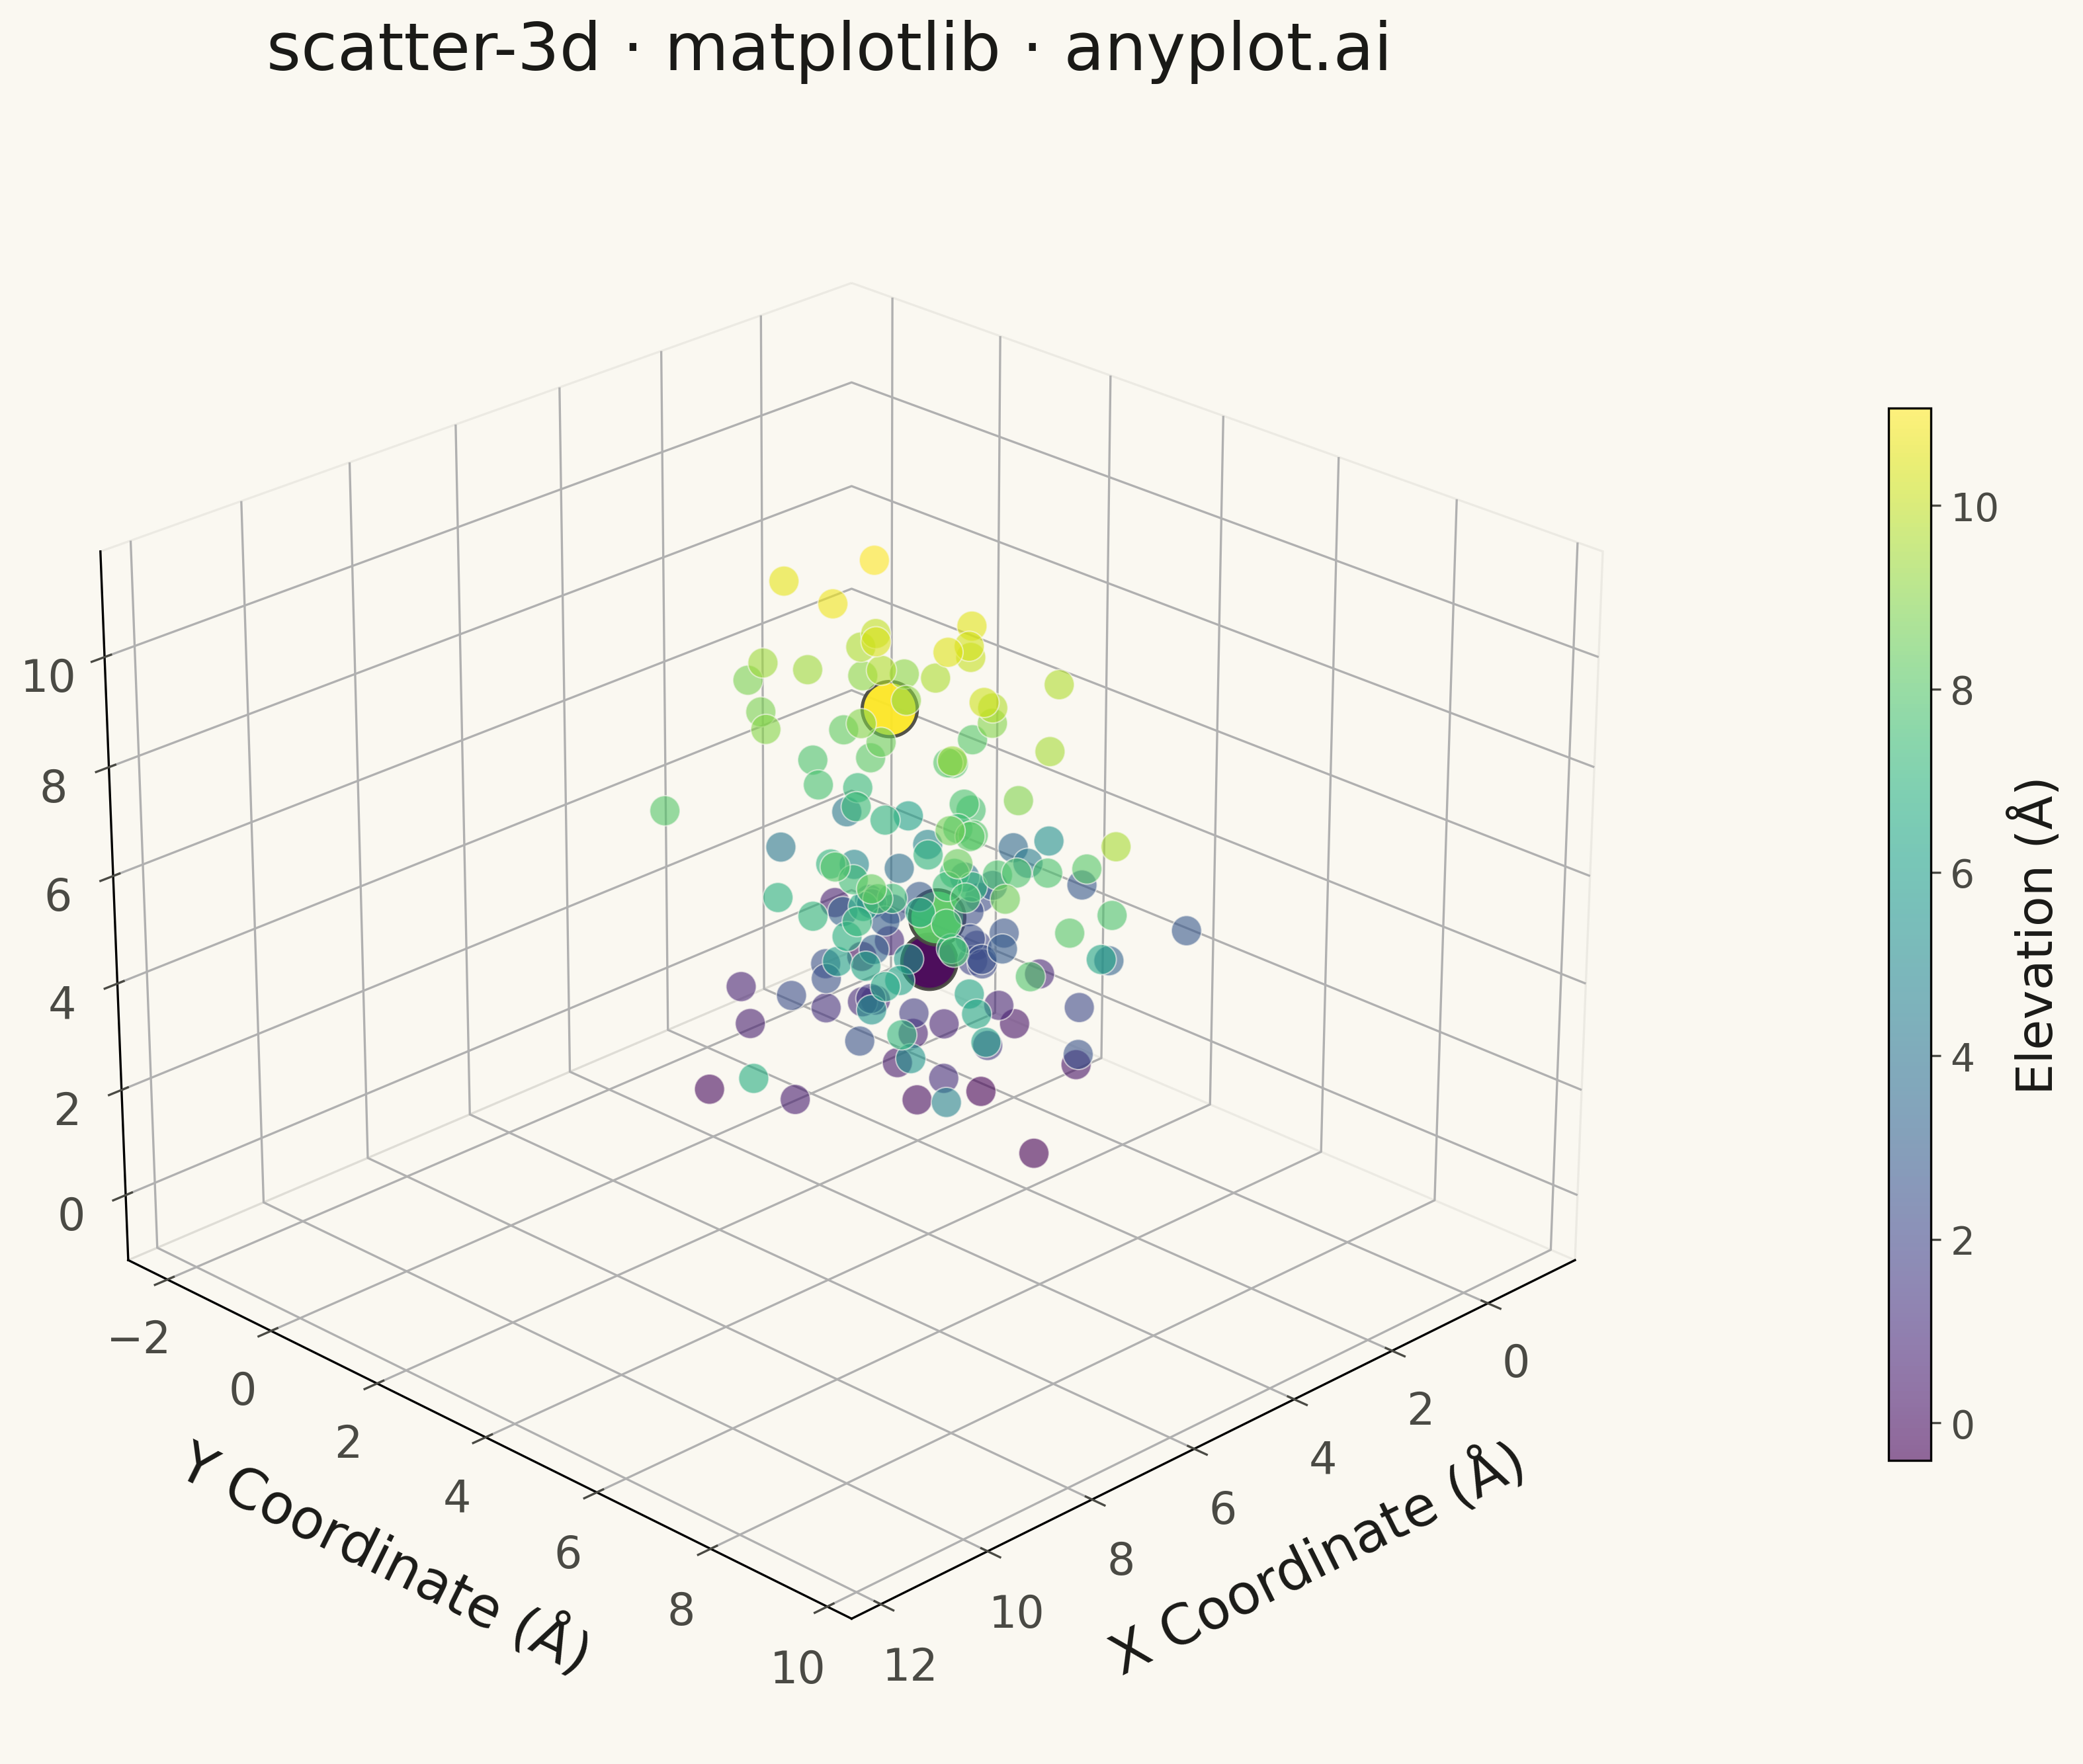
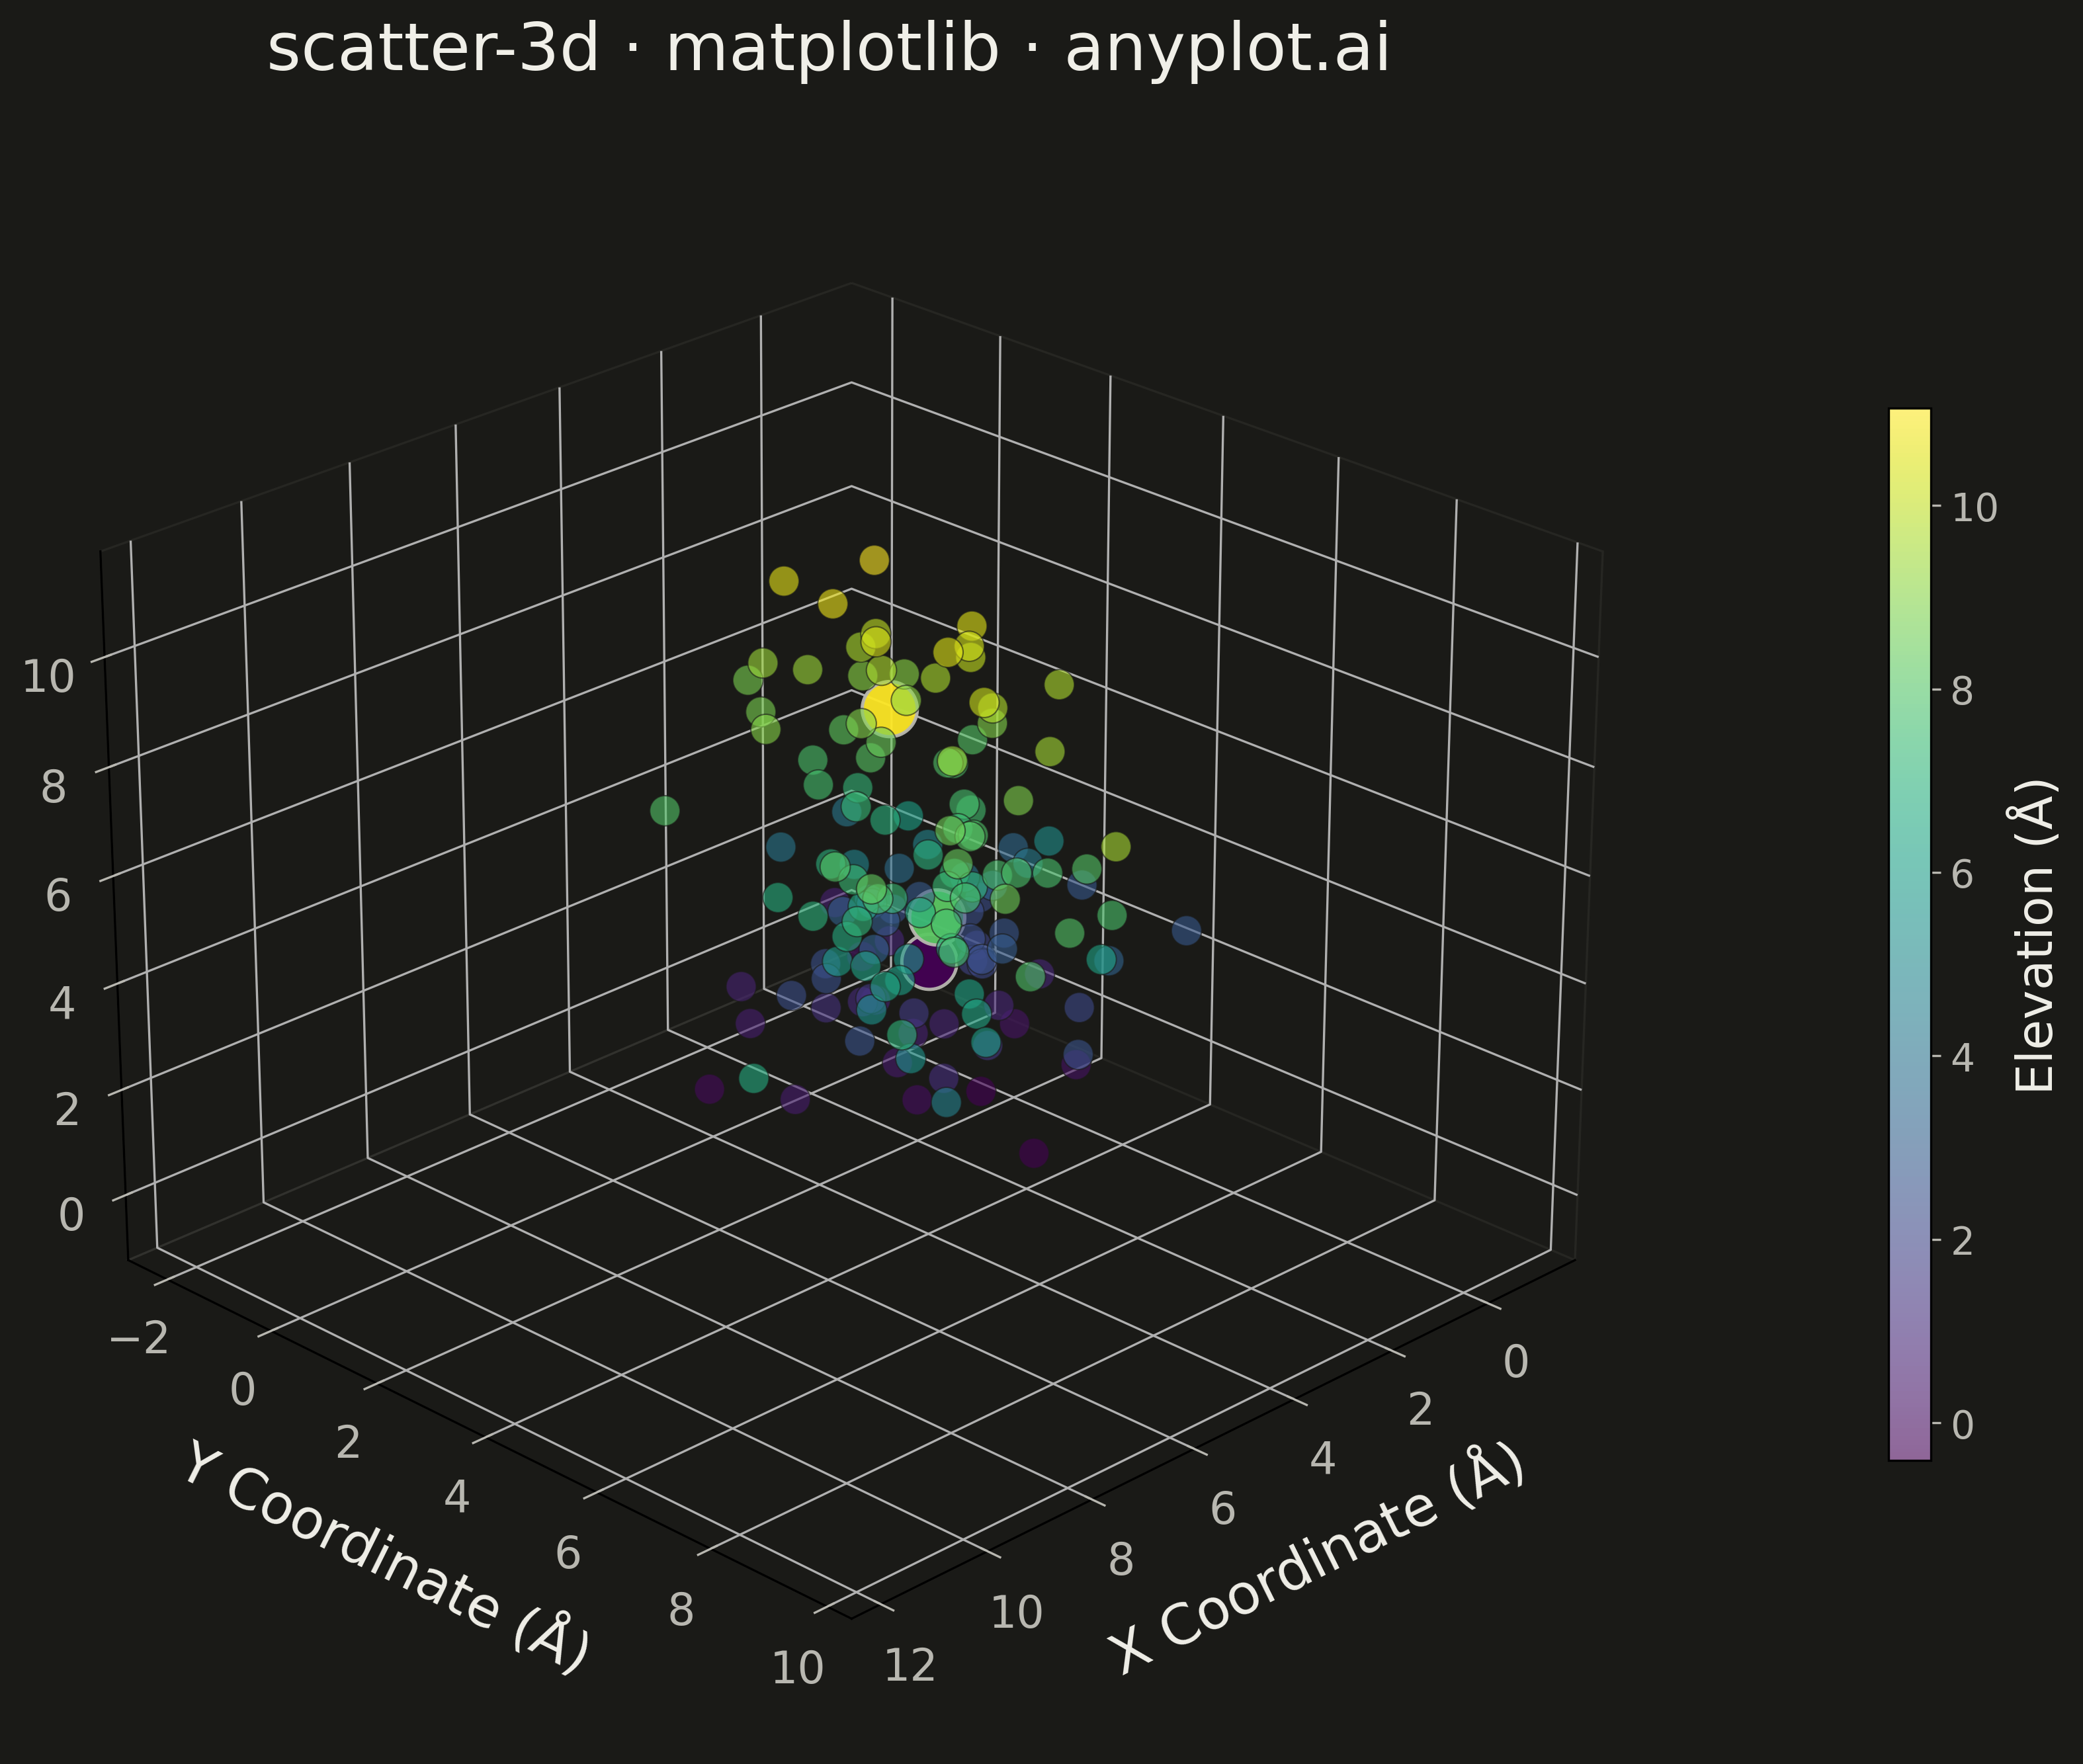
A three-dimensional scatter plot that displays the relationship between three numeric variables by plotting points in 3D space. This visualization extends the classic 2D scatter plot to reveal patterns, clusters, and correlations across three dimensions simultaneously, making it invaluable for multivariate data exploration.
""" anyplot.ai
scatter-3d: 3D Scatter Plot
Library: matplotlib 3.10.9 | Python 3.13.13
Quality: 89/100 | Updated: 2026-05-08
"""

import os

import matplotlib.pyplot as plt
import numpy as np


# Theme tokens
THEME = os.getenv("ANYPLOT_THEME", "light")
PAGE_BG = "#FAF8F1" if THEME == "light" else "#1A1A17"
INK = "#1A1A17" if THEME == "light" else "#F0EFE8"
INK_SOFT = "#4A4A44" if THEME == "light" else "#B8B7B0"

# Data - Simulate protein structure analysis with 3D atomic coordinates
# Representing different protein domains with distinct spatial clustering
np.random.seed(42)

# Domain 1: Alpha helix region (lower left)
n1 = 60
x1 = np.random.randn(n1) * 1.5 + 2
y1 = np.random.randn(n1) * 1.5 + 2
z1 = np.random.randn(n1) * 1.5 + 2

# Domain 2: Beta sheet region (upper right)
n2 = 50
x2 = np.random.randn(n2) * 1.2 + 7
y2 = np.random.randn(n2) * 1.2 + 7
z2 = np.random.randn(n2) * 1.2 + 7

# Domain 3: Loop region (middle-high)
n3 = 40
x3 = np.random.randn(n3) * 1.0 + 5
y3 = np.random.randn(n3) * 1.0 + 4
z3 = np.random.randn(n3) * 1.0 + 9

# Combine all domains
x = np.concatenate([x1, x2, x3])
y = np.concatenate([y1, y2, y3])
z = np.concatenate([z1, z2, z3])

# Color based on z-value (representing depth/elevation in Angstroms)
colors = z

# Create 3D plot
fig = plt.figure(figsize=(16, 9), facecolor=PAGE_BG)
ax = fig.add_subplot(111, projection="3d")
ax.set_facecolor(PAGE_BG)

# Scatter plot with color encoding
scatter = ax.scatter(x, y, z, c=colors, cmap="viridis", s=120, alpha=0.7, edgecolors=PAGE_BG, linewidth=0.5)

# Add colorbar with improved positioning
cbar = fig.colorbar(scatter, ax=ax, shrink=0.65, aspect=25, pad=0.08)
cbar.set_label("Elevation (Å)", fontsize=18, color=INK)
cbar.ax.tick_params(labelsize=14, colors=INK_SOFT, labelcolor=INK_SOFT)

# Labels with realistic scientific context (molecular coordinates in Angstroms)
ax.set_xlabel("X Coordinate (Å)", fontsize=20, labelpad=15, color=INK)
ax.set_ylabel("Y Coordinate (Å)", fontsize=20, labelpad=15, color=INK)
ax.set_zlabel("Z Coordinate (Å)", fontsize=20, labelpad=15, color=INK)
ax.set_title("scatter-3d · matplotlib · anyplot.ai", fontsize=24, pad=20, color=INK)

# Tick parameters
ax.tick_params(axis="x", labelsize=16, colors=INK_SOFT, labelcolor=INK_SOFT)
ax.tick_params(axis="y", labelsize=16, colors=INK_SOFT, labelcolor=INK_SOFT)
ax.tick_params(axis="z", labelsize=16, colors=INK_SOFT, labelcolor=INK_SOFT)

# Subtle grid lines for 3D space judgment
ax.grid(True, alpha=0.15, linewidth=0.8, color=INK_SOFT)

# Set viewing angle for better visualization
ax.view_init(elev=25, azim=45)

# Subtle pane styling
ax.xaxis.pane.fill = False
ax.yaxis.pane.fill = False
ax.zaxis.pane.fill = False
ax.xaxis.pane.set_edgecolor(INK_SOFT)
ax.yaxis.pane.set_edgecolor(INK_SOFT)
ax.zaxis.pane.set_edgecolor(INK_SOFT)
ax.xaxis.pane.set_alpha(0.15)
ax.yaxis.pane.set_alpha(0.15)
ax.zaxis.pane.set_alpha(0.15)

plt.tight_layout()
plt.savefig(f"plot-{THEME}.png", dpi=300, bbox_inches="tight", facecolor=PAGE_BG)
Runnable source as JSON, for any HTTP client: https://api.anyplot.ai/specs/scatter-3d/matplotlib/code. Any spec id and library id listed in llms-full.txt fit the same URL shape; every URL below is complete and callable.
{
  "spec_id": "scatter-3d",
  "language": "python",
  "library": "matplotlib",
  "page": "https://anyplot.ai/scatter-3d/python/matplotlib",
  "hub": "https://anyplot.ai/scatter-3d",
  "code_json": "https://api.anyplot.ai/specs/scatter-3d/matplotlib/code",
  "spec_json": "https://api.anyplot.ai/specs/scatter-3d",
  "render_light_png": "https://storage.googleapis.com/anyplot-images/plots/scatter-3d/python/matplotlib/plot-light.png",
  "render_dark_png": "https://storage.googleapis.com/anyplot-images/plots/scatter-3d/python/matplotlib/plot-dark.png",
  "quality_score": 89.0,
  "license": "MIT",
  "guide": "https://anyplot.ai/llms.txt"
}
Part of 3D Scatter Plot on anyplot.ai.