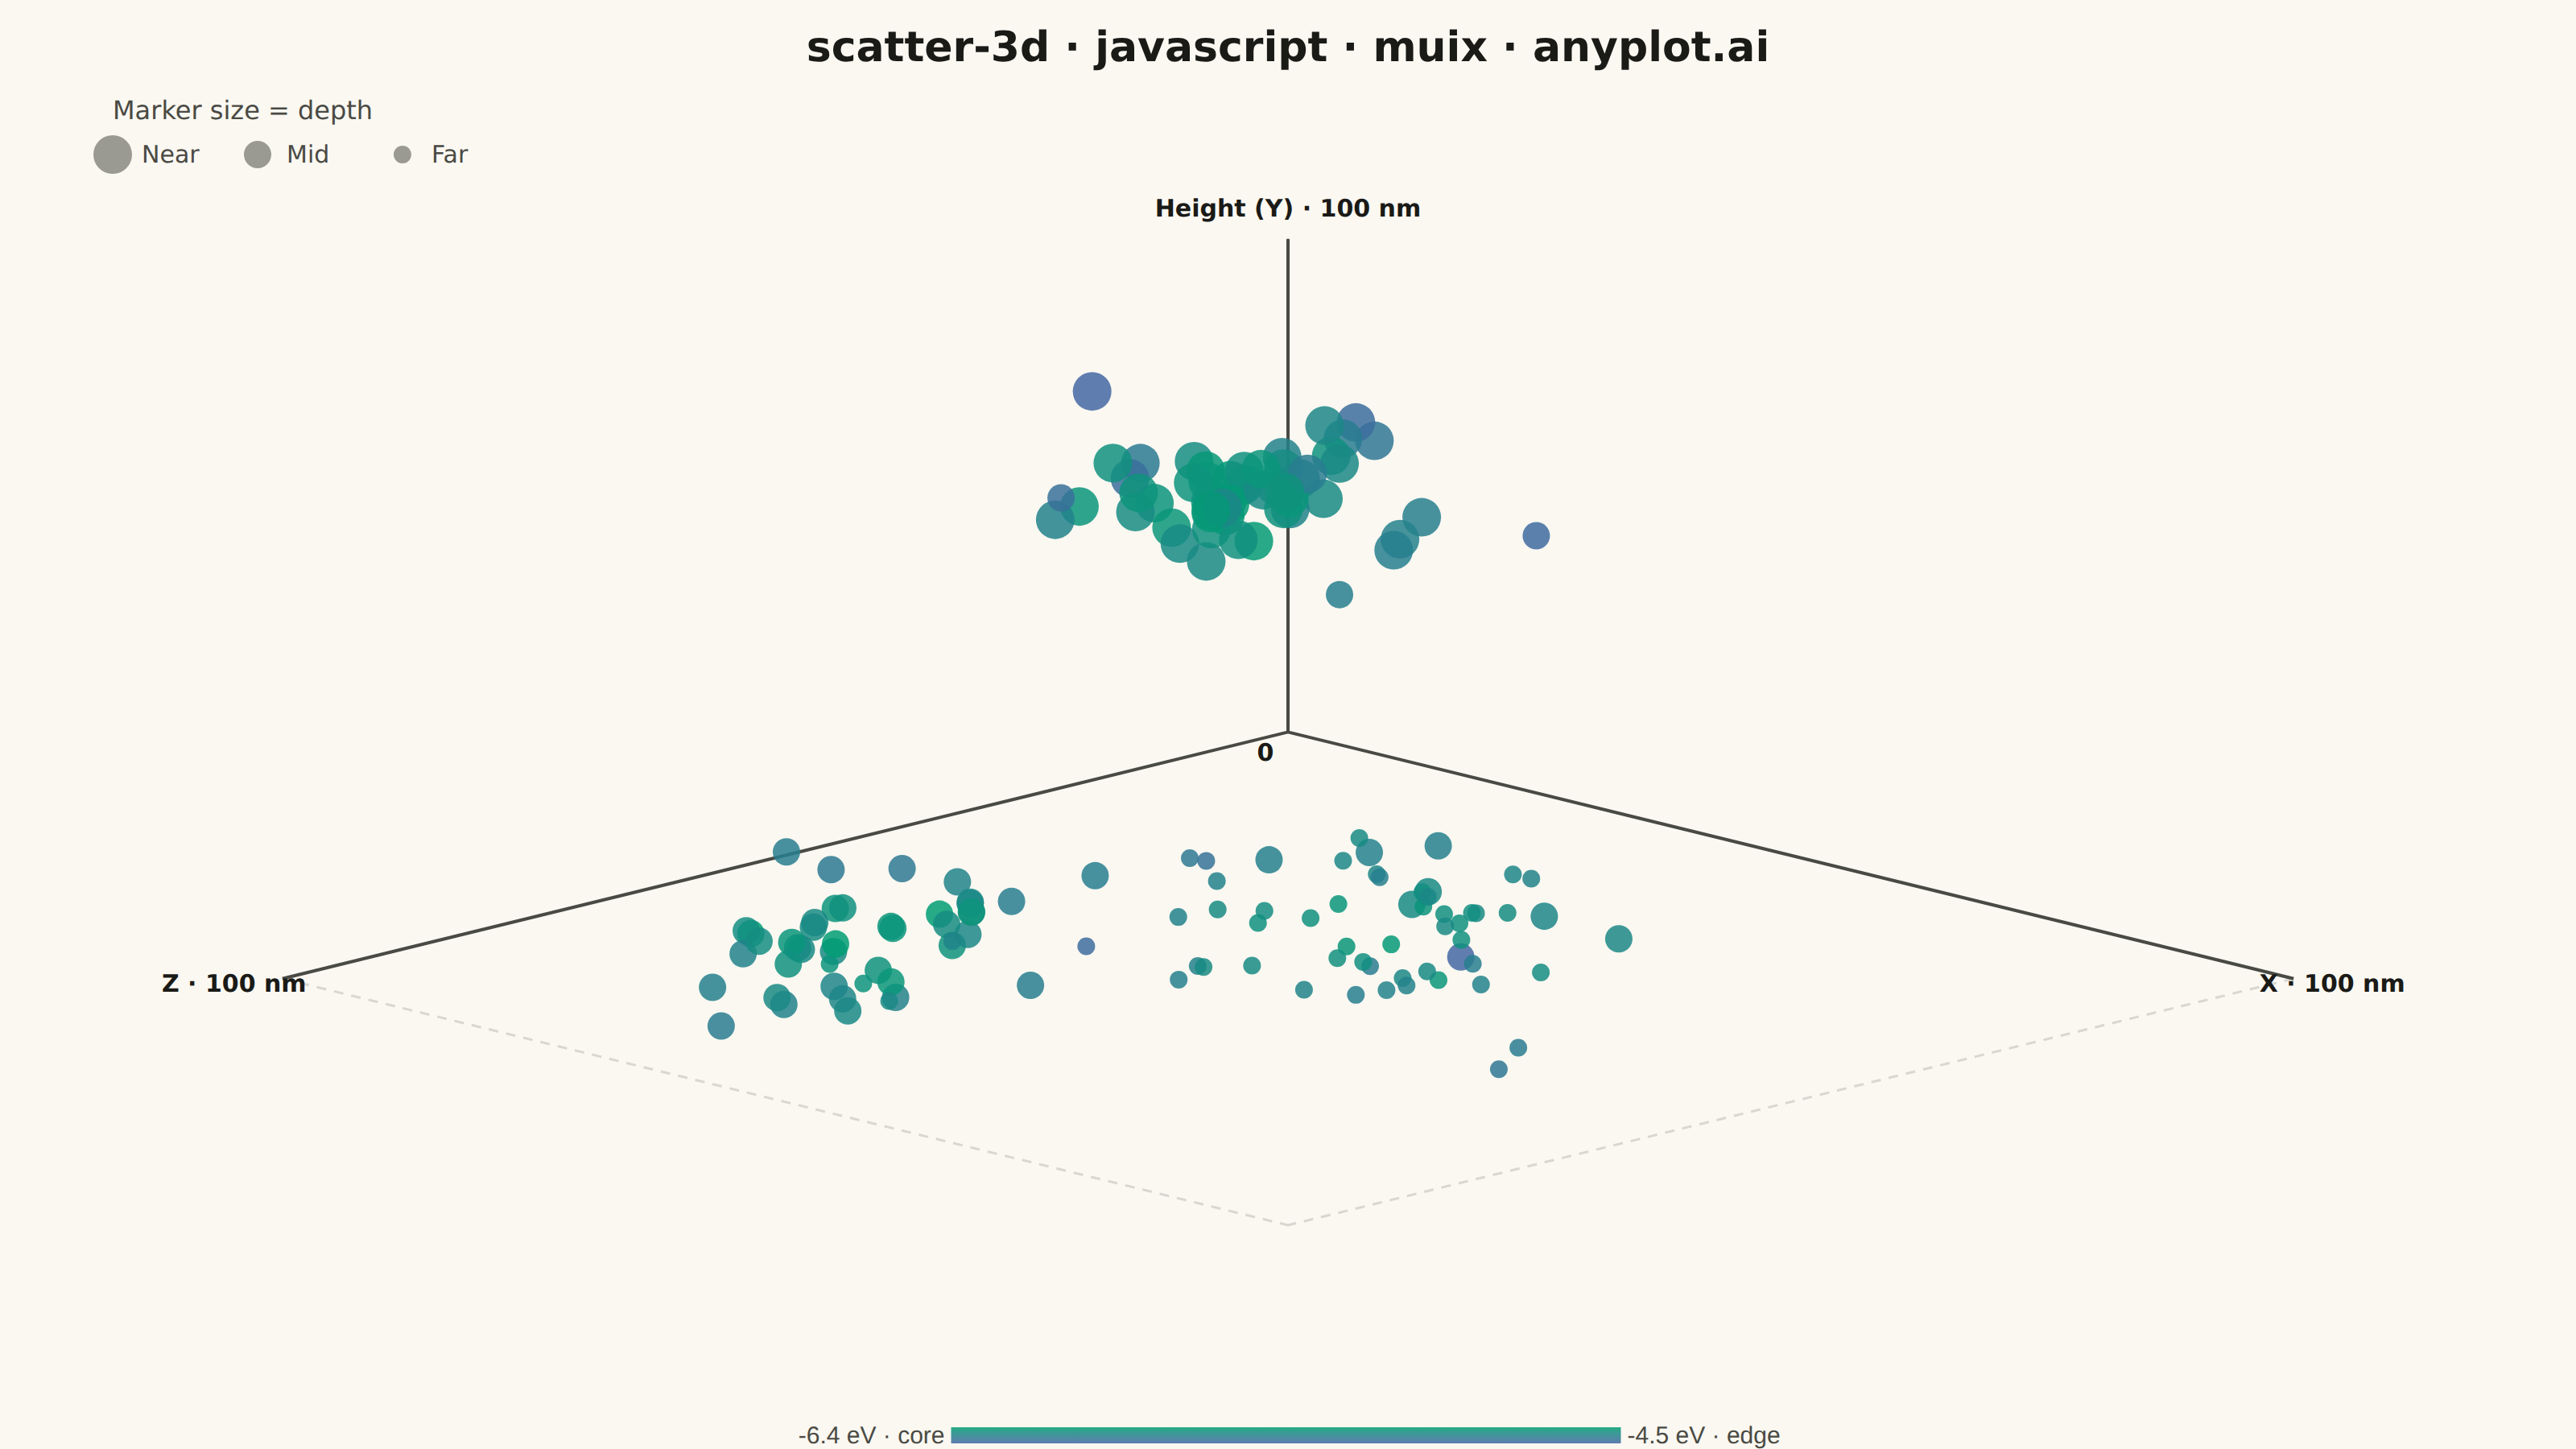
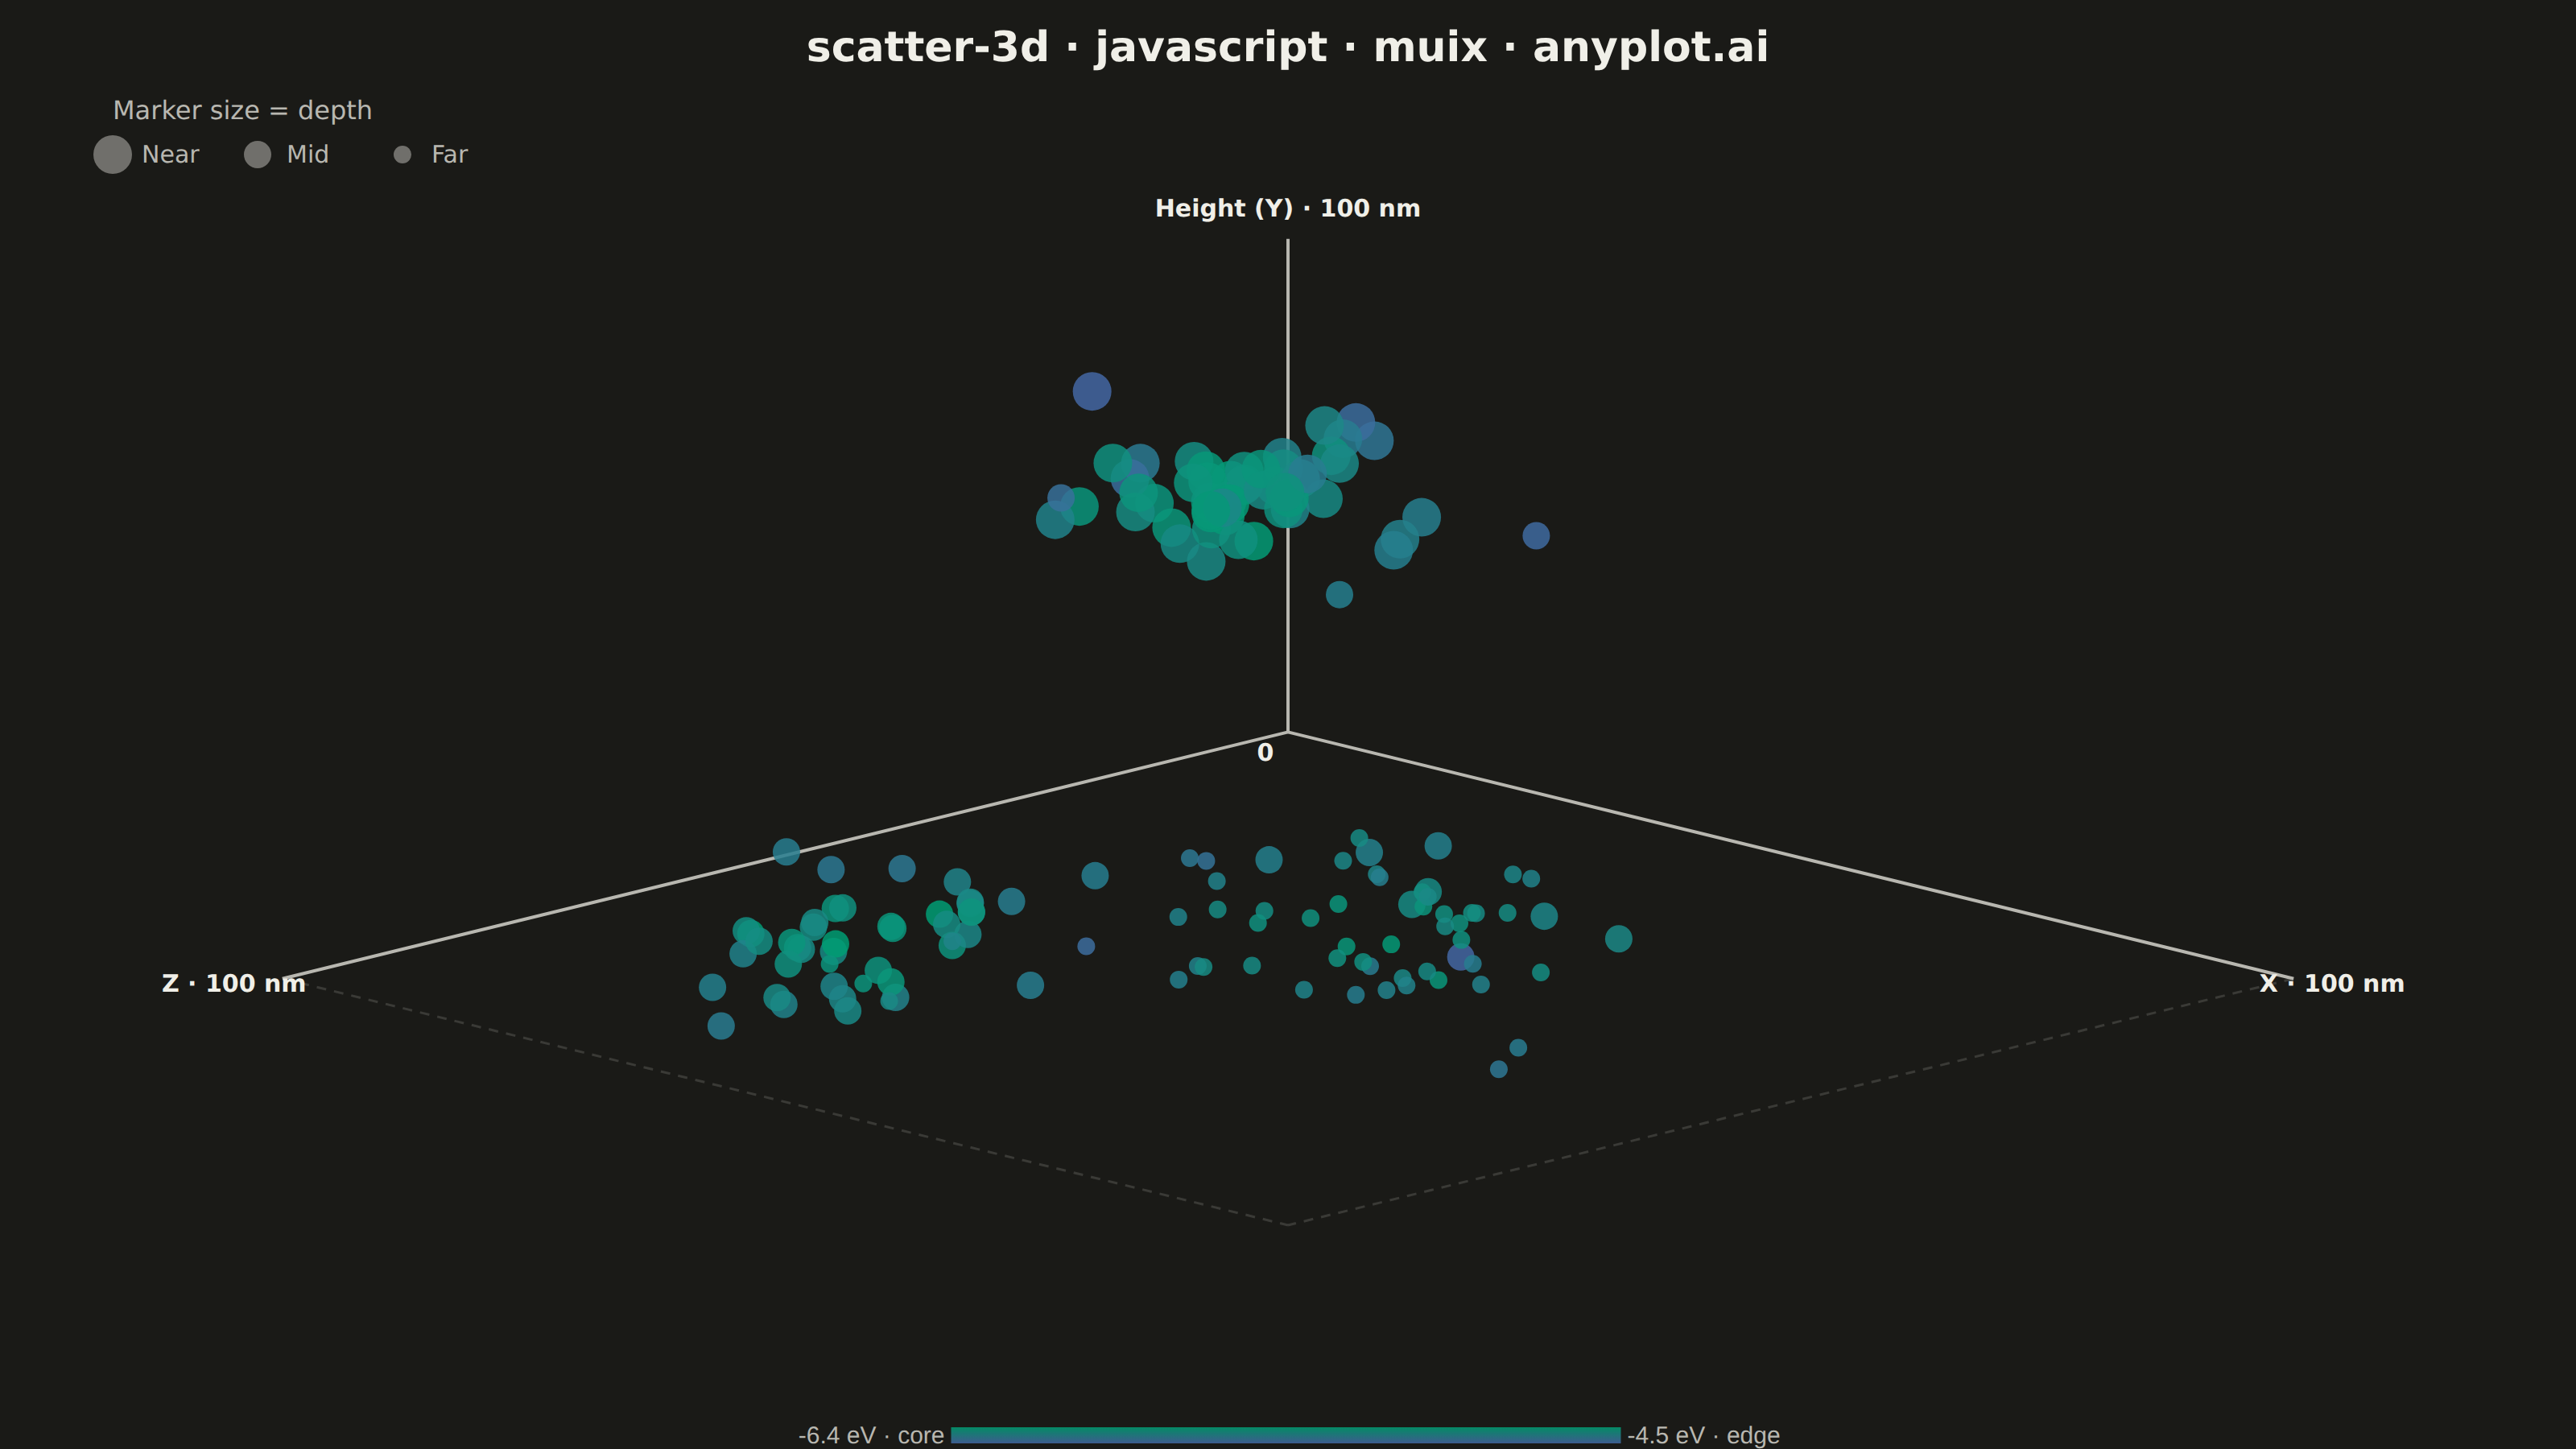
The same plot in 13 other libraries — JavaScript: Chart.js, D3.js, Apache ECharts, Highcharts; Python: Altair, Bokeh, lets-plot, Matplotlib, Plotly, Pygal, Seaborn; R: ggplot2; Julia: Makie.jl. Compare all 14 side by side: 3D Scatter Plot in Python, R, Julia and JavaScript.
A three-dimensional scatter plot that displays the relationship between three numeric variables by plotting points in 3D space. This visualization extends the classic 2D scatter plot to reveal patterns, clusters, and correlations across three dimensions simultaneously, making it invaluable for multivariate data exploration.
// anyplot.ai
// scatter-3d: 3D Scatter Plot
// Library: muix 7.29.1 | JavaScript 22.23.2
// Quality: 93/100 | Created: 2026-09-10
//# anyplot-orientation: landscape
import { ChartContainer } from "@mui/x-charts/ChartContainer";
import { ScatterPlot } from "@mui/x-charts/ScatterChart";
import { ChartsTooltip } from "@mui/x-charts/ChartsTooltip";
import { ContinuousColorLegend } from "@mui/x-charts/ChartsLegend";
import { useXScale, useYScale } from "@mui/x-charts/hooks";

const t = window.ANYPLOT_TOKENS;
const size = window.ANYPLOT_SIZE;

// --- Deterministic PRNG (LCG + Box-Muller, no seeded RNG in the browser) ----
function createLcg(seed) {
  let state = seed;
  return function nextUniform() {
    state = (state * 16807) % 2147483647;
    return (state - 1) / 2147483646;
  };
}
const nextUniform = createLcg(7);
function nextGaussian() {
  const u1 = Math.max(nextUniform(), 1e-9);
  const u2 = nextUniform();
  return Math.sqrt(-2 * Math.log(u1)) * Math.cos(2 * Math.PI * u2);
}

// --- Data: simulated nanocluster fragments from a molecular-dynamics run ----
// Three atom groups (fragments) placed in a 100x100x100 nm cell; each atom's
// local potential energy (eV) rises with distance from its fragment's core —
// the classic "stable core, strained periphery" pattern used to demo a
// genuine 4th-variable color encoding on top of real x/y/z spatial position.
const AXIS_MIN = 0;
const AXIS_MAX = 100;
const FRAGMENTS = [
  { center: [22, 74, 30], sigma: 7, count: 55 },
  { center: [78, 32, 68], sigma: 8, count: 55 },
  { center: [42, 20, 84], sigma: 6, count: 45 },
];

const atoms = [];
FRAGMENTS.forEach((fragment, fragmentIndex) => {
  for (let i = 0; i < fragment.count; i += 1) {
    const x = fragment.center[0] + nextGaussian() * fragment.sigma;
    const y = fragment.center[1] + nextGaussian() * fragment.sigma;
    const z = fragment.center[2] + nextGaussian() * fragment.sigma;
    const distanceFromCore = Math.sqrt(
      (x - fragment.center[0]) ** 2 +
        (y - fragment.center[1]) ** 2 +
        (z - fragment.center[2]) ** 2
    );
    const energy = -6.4 + 0.062 * distanceFromCore + nextGaussian() * 0.22; // eV
    atoms.push({
      id: `atom-${fragmentIndex}-${i}`,
      x: Math.min(Math.max(x, AXIS_MIN + 1), AXIS_MAX - 1),
      y: Math.min(Math.max(y, AXIS_MIN + 1), AXIS_MAX - 1),
      z: Math.min(Math.max(z, AXIS_MIN + 1), AXIS_MAX - 1),
      energy,
    });
  }
});

// --- Isometric projection: (x, y, z) -> 2D (px, py) data-space coordinates -
// x/z form the ground plane (down-right / down-left), y is height (straight
// up). Fed as ordinary numeric x/y into a linear-scale scatter, so the chart
// does the pixel conversion; the sign choices below make the axes read as a
// conventional isometric cube once the y-axis' usual "up = larger" inversion
// is applied.
const ISO_ANGLE = Math.PI / 6; // 30 degrees
function project(x, y, z) {
  return {
    px: (x - z) * Math.cos(ISO_ANGLE),
    py: y - (x + z) * Math.sin(ISO_ANGLE),
  };
}

atoms.forEach((atom) => {
  const projected = project(atom.x, atom.y, atom.z);
  atom.px = projected.px;
  atom.py = projected.py;
});

// --- Depth cue: points nearer the (x=0, z=0) front edge render larger -------
const groundDepths = atoms.map((atom) => atom.x + atom.z).sort((a, b) => a - b);
const tierBoundary1 = groundDepths[Math.floor(groundDepths.length / 3)];
const tierBoundary2 = groundDepths[Math.floor((2 * groundDepths.length) / 3)];
function depthTier(atom) {
  const depth = atom.x + atom.z;
  if (depth <= tierBoundary1) return "near";
  if (depth <= tierBoundary2) return "mid";
  return "far";
}
const MARKER_SIZE_BY_TIER = { near: 12, mid: 8.5, far: 5.5 };

// --- Domain bounds: project the cell's 8 corners so every axis line and all
// data stay comfortably inside the computed x/y scale, then pad for labels --
const cellCorners = [];
[AXIS_MIN, AXIS_MAX].forEach((cx) =>
  [AXIS_MIN, AXIS_MAX].forEach((cy) =>
    [AXIS_MIN, AXIS_MAX].forEach((cz) => cellCorners.push(project(cx, cy, cz)))
  )
);
const PAD = 16;
const pxMin = Math.min(...cellCorners.map((c) => c.px)) - PAD;
const pxMax = Math.max(...cellCorners.map((c) => c.px)) + PAD;
const pyMin = Math.min(...cellCorners.map((c) => c.py)) - PAD;
const pyMax = Math.max(...cellCorners.map((c) => c.py)) + PAD * 1.6;

// --- Color axis: continuous Imprint sequential scale over the energy field -
// The scatter series has no direct opacity prop, so a slight fill-opacity is
// baked into the colorMap stops themselves to reduce occlusion where the
// dense upper fragment cluster overlaps.
const withAlpha = (hex, alpha) => {
  const n = parseInt(hex.slice(1), 16);
  const r = (n >> 16) & 255;
  const g = (n >> 8) & 255;
  const b = n & 255;
  return `rgba(${r}, ${g}, ${b}, ${alpha})`;
};
const MARKER_ALPHA = 0.85;

const energyValues = atoms.map((atom) => atom.energy);
const energyMin = Math.min(...energyValues);
const energyMax = Math.max(...energyValues);

const zAxis = [
  {
    id: "energyColor",
    colorMap: {
      type: "continuous",
      min: energyMin,
      max: energyMax,
      color: [withAlpha(t.seq[0], MARKER_ALPHA), withAlpha(t.seq[1], MARKER_ALPHA)],
    },
  },
];

// --- One scatter series per depth tier (all sharing the same color axis) so
// per-point markerSize can vary while color stays driven by energy alone ----
const series = ["near", "mid", "far"].map((tier) => ({
  type: "scatter",
  id: `atoms-${tier}`,
  zAxisId: "energyColor",
  markerSize: MARKER_SIZE_BY_TIER[tier],
  data: atoms
    .filter((atom) => depthTier(atom) === tier)
    .map((atom) => ({
      x: atom.px,
      y: atom.py,
      z: atom.energy,
      id: atom.id,
      realX: atom.x,
      realY: atom.y,
      realZ: atom.z,
      energy: atom.energy,
    })),
  valueFormatter: (value) =>
    `x=${value.realX.toFixed(1)} nm, y=${value.realY.toFixed(1)} nm, z=${value.realZ.toFixed(1)} nm · E=${value.energy.toFixed(2)} eV`,
}));

// --- Wireframe cell + axis labels + depth mini-legend, drawn in data space
// via the chart's own scale hooks (same pattern as biplot-pca's LoadingArrows)
const originPoint = project(AXIS_MIN, AXIS_MIN, AXIS_MIN);
const xEndPoint = project(AXIS_MAX, AXIS_MIN, AXIS_MIN);
const yEndPoint = project(AXIS_MIN, AXIS_MAX, AXIS_MIN);
const zEndPoint = project(AXIS_MIN, AXIS_MIN, AXIS_MAX);
const farFloorCorner = project(AXIS_MAX, AXIS_MIN, AXIS_MAX);

function Iso3DFrame() {
  const xScale = useXScale();
  const yScale = useYScale();
  const toPixels = (p) => ({ x: xScale(p.px), y: yScale(p.py) });

  const origin = toPixels(originPoint);
  const xEnd = toPixels(xEndPoint);
  const yEnd = toPixels(yEndPoint);
  const zEnd = toPixels(zEndPoint);
  const farFloor = toPixels(farFloorCorner);

  const axisLine = (from, to) => (
    <line
      x1={from.x}
      y1={from.y}
      x2={to.x}
      y2={to.y}
      stroke={t.inkSoft}
      strokeWidth={2}
    />
  );
  const floorEdge = (from, to) => (
    <line
      x1={from.x}
      y1={from.y}
      x2={to.x}
      y2={to.y}
      stroke={t.grid}
      strokeWidth={1.5}
      strokeDasharray="6 5"
    />
  );
  const axisLabel = (point, text, dx, dy) => (
    <text
      x={point.x + dx}
      y={point.y + dy}
      fill={t.ink}
      fontSize={15}
      fontWeight={600}
      fontFamily="system-ui, sans-serif"
      textAnchor="middle"
    >
      {text}
    </text>
  );

  const depthLegendX = 70;
  const depthLegendY = 96;
  const depthLegendItems = [
    { tier: "Near", r: MARKER_SIZE_BY_TIER.near },
    { tier: "Mid", r: MARKER_SIZE_BY_TIER.mid },
    { tier: "Far", r: MARKER_SIZE_BY_TIER.far },
  ];

  return (
    <g>
      {floorEdge(xEnd, farFloor)}
      {floorEdge(zEnd, farFloor)}
      {axisLine(origin, xEnd)}
      {axisLine(origin, yEnd)}
      {axisLine(origin, zEnd)}
      {axisLabel(origin, "0", -14, 18)}
      {axisLabel(xEnd, `X · ${AXIS_MAX} nm`, 24, 8)}
      {axisLabel(yEnd, `Height (Y) · ${AXIS_MAX} nm`, 0, -14)}
      {axisLabel(zEnd, `Z · ${AXIS_MAX} nm`, -30, 8)}

      <text
        x={depthLegendX}
        y={depthLegendY - 22}
        fill={t.inkSoft}
        fontSize={16}
        fontFamily="system-ui, sans-serif"
      >
        Marker size = depth
      </text>
      {depthLegendItems.map((item, i) => (
        <g key={item.tier} transform={`translate(${depthLegendX + i * 90}, ${depthLegendY})`}>
          <circle cx={0} cy={0} r={item.r} fill={t.inkSoft} opacity={0.55} />
          <text
            x={18}
            y={5}
            fill={t.inkSoft}
            fontSize={15}
            fontFamily="system-ui, sans-serif"
          >
            {item.tier}
          </text>
        </g>
      ))}
    </g>
  );
}

const chartTitle = "scatter-3d · javascript · muix · anyplot.ai";

// --- Chart (default-exported component — the harness mounts it) ------------
export default function Chart() {
  return (
    <ChartContainer
      width={size.width}
      height={size.height}
      series={series}
      zAxis={zAxis}
      xAxis={[{ id: "iso-x", scaleType: "linear", min: pxMin, max: pxMax }]}
      yAxis={[{ id: "iso-y", scaleType: "linear", min: pyMin, max: pyMax }]}
      margin={{ top: 70, right: 60, bottom: 90, left: 60 }}
      disableVoronoi
      skipAnimation
    >
      <text
        x={size.width / 2}
        y={38}
        textAnchor="middle"
        fontSize={26}
        fontWeight={600}
        fill={t.ink}
        fontFamily="system-ui, sans-serif"
      >
        {chartTitle}
      </text>
      <Iso3DFrame />
      <ScatterPlot />
      <ContinuousColorLegend
        axisDirection="z"
        axisId="energyColor"
        position={{ horizontal: "middle", vertical: "bottom" }}
        length="26%"
        thickness={10}
        minLabel={() => `${energyMin.toFixed(1)} eV · core`}
        maxLabel={() => `${energyMax.toFixed(1)} eV · edge`}
        labelStyle={{ fontSize: 15, fill: t.inkSoft }}
      />
      <ChartsTooltip trigger="item" />
    </ChartContainer>
  );
}
Runnable source as JSON, for any HTTP client: https://api.anyplot.ai/specs/scatter-3d/muix/code. Any spec id and library id listed in llms-full.txt fit the same URL shape; every URL below is complete and callable.
{
  "spec_id": "scatter-3d",
  "language": "javascript",
  "library": "muix",
  "page": "https://anyplot.ai/scatter-3d/javascript/muix",
  "hub": "https://anyplot.ai/scatter-3d",
  "code_json": "https://api.anyplot.ai/specs/scatter-3d/muix/code",
  "spec_json": "https://api.anyplot.ai/specs/scatter-3d",
  "render_light_png": "https://storage.googleapis.com/anyplot-images/plots/scatter-3d/javascript/muix/plot-light.png",
  "render_dark_png": "https://storage.googleapis.com/anyplot-images/plots/scatter-3d/javascript/muix/plot-dark.png",
  "interactive_light_html": "https://storage.googleapis.com/anyplot-images/plots/scatter-3d/javascript/muix/plot-light.html",
  "interactive_dark_html": "https://storage.googleapis.com/anyplot-images/plots/scatter-3d/javascript/muix/plot-dark.html",
  "quality_score": 93.0,
  "license": "MIT",
  "guide": "https://anyplot.ai/llms.txt"
}
Part of 3D Scatter Plot on anyplot.ai.