The same plot in 14 other libraries — JavaScript: D3.js, Apache ECharts, Highcharts, MUI X Charts; Python: Altair, Bokeh, lets-plot, Matplotlib, Plotly, plotnine, Pygal, Seaborn; R: ggplot2; Julia: Makie.jl. Compare all 15 side by side: Annotated Scatter Plot with Text Labels in Python, R, Julia and JavaScript.
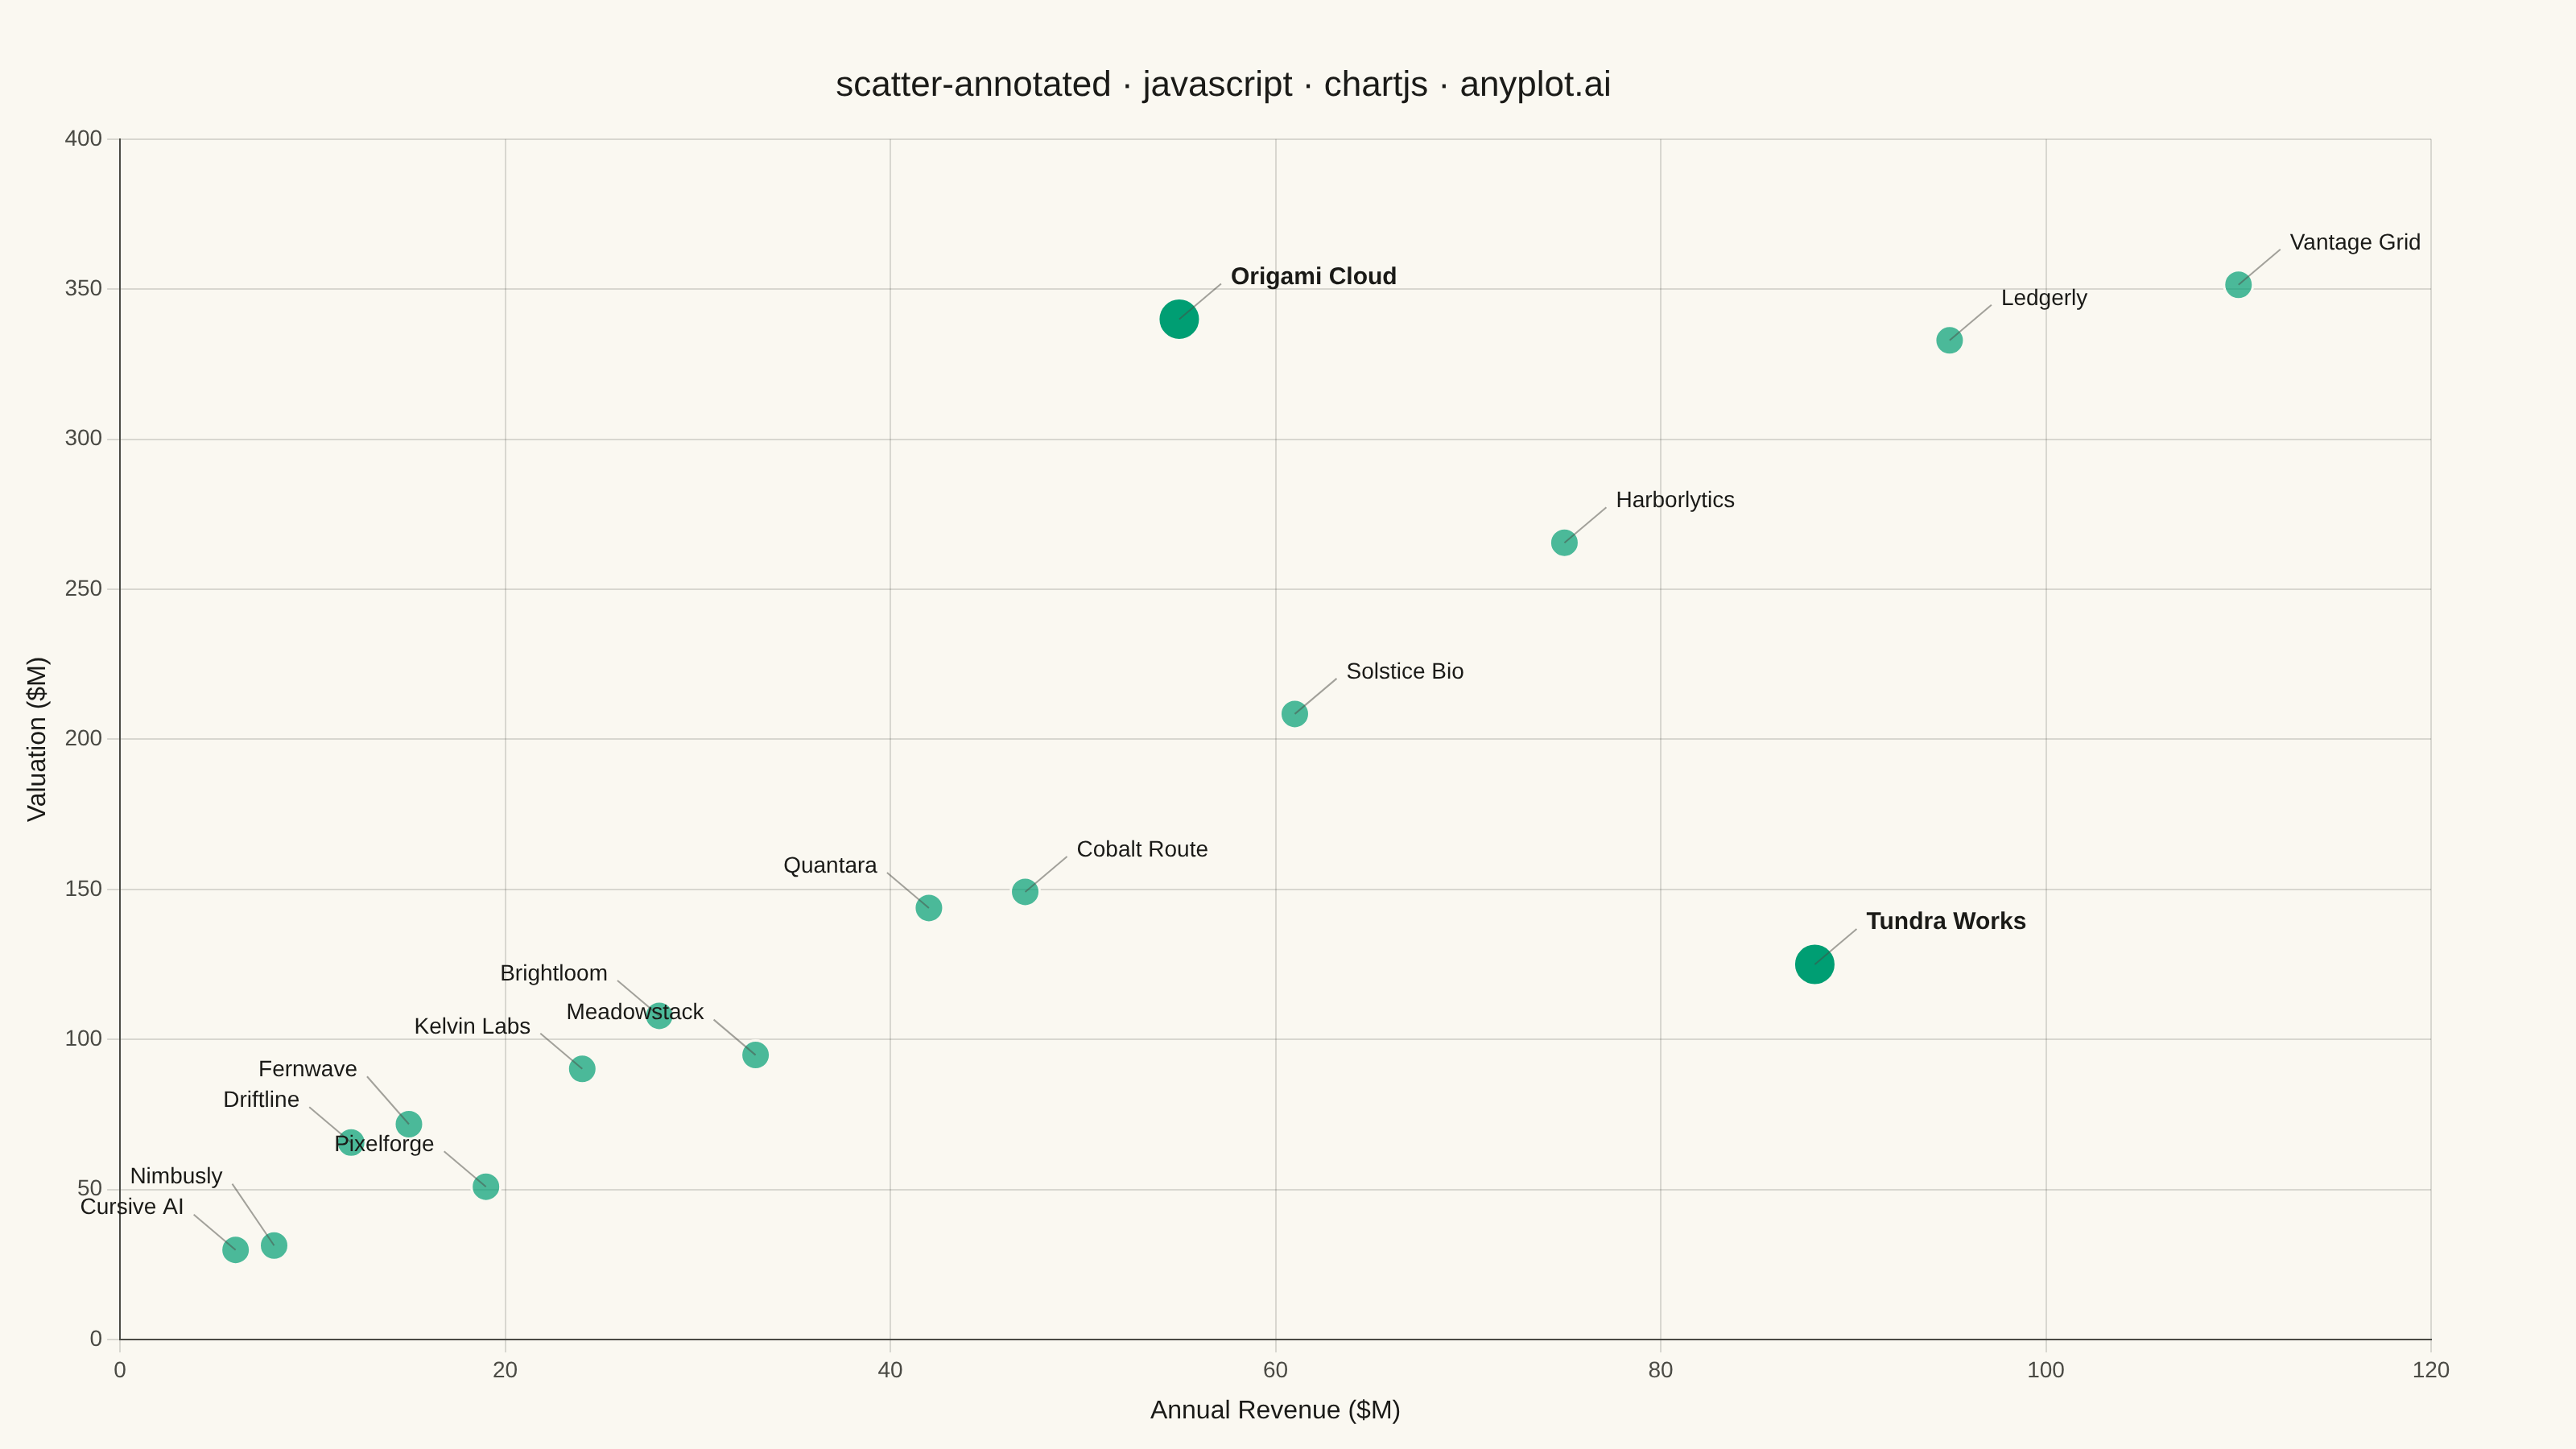
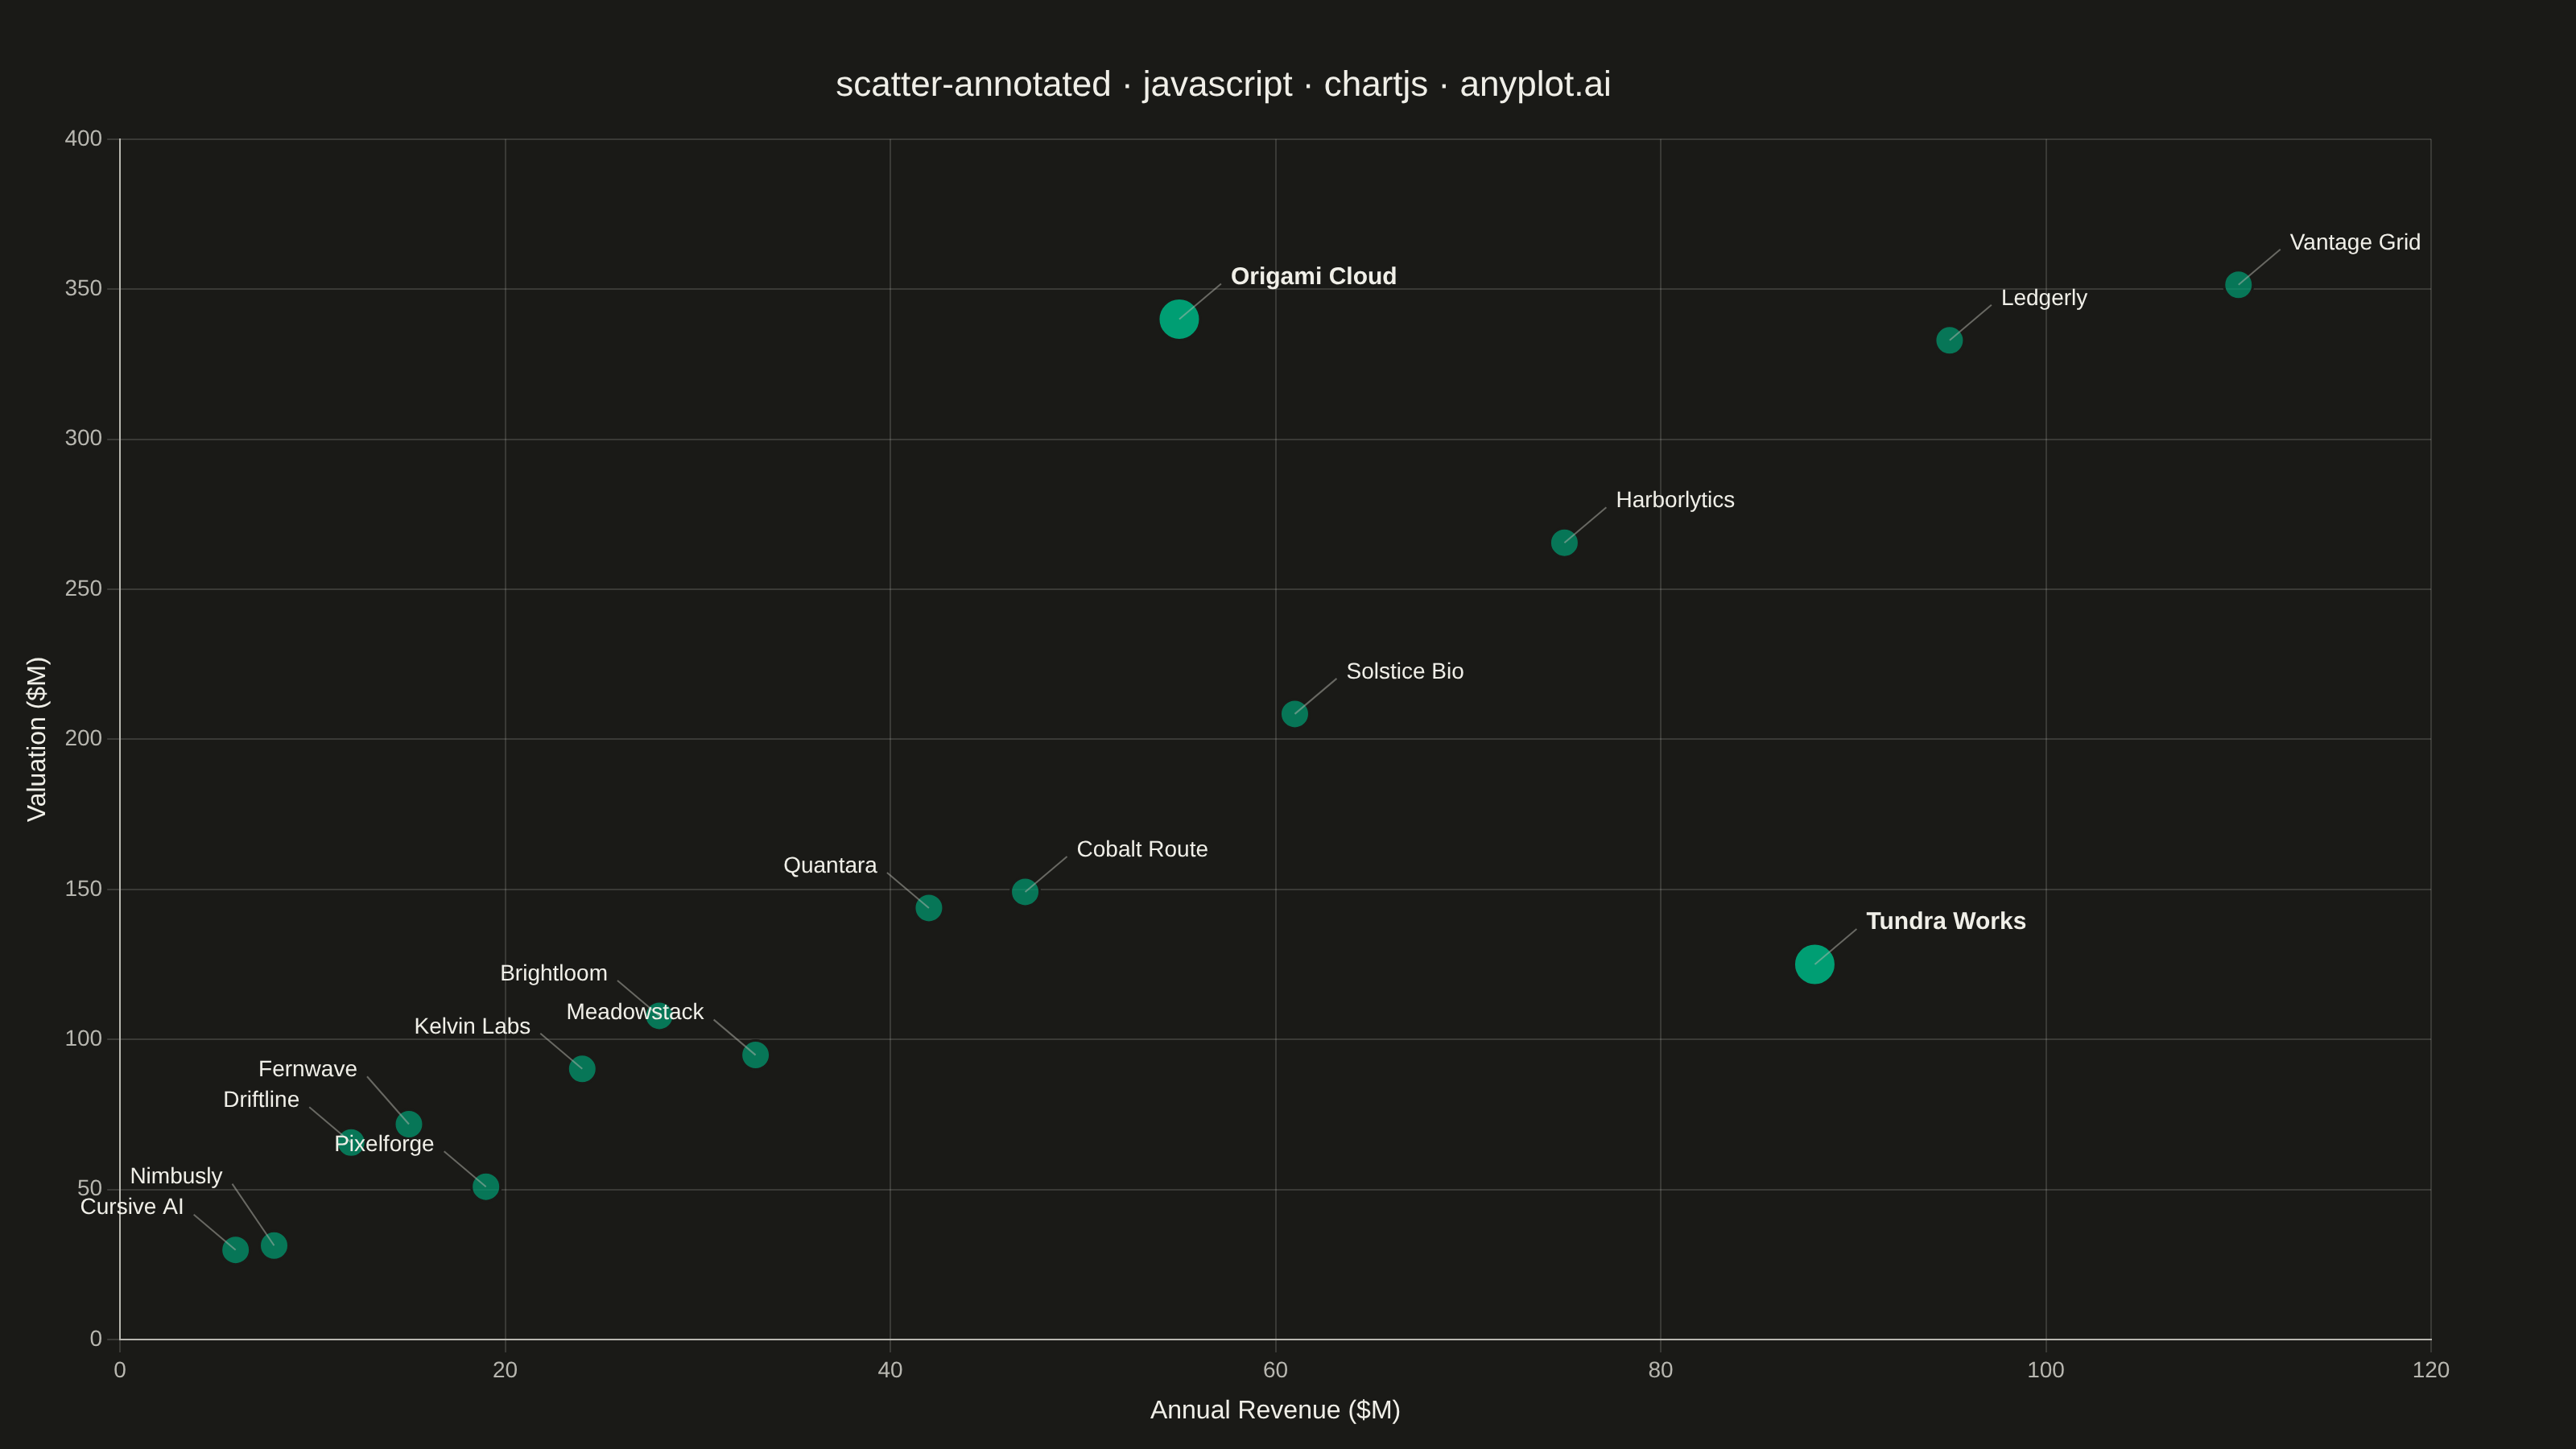
A scatter plot where each data point can have a text label annotation, useful for identifying specific points of interest. This visualization enhances basic scatter plots by adding contextual information directly on the chart, making it easy to highlight outliers, named entities, or key data points that deserve special attention.
// anyplot.ai
// scatter-annotated: Annotated Scatter Plot with Text Labels
// Library: chartjs 4.4.7 | JavaScript 22.23.2
// Quality: 88/100 | Created: 2026-09-05

const t = window.ANYPLOT_TOKENS;

// --- Data (in-memory, deterministic) ----------------------------------------
// Fictional startups: annual revenue vs. valuation, both in $ millions.
// A tiny fixed-seed LCG stands in for `Math.random()` (not reproducible in the
// browser) so re-running the snippet always draws the same jitter.
let seed = 42;
function lcg() {
  seed = (seed * 1103515245 + 12345) % 2147483648;
  return seed / 2147483648;
}

const companies = [
  "Nimbusly", "Quantara", "Fernwave", "Ledgerly", "Brightloom",
  "Cursive AI", "Solstice Bio", "Meadowstack", "Vantage Grid", "Pixelforge",
  "Cobalt Route", "Driftline", "Harborlytics", "Kelvin Labs", "Origami Cloud",
  "Tundra Works",
];
const revenue = [
  8, 42, 15, 95, 28, 6, 61, 33, 110, 19, 47, 12, 75, 24, 55, 88,
];
// Two indices are hand-placed genuine outliers rather than trend + noise:
// Origami Cloud (index 14) commands a valuation multiple far above its
// revenue-implied trend, while Tundra Works (index 15) — despite leading
// revenue among its peers — trades at a steep discount. Both stand out
// visibly from the otherwise near-linear cloud, earning their labels.
const OUTLIER_VALUATIONS = { 14: 340, 15: 125 };
const valuation = revenue.map((r, i) => {
  if (i in OUTLIER_VALUATIONS) return OUTLIER_VALUATIONS[i];
  const noise = (lcg() - 0.5) * 50;
  return Math.max(5, r * 3.4 + noise);
});
const points = companies.map((name, i) => ({
  x: revenue[i],
  y: valuation[i],
  label: name,
  outlier: i in OUTLIER_VALUATIONS,
}));

// --- Mount -------------------------------------------------------------------
const canvas = document.createElement("canvas");
document.getElementById("container").appendChild(canvas);

// --- Label placement ----------------------------------------------------------
// Fan each label outward from the point cloud's pixel centroid, then run a
// greedy de-collision pass: labels are placed in x-order, and any label whose
// box would overlap an already-placed one is nudged upward until it clears.
const LEADER_PX = 26;

const pointLabelsPlugin = {
  id: "pointLabels",
  afterDatasetsDraw(chart) {
    const { ctx } = chart;
    const meta = chart.getDatasetMeta(0);
    ctx.save();
    ctx.textBaseline = "middle";

    const centroidPx = meta.data.reduce(
      (acc, p) => ({ x: acc.x + p.x / meta.data.length, y: acc.y + p.y / meta.data.length }),
      { x: 0, y: 0 },
    );

    const LABEL_HEIGHT = 19;
    const placements = meta.data.map((point, i) => {
      const dx = point.x - centroidPx.x;
      const dirX = dx >= 0 ? 1 : -1;
      const align = dirX >= 0 ? "left" : "right";
      const label = points[i].label;
      const outlier = points[i].outlier;
      const font = outlier ? "700 15px sans-serif" : "500 14px sans-serif";
      ctx.font = font;
      return {
        point,
        label,
        align,
        outlier,
        font,
        width: ctx.measureText(label).width,
        x: point.x + dirX * LEADER_PX,
        y: point.y - LEADER_PX,
      };
    });

    placements.sort((a, b) => a.point.x - b.point.x);
    for (let i = 1; i < placements.length; i++) {
      const a = placements[i];
      const ax0 = a.align === "left" ? a.x : a.x - a.width;
      const ax1 = ax0 + a.width;
      for (let j = 0; j < i; j++) {
        const b = placements[j];
        const bx0 = b.align === "left" ? b.x : b.x - b.width;
        const bx1 = bx0 + b.width;
        const overlapX = ax0 < bx1 && ax1 > bx0;
        const overlapY = Math.abs(a.y - b.y) < LABEL_HEIGHT;
        if (overlapX && overlapY) a.y = b.y - LABEL_HEIGHT;
      }
    }

    placements.forEach((p) => {
      // Thin leader line from the marker edge to the label anchor.
      ctx.strokeStyle = t.inkSoft;
      ctx.globalAlpha = 0.5;
      ctx.lineWidth = 1;
      ctx.beginPath();
      ctx.moveTo(p.point.x, p.point.y);
      ctx.lineTo(p.x, p.y + 4);
      ctx.stroke();

      ctx.globalAlpha = 1;
      ctx.fillStyle = t.ink;
      ctx.font = p.font;
      ctx.textAlign = p.align;
      ctx.fillText(p.label, p.x + (p.align === "left" ? 6 : -6), p.y);
    });
    ctx.restore();
  },
};

// --- Chart ---------------------------------------------------------------------
new Chart(canvas, {
  type: "scatter",
  data: {
    datasets: [
      {
        label: "Startups",
        data: points,
        // Outliers render at full opacity and a larger radius so they stand
        // out from the ~70%-alpha trend cloud they deviate from.
        backgroundColor: points.map((p) => (p.outlier ? t.palette[0] : `${t.palette[0]}B3`)),
        borderColor: t.pageBg,
        borderWidth: 1.5,
        pointRadius: points.map((p) => (p.outlier ? 13 : 9)),
        pointHoverRadius: points.map((p) => (p.outlier ? 13 : 9)),
      },
    ],
  },
  options: {
    responsive: true,
    maintainAspectRatio: false,
    animation: false,
    layout: { padding: { top: 40, right: 90, bottom: 10, left: 10 } },
    plugins: {
      title: {
        display: true,
        text: "scatter-annotated · javascript · chartjs · anyplot.ai",
        color: t.ink,
        font: { size: 22, weight: "500" },
        padding: { bottom: 20 },
      },
      legend: { display: false },
      tooltip: { enabled: false },
    },
    scales: {
      x: {
        type: "linear",
        title: { display: true, text: "Annual Revenue ($M)", color: t.ink, font: { size: 16 } },
        ticks: { color: t.inkSoft, font: { size: 14 } },
        grid: { color: t.grid },
        border: { color: t.inkSoft },
      },
      y: {
        type: "linear",
        title: { display: true, text: "Valuation ($M)", color: t.ink, font: { size: 16 } },
        ticks: { color: t.inkSoft, font: { size: 14 } },
        grid: { color: t.grid },
        border: { color: t.inkSoft },
      },
    },
  },
  plugins: [pointLabelsPlugin],
});
Runnable source as JSON, for any HTTP client: https://api.anyplot.ai/specs/scatter-annotated/chartjs/code. Any spec id and library id listed in llms-full.txt fit the same URL shape; every URL below is complete and callable.
{
  "spec_id": "scatter-annotated",
  "language": "javascript",
  "library": "chartjs",
  "page": "https://anyplot.ai/scatter-annotated/javascript/chartjs",
  "hub": "https://anyplot.ai/scatter-annotated",
  "code_json": "https://api.anyplot.ai/specs/scatter-annotated/chartjs/code",
  "spec_json": "https://api.anyplot.ai/specs/scatter-annotated",
  "render_light_png": "https://storage.googleapis.com/anyplot-images/plots/scatter-annotated/javascript/chartjs/plot-light.png",
  "render_dark_png": "https://storage.googleapis.com/anyplot-images/plots/scatter-annotated/javascript/chartjs/plot-dark.png",
  "interactive_light_html": "https://storage.googleapis.com/anyplot-images/plots/scatter-annotated/javascript/chartjs/plot-light.html",
  "interactive_dark_html": "https://storage.googleapis.com/anyplot-images/plots/scatter-annotated/javascript/chartjs/plot-dark.html",
  "quality_score": 88.0,
  "license": "MIT",
  "guide": "https://anyplot.ai/llms.txt"
}
Part of Annotated Scatter Plot with Text Labels on anyplot.ai.