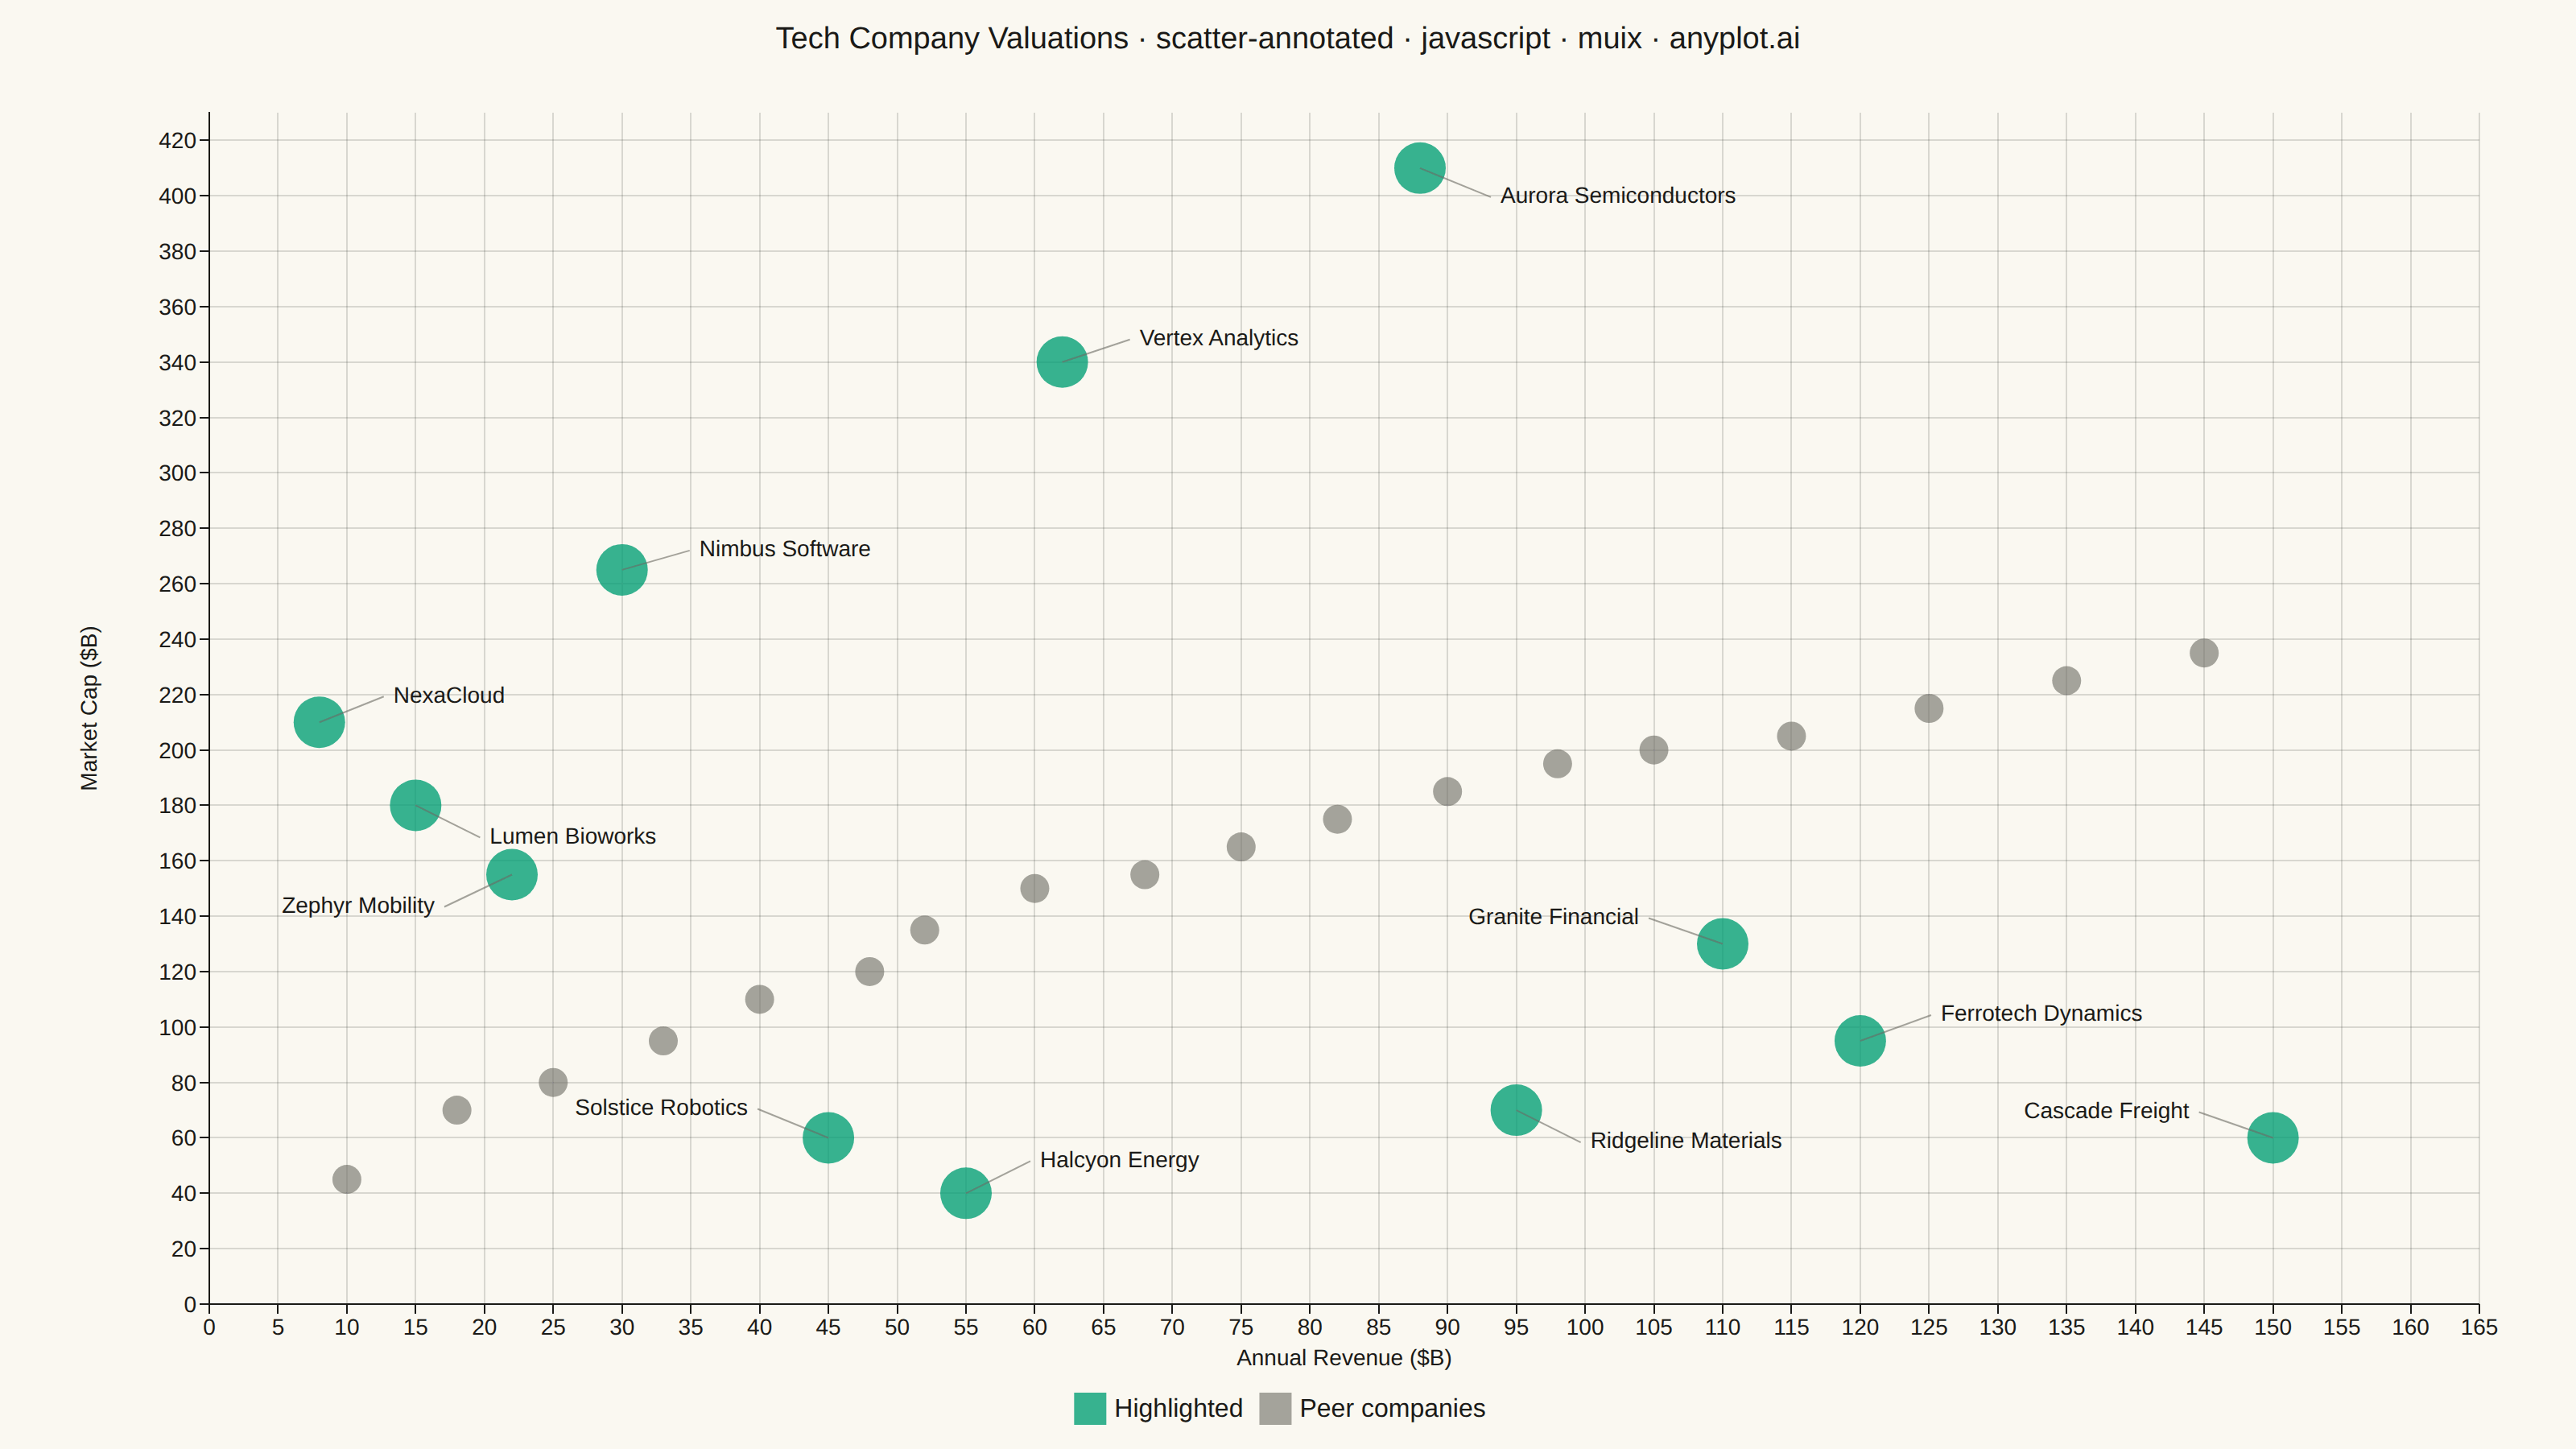
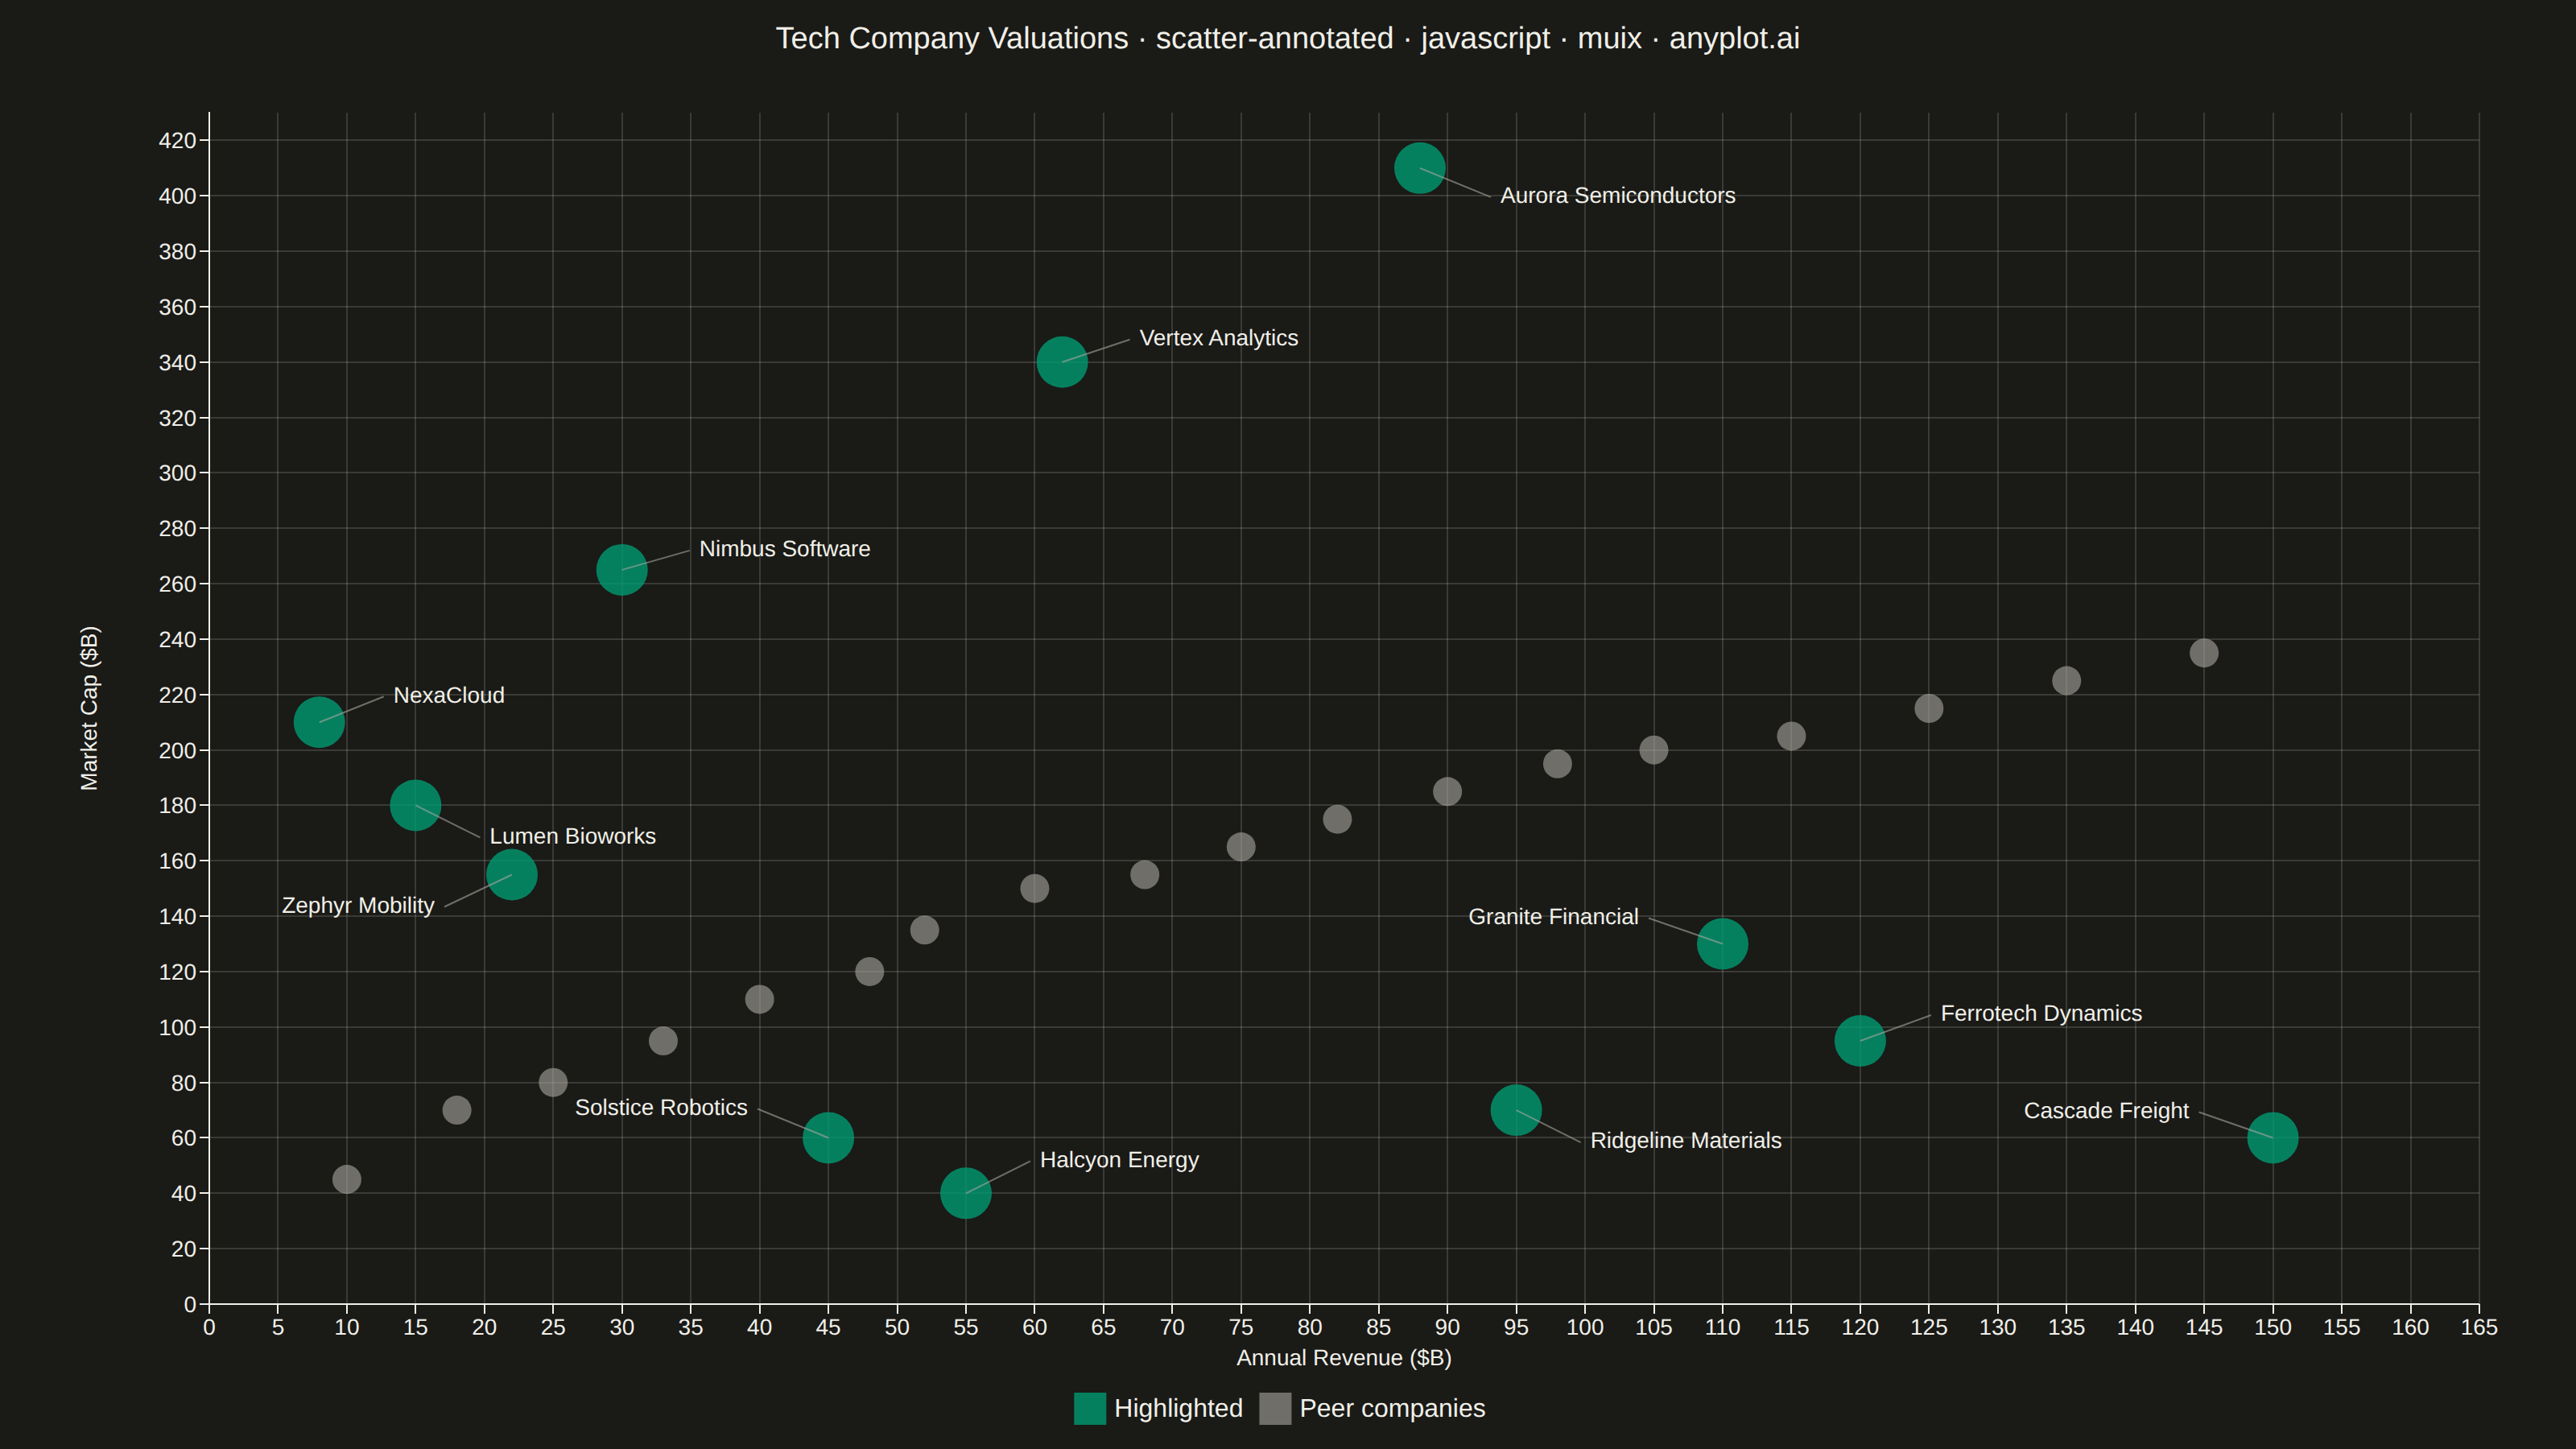
The same plot in 14 other libraries — JavaScript: Chart.js, D3.js, Apache ECharts, Highcharts; Python: Altair, Bokeh, lets-plot, Matplotlib, Plotly, plotnine, Pygal, Seaborn; R: ggplot2; Julia: Makie.jl. Compare all 15 side by side: Annotated Scatter Plot with Text Labels in Python, R, Julia and JavaScript.
A scatter plot where each data point can have a text label annotation, useful for identifying specific points of interest. This visualization enhances basic scatter plots by adding contextual information directly on the chart, making it easy to highlight outliers, named entities, or key data points that deserve special attention.
// anyplot.ai
// scatter-annotated: Annotated Scatter Plot with Text Labels
// Library: muix 7.29.1 | JavaScript 22.23.2
// Quality: 91/100 | Created: 2026-09-05
import { ScatterChart } from "@mui/x-charts/ScatterChart";
import { useXScale, useYScale, getValueToPositionMapper } from "@mui/x-charts/hooks";

const t = window.ANYPLOT_TOKENS;
const isDark = window.ANYPLOT_THEME === "dark";
// The JS harness token set has no "muted" anchor (see prompts/default-style-guide.md
// "Semantic anchors" — other/rest role), so the theme-adaptive hex is applied directly.
const MUTED = isDark ? "#A8A79F" : "#6B6A63";

function hexToRgba(hex: string, alpha: number) {
  const r = parseInt(hex.slice(1, 3), 16);
  const g = parseInt(hex.slice(3, 5), 16);
  const b = parseInt(hex.slice(5, 7), 16);
  return `rgba(${r}, ${g}, ${b}, ${alpha})`;
}

// --- Data (in-memory, deterministic) ---------------------------------------
// Revenue ($B) vs. market cap ($B) for a cohort of tech companies. Highlighted
// companies deviate from the general revenue-to-cap trend (growth premium or
// value discount) — that deviation is exactly what the labels call out.
type Point = { id: string; x: number; y: number; z?: number };

const highlighted: (Point & { label: string; dx: number; dy: number })[] = [
  { id: "nexacloud", x: 8, y: 210, label: "NexaCloud", dx: 40, dy: -16 },
  { id: "solstice", x: 45, y: 60, label: "Solstice Robotics", dx: -44, dy: -18 },
  { id: "vertex", x: 62, y: 340, label: "Vertex Analytics", dx: 42, dy: -14 },
  { id: "ferrotech", x: 120, y: 95, label: "Ferrotech Dynamics", dx: 44, dy: -16 },
  { id: "lumen", x: 15, y: 180, label: "Lumen Bioworks", dx: 40, dy: 20 },
  { id: "aurora", x: 88, y: 410, label: "Aurora Semiconductors", dx: 44, dy: 18 },
  { id: "cascade", x: 150, y: 60, label: "Cascade Freight", dx: -46, dy: -16 },
  { id: "nimbus", x: 30, y: 265, label: "Nimbus Software", dx: 42, dy: -12 },
  { id: "ridgeline", x: 95, y: 70, label: "Ridgeline Materials", dx: 40, dy: 20 },
  { id: "halcyon", x: 55, y: 40, label: "Halcyon Energy", dx: 40, dy: -20 },
  { id: "zephyr", x: 22, y: 155, label: "Zephyr Mobility", dx: -42, dy: 20 },
  { id: "granite", x: 110, y: 130, label: "Granite Financial", dx: -46, dy: -16 },
];

// Unlabeled peer cloud that establishes the general revenue-to-cap trend the
// highlighted companies deviate from — annotating every point would clutter a
// 30-point chart, so only the notable outliers above carry a text label.
const peers: Point[] = [
  { id: "p1", x: 10, y: 45 },
  { id: "p2", x: 18, y: 70 },
  { id: "p3", x: 25, y: 80 },
  { id: "p4", x: 33, y: 95 },
  { id: "p5", x: 40, y: 110 },
  { id: "p6", x: 48, y: 120 },
  { id: "p7", x: 52, y: 135 },
  { id: "p8", x: 60, y: 150 },
  { id: "p9", x: 68, y: 155 },
  { id: "p10", x: 75, y: 165 },
  { id: "p11", x: 82, y: 175 },
  { id: "p12", x: 90, y: 185 },
  { id: "p13", x: 98, y: 195 },
  { id: "p14", x: 105, y: 200 },
  { id: "p15", x: 115, y: 205 },
  { id: "p16", x: 125, y: 215 },
  { id: "p17", x: 135, y: 225 },
  { id: "p18", x: 145, y: 235 },
];

// --- Label + leader-line overlay (child of ScatterChart; reads the same ---
// --- x/y scales the ScatterPlot itself uses, so labels track the markers) --
function PointAnnotations() {
  const xScale = useXScale();
  const yScale = useYScale();
  const getX = getValueToPositionMapper(xScale);
  const getY = getValueToPositionMapper(yScale);

  return (
    <g>
      {highlighted.map((p) => {
        const px = getX(p.x);
        const py = getY(p.y);
        const lx = px + p.dx;
        const ly = py + p.dy;
        const tx = lx + (p.dx >= 0 ? 6 : -6);
        return (
          <g key={p.id}>
            <line x1={px} y1={py} x2={lx} y2={ly} stroke={MUTED} strokeWidth={1} opacity={0.6} />
            <text
              x={tx}
              y={ly}
              fontSize={14}
              fontWeight={500}
              fill={t.ink}
              textAnchor={p.dx >= 0 ? "start" : "end"}
              dominantBaseline="middle"
            >
              {p.label}
            </text>
          </g>
        );
      })}
    </g>
  );
}

// --- Chart (default-exported component — the harness mounts it) -------------
export default function Chart() {
  return (
    <div style={{ width: "100%", height: "100%", position: "relative" }}>
      {/* Title rendered in the chart's top margin space — MUI X has no built-in title slot */}
      <div
        style={{
          position: "absolute",
          top: 14,
          left: 0,
          right: 0,
          textAlign: "center",
          zIndex: 1,
          fontSize: 19,
          fontWeight: 500,
          color: t.ink,
          pointerEvents: "none",
        }}
      >
        Tech Company Valuations · scatter-annotated · javascript · muix · anyplot.ai
      </div>

      <ScatterChart
        width={window.ANYPLOT_SIZE.width}
        height={window.ANYPLOT_SIZE.height}
        skipAnimation
        disableVoronoi
        grid={{ horizontal: true, vertical: true }}
        xAxis={[{ label: "Annual Revenue ($B)", min: 0, max: 165, tickLabelStyle: { fontSize: 14 } }]}
        yAxis={[
          {
            label: "Market Cap ($B)",
            min: 0,
            max: 430,
            tickLabelStyle: { fontSize: 14 },
            // labelRefPoint offsets by `tickFontSize` (the legacy prop, not
            // tickLabelStyle) — bump it so the rotated axis label clears the
            // wide 3-digit tick numbers instead of overlapping them.
            tickFontSize: 54,
          },
        ]}
        series={[
          {
            id: "highlighted",
            label: "Highlighted",
            data: highlighted,
            markerSize: 16,
            color: hexToRgba(t.palette[0], 0.78),
          },
          {
            id: "peers",
            label: "Peer companies",
            data: peers,
            markerSize: 9,
            color: hexToRgba(MUTED, 0.6),
          },
        ]}
        slotProps={{
          legend: { direction: "row", position: { vertical: "bottom", horizontal: "middle" } },
        }}
        sx={{
          "& .MuiChartsAxis-bottom .MuiChartsAxis-label": { fontSize: "16px !important" },
          "& .MuiChartsAxis-left .MuiChartsAxis-label": { fontSize: "13px !important" },
          "& .MuiChartsLegend-label": { fontSize: "15px !important" },
        }}
        margin={{ top: 70, right: 60, bottom: 90, left: 130 }}
      >
        <PointAnnotations />
      </ScatterChart>
    </div>
  );
}
Runnable source as JSON, for any HTTP client: https://api.anyplot.ai/specs/scatter-annotated/muix/code. Any spec id and library id listed in llms-full.txt fit the same URL shape; every URL below is complete and callable.
{
  "spec_id": "scatter-annotated",
  "language": "javascript",
  "library": "muix",
  "page": "https://anyplot.ai/scatter-annotated/javascript/muix",
  "hub": "https://anyplot.ai/scatter-annotated",
  "code_json": "https://api.anyplot.ai/specs/scatter-annotated/muix/code",
  "spec_json": "https://api.anyplot.ai/specs/scatter-annotated",
  "render_light_png": "https://storage.googleapis.com/anyplot-images/plots/scatter-annotated/javascript/muix/plot-light.png",
  "render_dark_png": "https://storage.googleapis.com/anyplot-images/plots/scatter-annotated/javascript/muix/plot-dark.png",
  "interactive_light_html": "https://storage.googleapis.com/anyplot-images/plots/scatter-annotated/javascript/muix/plot-light.html",
  "interactive_dark_html": "https://storage.googleapis.com/anyplot-images/plots/scatter-annotated/javascript/muix/plot-dark.html",
  "quality_score": 91.0,
  "license": "MIT",
  "guide": "https://anyplot.ai/llms.txt"
}
Part of Annotated Scatter Plot with Text Labels on anyplot.ai.