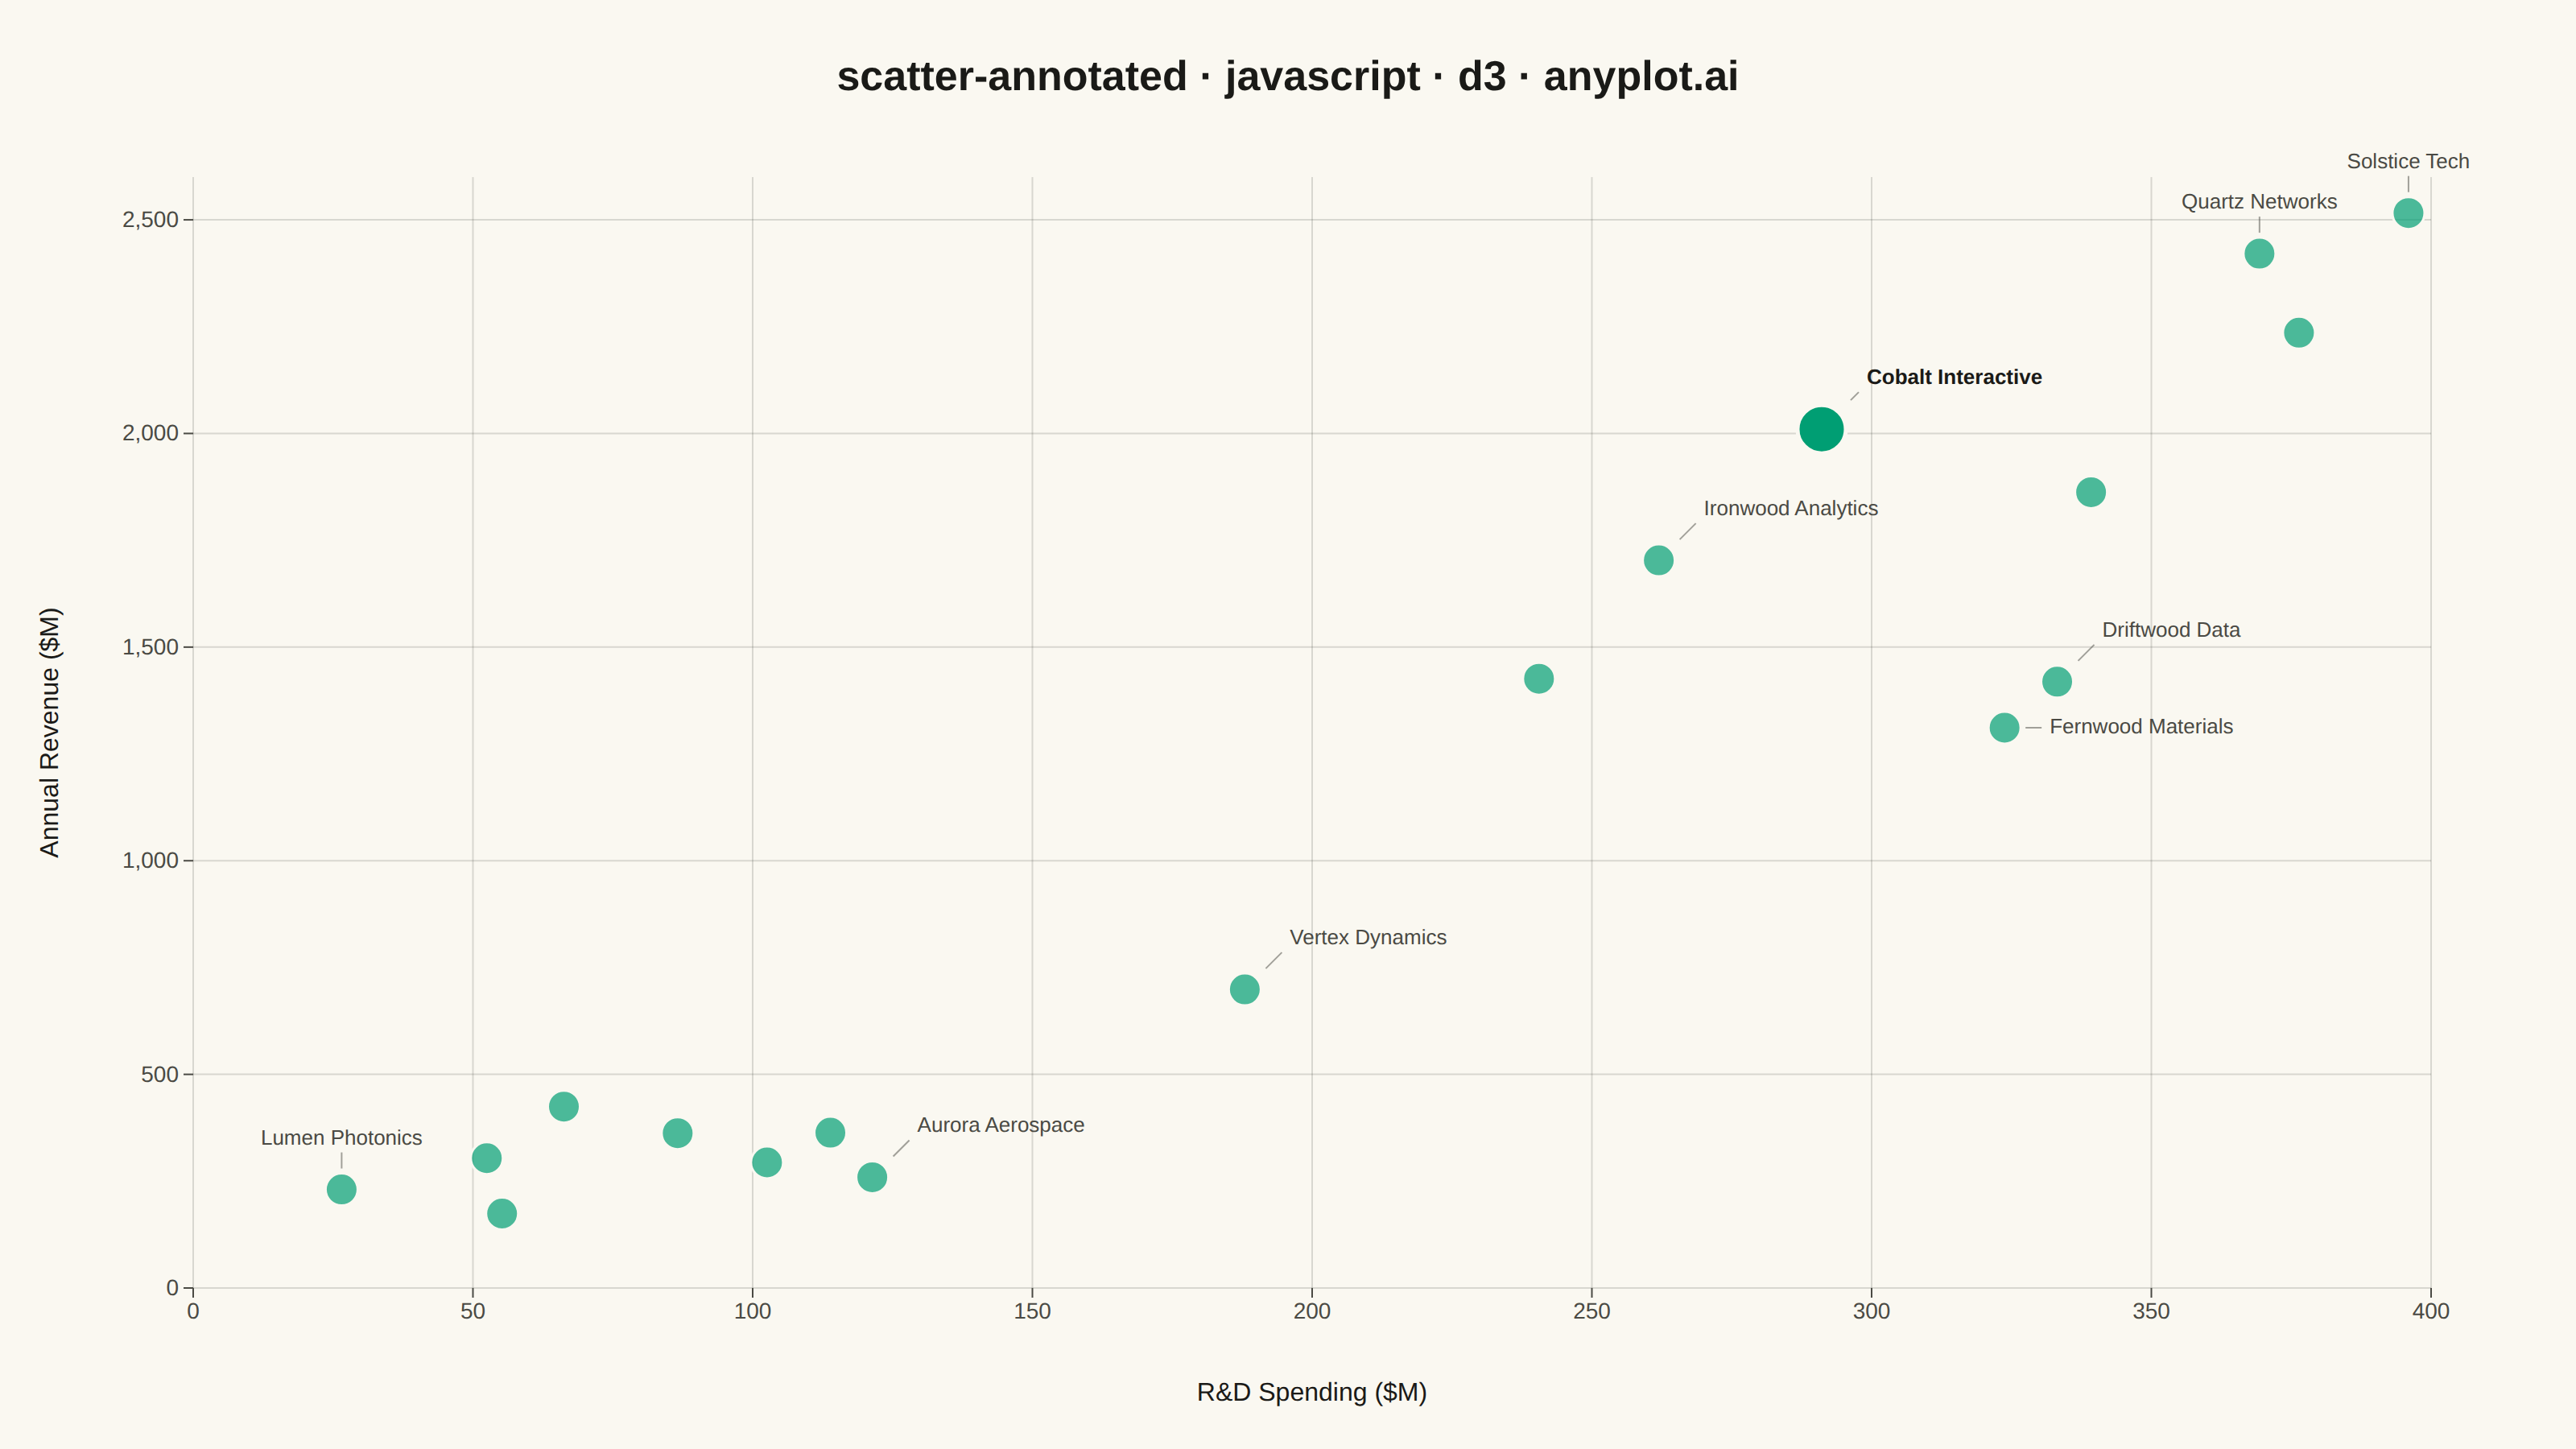
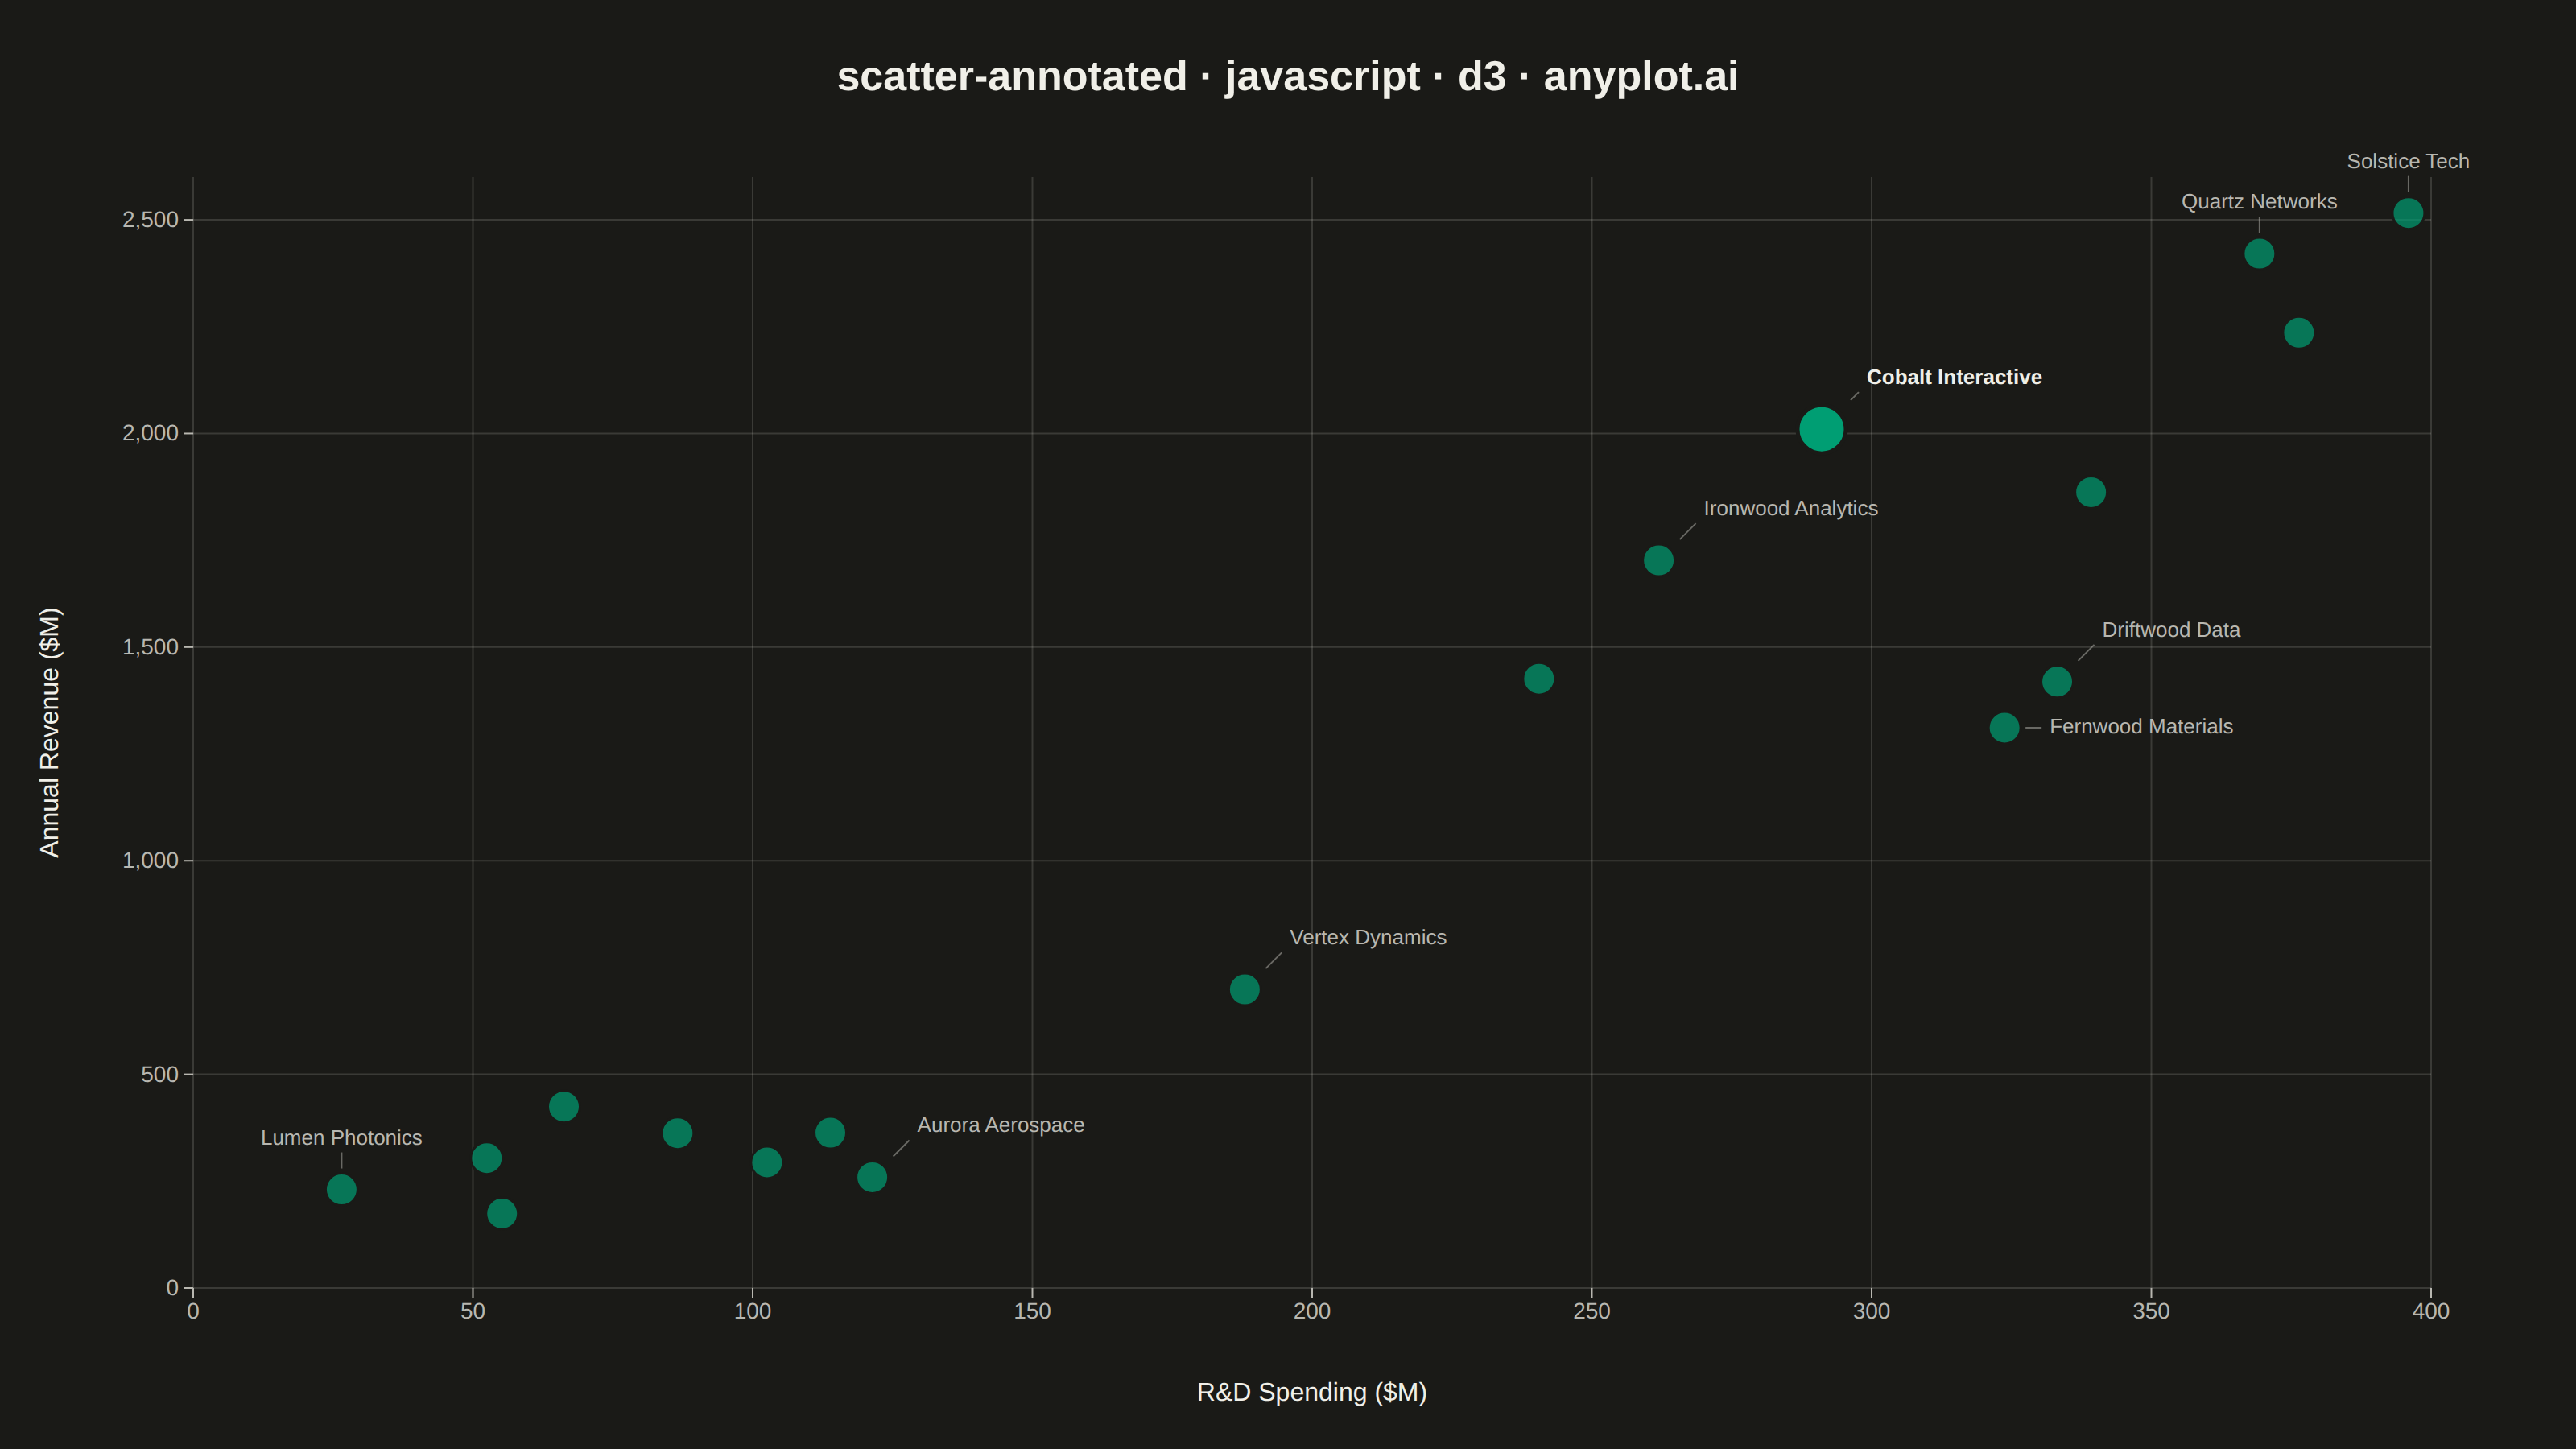
The same plot in 14 other libraries — JavaScript: Chart.js, Apache ECharts, Highcharts, MUI X Charts; Python: Altair, Bokeh, lets-plot, Matplotlib, Plotly, plotnine, Pygal, Seaborn; R: ggplot2; Julia: Makie.jl. Compare all 15 side by side: Annotated Scatter Plot with Text Labels in Python, R, Julia and JavaScript.
A scatter plot where each data point can have a text label annotation, useful for identifying specific points of interest. This visualization enhances basic scatter plots by adding contextual information directly on the chart, making it easy to highlight outliers, named entities, or key data points that deserve special attention.
// anyplot.ai
// scatter-annotated: Annotated Scatter Plot with Text Labels
// Library: d3 7.9.0 | JavaScript 22.23.2
// Quality: 92/100 | Created: 2026-09-05

//# anyplot-orientation: landscape
const t = window.ANYPLOT_TOKENS;
const { width, height } = window.ANYPLOT_SIZE;
const margin = { top: 110, right: 90, bottom: 100, left: 120 };
const iw = width - margin.left - margin.right;
const ih = height - margin.top - margin.bottom;

// --- Deterministic PRNG (tiny LCG — Math.random() is not reproducible) -----
let seed = 42;
function rand() {
  seed = (seed * 1664525 + 1013904223) % 4294967296;
  return seed / 4294967296;
}

// --- Data: R&D spend vs. annual revenue for fictional tech companies -------
const companies = [
  "Nimbus Labs", "Cascade Systems", "Vertex Dynamics", "Solstice Tech",
  "Ironwood Analytics", "Beacon Robotics", "Quartz Networks", "Halcyon AI",
  "Meridian Software", "Driftwood Data", "Lumen Photonics", "Argent Cloud",
  "Tidewater Semiconductors", "Cobalt Interactive", "Palisade Security",
  "Everline Biotech", "Fernwood Materials", "Aurora Aerospace",
];

const data = companies.map((label) => {
  const rdSpend = 18 + rand() * 380;
  const revenue = Math.max(35, rdSpend * (2.6 + rand() * 4.4) + (rand() - 0.5) * 300);
  return { label, x: rdSpend, y: revenue };
});

// --- Scales -------------------------------------------------------------
const x = d3.scaleLinear().domain(d3.extent(data, (d) => d.x)).nice().range([0, iw]);
const y = d3.scaleLinear().domain([0, d3.max(data, (d) => d.y)]).nice().range([ih, 0]);

// --- SVG mount ------------------------------------------------------------
const svg = d3.select("#container").append("svg").attr("width", width).attr("height", height);
const g = svg.append("g").attr("transform", `translate(${margin.left},${margin.top})`);

// --- Gridlines (both axes, per scatter convention) -------------------------
g.append("g")
  .attr("transform", `translate(0,${ih})`)
  .call(d3.axisBottom(x).ticks(8).tickSize(-ih).tickFormat(""))
  .call((sel) => sel.select(".domain").remove())
  .selectAll("line")
  .attr("stroke", t.grid);

g.append("g")
  .call(d3.axisLeft(y).ticks(7).tickSize(-iw).tickFormat(""))
  .call((sel) => sel.select(".domain").remove())
  .selectAll("line")
  .attr("stroke", t.grid);

// --- Axes -------------------------------------------------------------------
const xAxis = g.append("g").attr("transform", `translate(0,${ih})`).call(d3.axisBottom(x).ticks(8));
const yAxis = g.append("g").call(d3.axisLeft(y).ticks(7));
for (const ax of [xAxis, yAxis]) {
  ax.selectAll("text").attr("fill", t.inkSoft).style("font-size", "14px").style("font-family", "sans-serif");
  ax.selectAll("line").attr("stroke", t.inkSoft);
  ax.select(".domain").remove();
}

// --- Axis labels --------------------------------------------------------
svg.append("text")
  .attr("x", margin.left + iw / 2)
  .attr("y", height - 30)
  .attr("text-anchor", "middle")
  .attr("fill", t.ink)
  .style("font-size", "16px")
  .style("font-family", "sans-serif")
  .text("R&D Spending ($M)");

svg.append("text")
  .attr("transform", `translate(${36},${margin.top + ih / 2}) rotate(-90)`)
  .attr("text-anchor", "middle")
  .attr("fill", t.ink)
  .style("font-size", "16px")
  .style("font-family", "sans-serif")
  .text("Annual Revenue ($M)");

// --- Marker + label layout --------------------------------------------------
const markerRadius = 10;

// --- Trend-relative highlight: which company earns the most revenue per
// R&D dollar (the story's focal point), and which points are worth naming --
const n = data.length;
const sumX = d3.sum(data, (d) => d.x);
const sumY = d3.sum(data, (d) => d.y);
const sumXY = d3.sum(data, (d) => d.x * d.y);
const sumXX = d3.sum(data, (d) => d.x * d.x);
const slope = (n * sumXY - sumX * sumY) / (n * sumXX - sumX * sumX);
const intercept = (sumY - slope * sumX) / n;
const withResidual = data.map((d) => ({ ...d, residual: d.y - (slope * d.x + intercept) }));
const standout = withResidual.reduce((a, b) => (b.residual > a.residual ? b : a));

// Label only the notable subset — biggest over/under-performers relative to
// the trend, plus the R&D and revenue extremes — per the spec's guidance to
// annotate a subset rather than every point once the dataset gets dense.
const maxX = d3.max(data, (d) => d.x);
const maxY = d3.max(data, (d) => d.y);
const keyLabels = new Set(
  [...withResidual]
    .sort((a, b) => Math.abs(b.residual) - Math.abs(a.residual))
    .slice(0, 8)
    .map((d) => d.label)
);
keyLabels.add(standout.label);
for (const d of data) if (d.x === maxX || d.y === maxY) keyLabels.add(d.label);

// The trend-beating standout renders larger and at full opacity to act as a
// focal point; the rest stay uniform to keep the density-driven alpha~0.7.
const points = data.map((d) => ({
  ...d,
  px: x(d.x),
  py: y(d.y),
  r: d.label === standout.label ? markerRadius + 5 : markerRadius,
}));

// --- Points ---------------------------------------------------------------
g.selectAll(".point")
  .data(points)
  .join("circle")
  .attr("class", "point")
  .attr("cx", (d) => d.px)
  .attr("cy", (d) => d.py)
  .attr("r", (d) => d.r)
  .attr("fill", t.palette[0])
  .attr("fill-opacity", (d) => (d.label === standout.label ? 1 : 0.7))
  .attr("stroke", t.pageBg)
  .attr("stroke-width", (d) => (d.label === standout.label ? 2.5 : 1.5));

// --- Greedy label placement (a hand-rolled adjustText equivalent) ---------
// D3 has no adjustText port, but the render harness runs in a real browser,
// so text width is measured with actual SVG layout (getBBox) rather than
// estimated — jsdom can't do this, a headless Chromium can.
const labeledPoints = points.filter((d) => keyLabels.has(d.label));
const measure = svg.append("text").attr("opacity", 0).style("font-size", "13px").style("font-family", "sans-serif");
const labelWidth = new Map(labeledPoints.map((d) => {
  measure.text(d.label);
  return [d.label, measure.node().getBBox().width];
}));
measure.remove();
const labelHeight = 15;

const compass = [
  { dx: 1, dy: -1 }, { dx: 0, dy: -1 }, { dx: 1, dy: 0 }, { dx: -1, dy: -1 },
  { dx: 1, dy: 1 }, { dx: -1, dy: 0 }, { dx: 0, dy: 1 }, { dx: -1, dy: 1 },
];
const radii = [28, 42, 58, 76, 96];
const pad = 5;

// The chosen box must stay within the canvas (g is translated by margin.left/
// margin.top, so the usable local-coordinate range extends margin.right/bottom
// past iw/ih but not past the page edge) — otherwise a label near a domain
// extreme can be pushed off the saved PNG (AR-09 edge clipping).
const edgePad = 4;
const boundsMinX = -margin.left + edgePad;
const boundsMaxX = iw + margin.right - edgePad;
const boundsMinY = -margin.top + edgePad;
const boundsMaxY = ih + margin.bottom - edgePad;
function inCanvasBounds(box) {
  return box.x0 >= boundsMinX && box.x1 <= boundsMaxX && box.y0 >= boundsMinY && box.y1 <= boundsMaxY;
}

function labelBox(px, py, dir, r, w, h) {
  const anchorX = px + dir.dx * r;
  const anchorY = py + dir.dy * r;
  const x0 = dir.dx > 0 ? anchorX : dir.dx < 0 ? anchorX - w : anchorX - w / 2;
  const y0 = dir.dy > 0 ? anchorY - h * 0.2 : dir.dy < 0 ? anchorY - h * 0.9 : anchorY - h / 2;
  return { x0, y0, x1: x0 + w, y1: y0 + h, anchorX, anchorY };
}

function overlaps(a, b) {
  return a.x0 < b.x1 + pad && a.x1 + pad > b.x0 && a.y0 < b.y1 + pad && a.y1 + pad > b.y0;
}

const markerBoxes = points.map((d) => ({
  label: d.label,
  x0: d.px - d.r - pad, y0: d.py - d.r - pad,
  x1: d.px + d.r + pad, y1: d.py + d.r + pad,
}));

const placedBoxes = [];
const placed = labeledPoints.map((d) => {
  const w = labelWidth.get(d.label);
  let chosen = null;
  outer: for (const r of radii) {
    for (const dir of compass) {
      const box = labelBox(d.px, d.py, dir, r, w, labelHeight);
      if (!inCanvasBounds(box)) continue;
      const hitsMarker = markerBoxes.some((m) => m.label !== d.label && overlaps(box, m));
      const hitsLabel = placedBoxes.some((p) => overlaps(box, p));
      if (!hitsMarker && !hitsLabel) {
        chosen = { box, dir, r };
        break outer;
      }
    }
  }
  // Relaxed pass: allow overlap but never allow the label to run off-canvas —
  // a collision is a legibility nit, an edge clip is an auto-reject.
  if (!chosen) {
    outerRelaxed: for (const r of radii) {
      for (const dir of compass) {
        const box = labelBox(d.px, d.py, dir, r, w, labelHeight);
        if (inCanvasBounds(box)) {
          chosen = { box, dir, r };
          break outerRelaxed;
        }
      }
    }
  }
  if (!chosen) {
    const dir = compass[0];
    const r = radii[radii.length - 1];
    let box = labelBox(d.px, d.py, dir, r, w, labelHeight);
    let shiftX = 0;
    if (box.x1 > boundsMaxX) shiftX = boundsMaxX - box.x1;
    else if (box.x0 < boundsMinX) shiftX = boundsMinX - box.x0;
    let shiftY = 0;
    if (box.y1 > boundsMaxY) shiftY = boundsMaxY - box.y1;
    else if (box.y0 < boundsMinY) shiftY = boundsMinY - box.y0;
    box = {
      x0: box.x0 + shiftX, x1: box.x1 + shiftX,
      y0: box.y0 + shiftY, y1: box.y1 + shiftY,
      anchorX: box.anchorX + shiftX, anchorY: box.anchorY + shiftY,
    };
    chosen = { box, dir, r };
  }
  placedBoxes.push(chosen.box);
  return {
    ...d,
    dir: chosen.dir,
    anchorX: chosen.box.anchorX,
    anchorY: chosen.box.anchorY,
    textAnchor: chosen.dir.dx > 0 ? "start" : chosen.dir.dx < 0 ? "end" : "middle",
    baseline: chosen.dir.dy > 0 ? "hanging" : chosen.dir.dy < 0 ? "auto" : "middle",
  };
});

// --- Leader lines (subtle, connecting offset labels back to their point) ---
g.selectAll(".leader")
  .data(placed)
  .join("line")
  .attr("class", "leader")
  .attr("x1", (d) => d.px + d.dir.dx * (d.r + 3))
  .attr("y1", (d) => d.py + d.dir.dy * (d.r + 3))
  .attr("x2", (d) => d.anchorX - d.dir.dx * 5)
  .attr("y2", (d) => d.anchorY - d.dir.dy * 5)
  .attr("stroke", t.inkSoft)
  .attr("stroke-width", 1)
  .attr("opacity", 0.5);

// --- Labels -------------------------------------------------------------
g.selectAll(".label")
  .data(placed)
  .join("text")
  .attr("class", "label")
  .attr("x", (d) => d.anchorX)
  .attr("y", (d) => d.anchorY)
  .attr("text-anchor", (d) => d.textAnchor)
  .attr("dominant-baseline", (d) => d.baseline)
  .attr("fill", (d) => (d.label === standout.label ? t.ink : t.inkSoft))
  .style("font-size", "13px")
  .style("font-weight", (d) => (d.label === standout.label ? "600" : "400"))
  .style("font-family", "sans-serif")
  .text((d) => d.label);

// --- Title ------------------------------------------------------------------
svg.append("text")
  .attr("x", width / 2)
  .attr("y", 56)
  .attr("text-anchor", "middle")
  .attr("fill", t.ink)
  .style("font-size", "26px")
  .style("font-weight", "600")
  .style("font-family", "sans-serif")
  .text("scatter-annotated · javascript · d3 · anyplot.ai");
Runnable source as JSON, for any HTTP client: https://api.anyplot.ai/specs/scatter-annotated/d3/code. Any spec id and library id listed in llms-full.txt fit the same URL shape; every URL below is complete and callable.
{
  "spec_id": "scatter-annotated",
  "language": "javascript",
  "library": "d3",
  "page": "https://anyplot.ai/scatter-annotated/javascript/d3",
  "hub": "https://anyplot.ai/scatter-annotated",
  "code_json": "https://api.anyplot.ai/specs/scatter-annotated/d3/code",
  "spec_json": "https://api.anyplot.ai/specs/scatter-annotated",
  "render_light_png": "https://storage.googleapis.com/anyplot-images/plots/scatter-annotated/javascript/d3/plot-light.png",
  "render_dark_png": "https://storage.googleapis.com/anyplot-images/plots/scatter-annotated/javascript/d3/plot-dark.png",
  "interactive_light_html": "https://storage.googleapis.com/anyplot-images/plots/scatter-annotated/javascript/d3/plot-light.html",
  "interactive_dark_html": "https://storage.googleapis.com/anyplot-images/plots/scatter-annotated/javascript/d3/plot-dark.html",
  "quality_score": 92.0,
  "license": "MIT",
  "guide": "https://anyplot.ai/llms.txt"
}
Part of Annotated Scatter Plot with Text Labels on anyplot.ai.