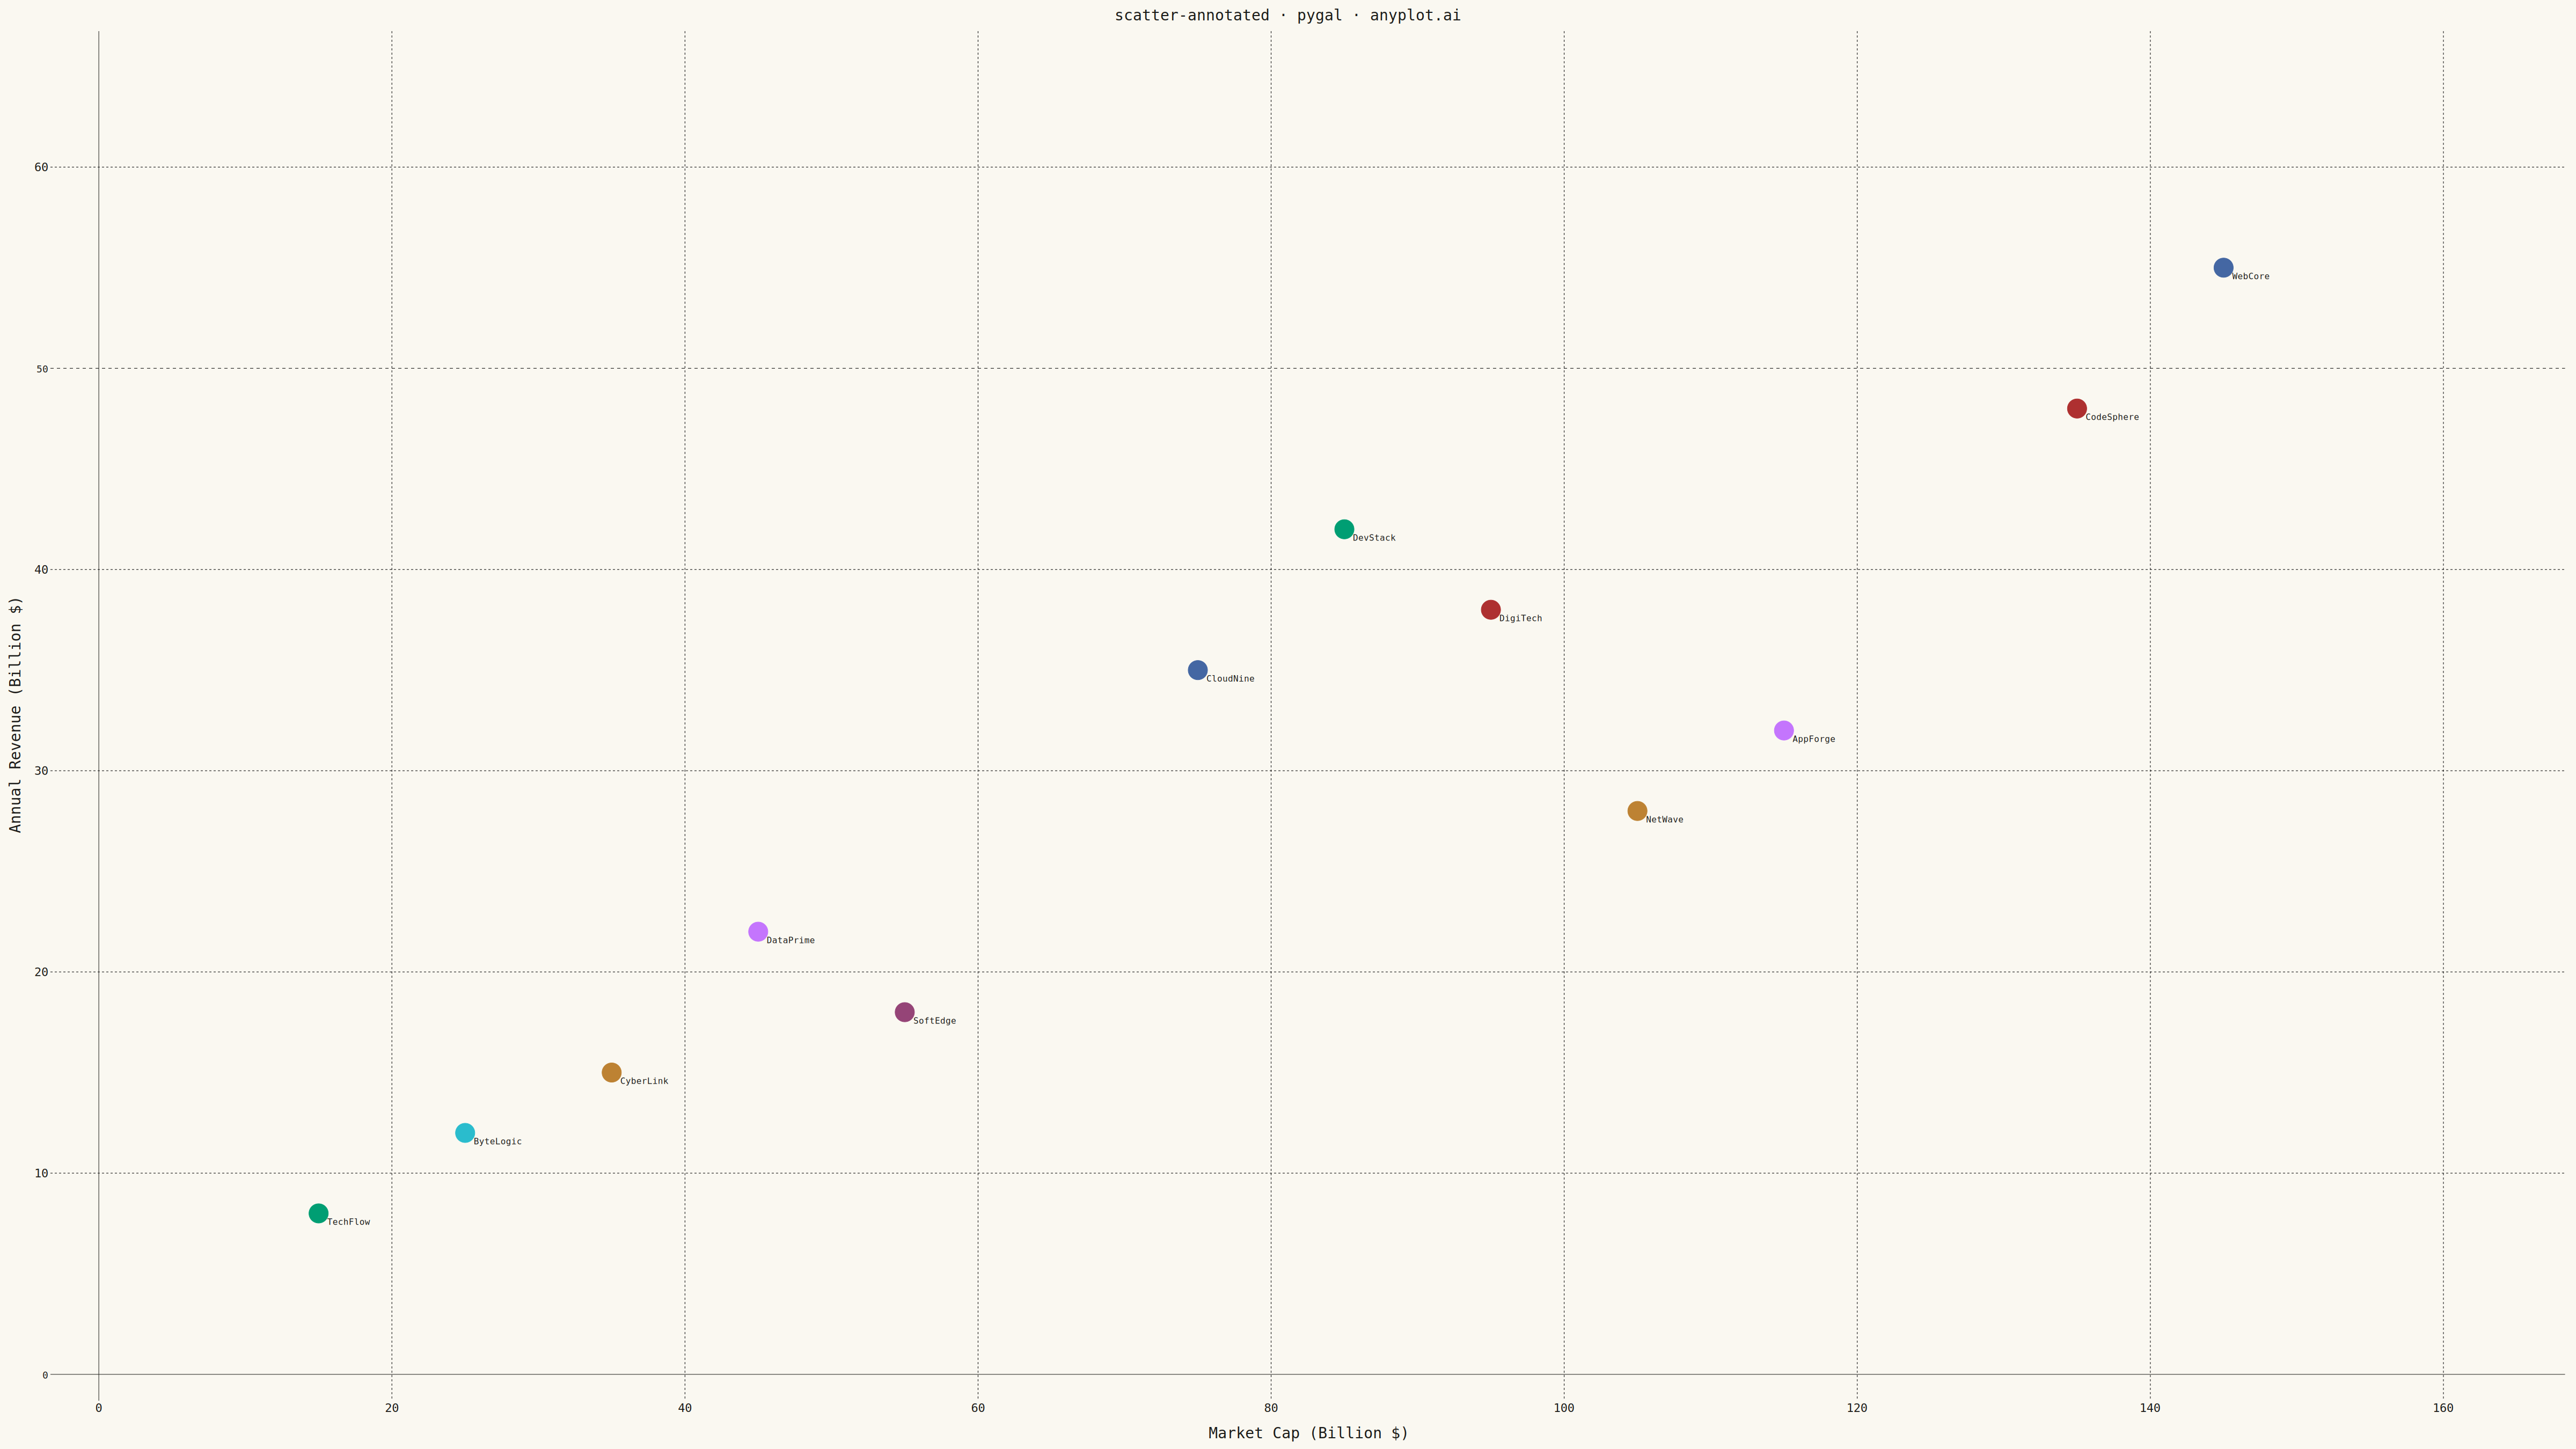
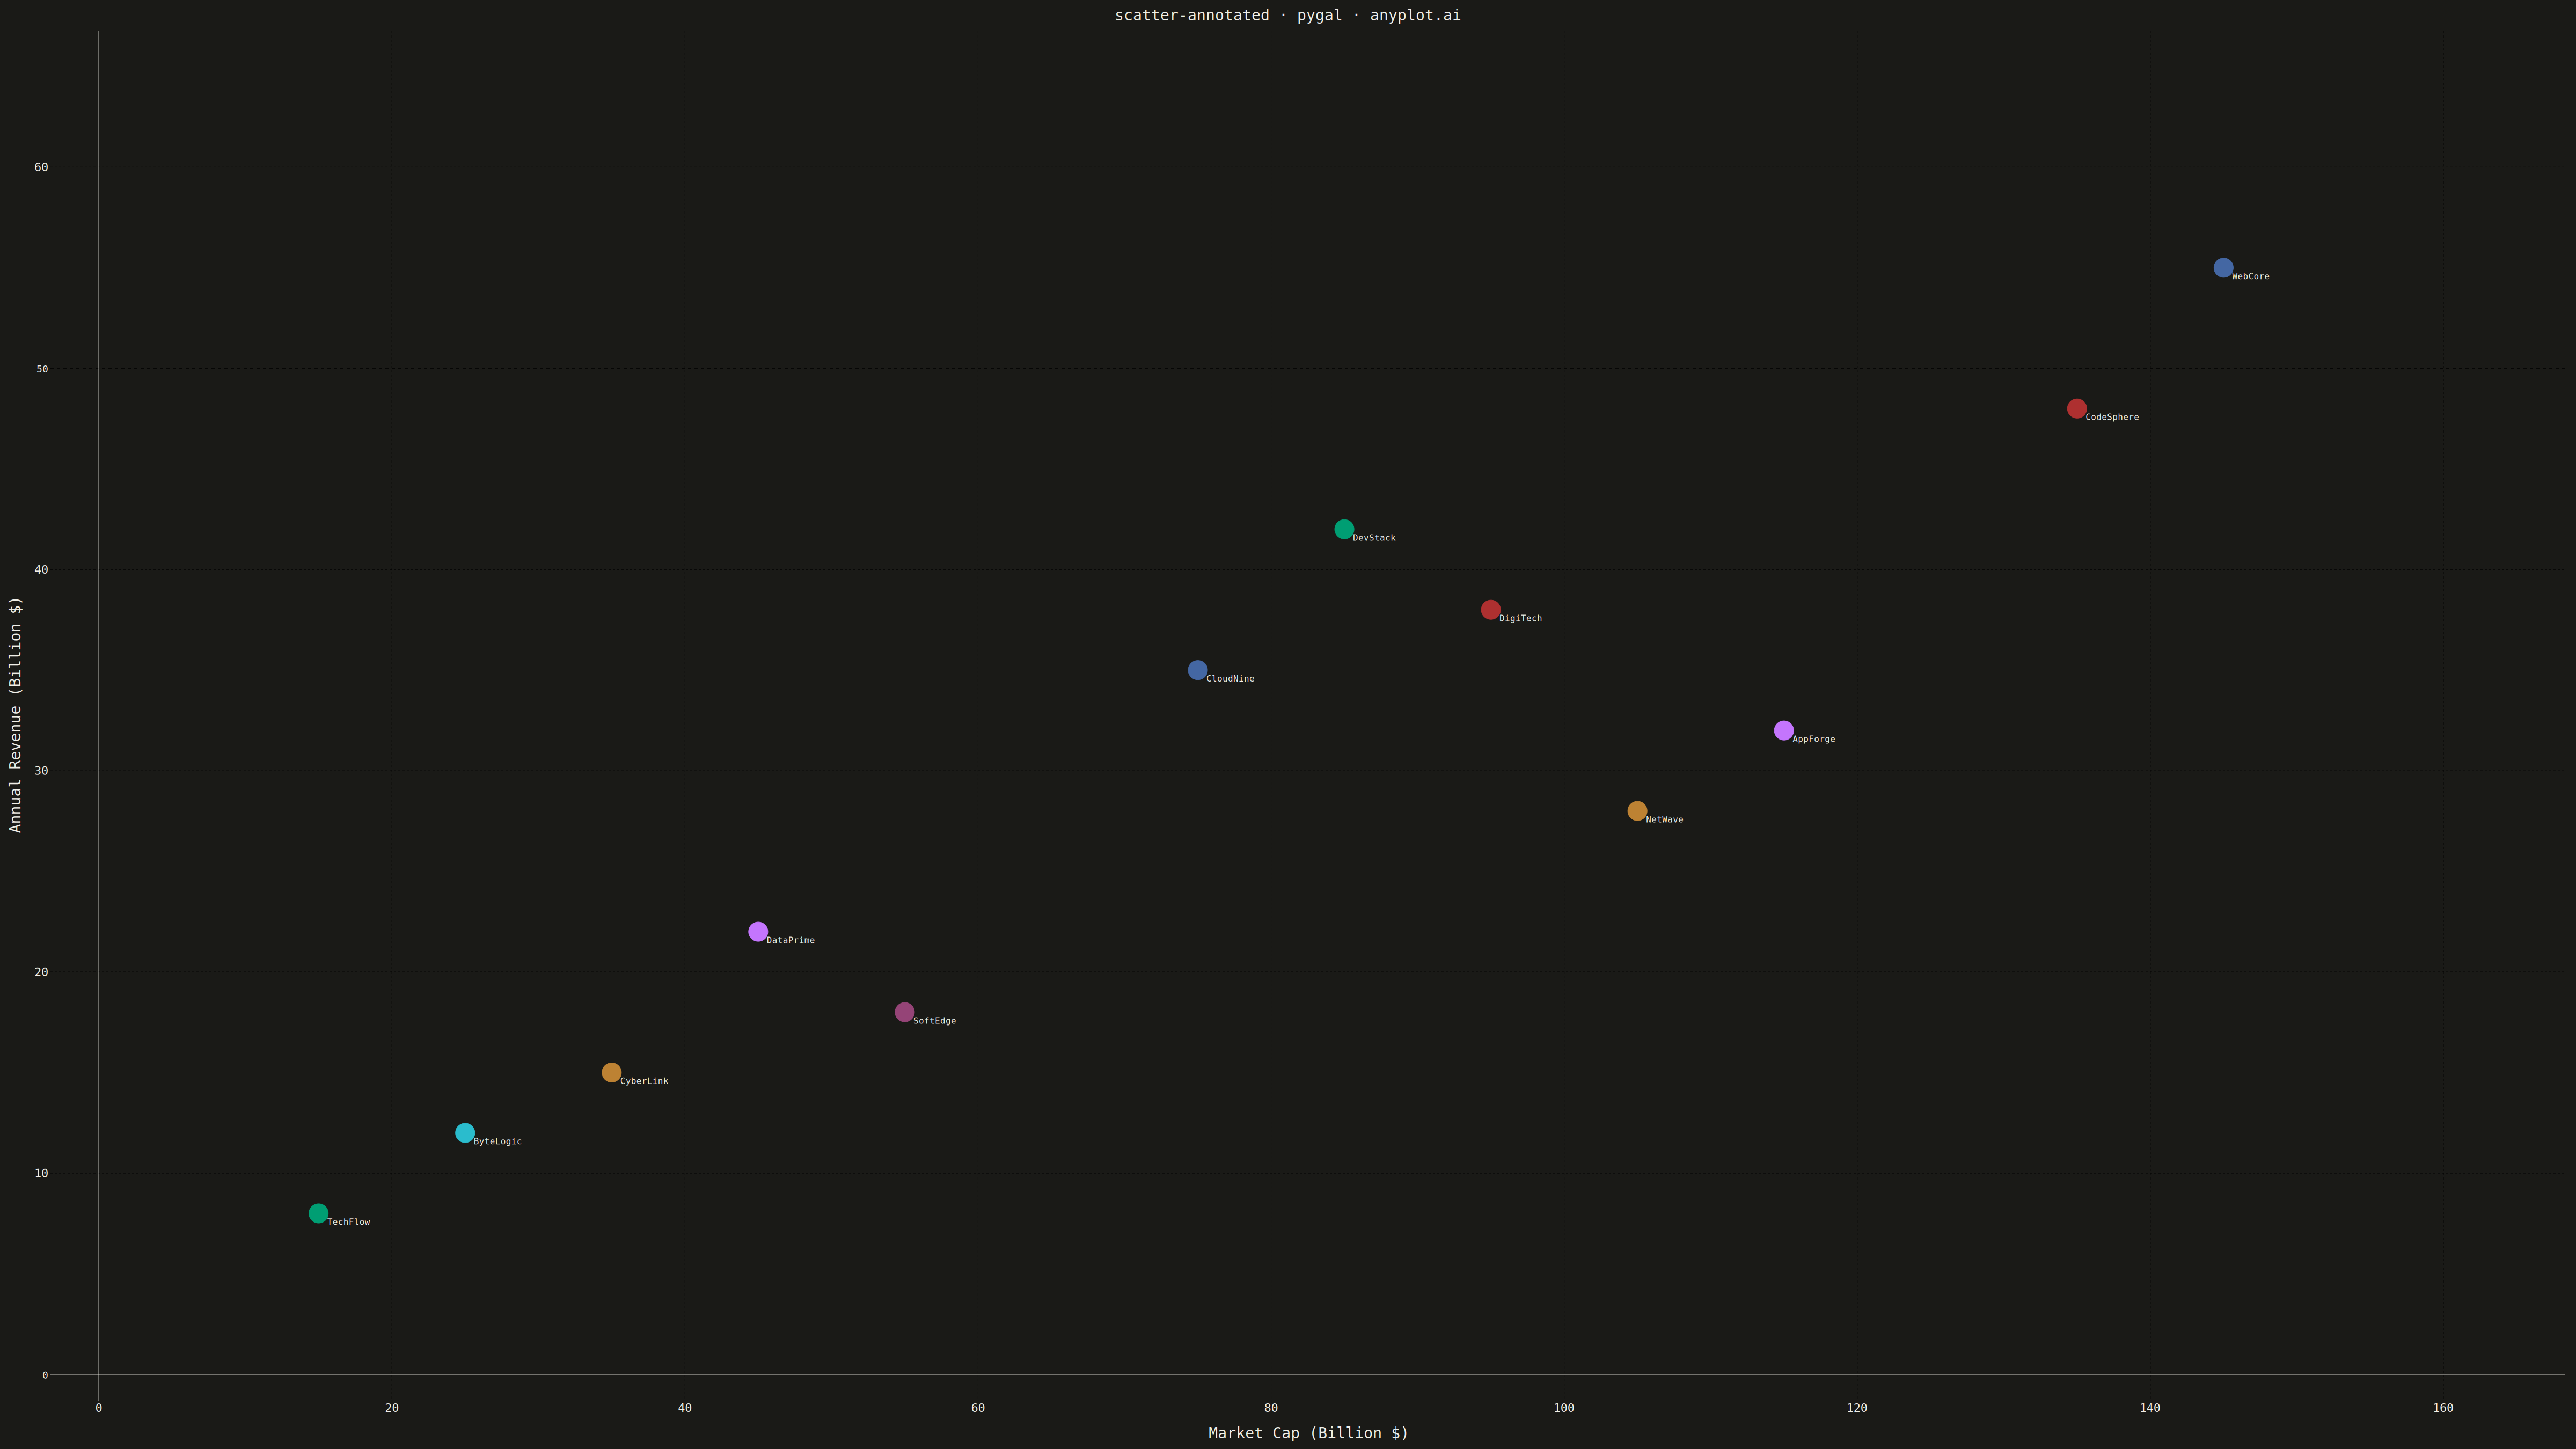
A scatter plot where each data point can have a text label annotation, useful for identifying specific points of interest. This visualization enhances basic scatter plots by adding contextual information directly on the chart, making it easy to highlight outliers, named entities, or key data points that deserve special attention.
""" anyplot.ai
scatter-annotated: Annotated Scatter Plot with Text Labels
Library: pygal 3.1.0 | Python 3.13.13
Quality: 81/100 | Updated: 2026-05-13
"""

import os
import sys
import xml.etree.ElementTree as ET

import cairosvg


# Workaround: pygal.py file in cwd conflicts with pygal package.
# Remove current directory from sys.path before importing.
_original_path = sys.path[:]
while "" in sys.path:
    sys.path.remove("")
if sys.path[0].endswith("implementations/python"):
    sys.path.pop(0)

import numpy as np
import pygal
from pygal.style import Style


sys.path = _original_path


# Theme tokens
THEME = os.getenv("ANYPLOT_THEME", "light")
PAGE_BG = "#FAF8F1" if THEME == "light" else "#1A1A17"
ELEVATED_BG = "#FFFDF6" if THEME == "light" else "#242420"
INK = "#1A1A17" if THEME == "light" else "#F0EFE8"
INK_MUTED = "#6B6A63" if THEME == "light" else "#A8A79F"

# Okabe-Ito palette: first series = #009E73 (brand green)
IMPRINT = (
    "#009E73",  # 1: bluish green (brand)
    "#C475FD",  # 2: vermillion
    "#4467A3",  # 3: blue
    "#BD8233",  # 4: reddish purple
    "#AE3030",  # 5: orange
    "#2ABCCD",  # 6: sky blue
    "#954477",  # 7: yellow
    "#009E73",  # 8: cycle back to brand for 8+ companies
    "#C475FD",
    "#4467A3",
    "#BD8233",
    "#AE3030",
)

# Data - Tech company market performance
companies = [
    "TechFlow",
    "DataPrime",
    "CloudNine",
    "NetWave",
    "CodeSphere",
    "ByteLogic",
    "SoftEdge",
    "DevStack",
    "AppForge",
    "WebCore",
    "CyberLink",
    "DigiTech",
]

# Market cap (x) and annual revenue (y) in billions
market_cap = np.array([15, 45, 75, 105, 135, 25, 55, 85, 115, 145, 35, 95])
revenue = np.array([8, 22, 35, 28, 48, 12, 18, 42, 32, 55, 15, 38])

# Custom style with theme-adaptive colors and chrome
custom_style = Style(
    background=PAGE_BG,
    plot_background=PAGE_BG,
    foreground=INK,
    foreground_strong=INK,
    foreground_subtle=INK_MUTED,
    colors=IMPRINT,
    title_font_size=28,
    label_font_size=22,
    major_label_font_size=18,
    legend_font_size=16,
    value_font_size=16,
    stroke_width=3,
)

# Create scatter chart
chart = pygal.XY(
    width=4800,
    height=2700,
    style=custom_style,
    title="scatter-annotated · pygal · anyplot.ai",
    x_title="Market Cap (Billion $)",
    y_title="Annual Revenue (Billion $)",
    show_legend=False,
    show_x_guides=True,
    show_y_guides=True,
    dots_size=16,
    stroke=False,
    show_dots=True,
    range=(0, 65),
    xrange=(0, 165),
    print_values=True,
    print_values_position="top",
)

# Add each company as individual series with Okabe-Ito color and annotation
for i, company in enumerate(companies):
    chart.add(
        company,
        [{"value": (market_cap[i], revenue[i]), "label": company, "formatter": lambda x, c=company: c}],
        dots_size=18,
        formatter=lambda x, c=company: c,
    )

# Render to SVG and fix label colors to match INK theme token
svg_bytes = chart.render()

# Parse SVG and fix label text colors
ET.register_namespace("", "http://www.w3.org/2000/svg")
ET.register_namespace("xlink", "http://www.w3.org/1999/xlink")
root = ET.fromstring(svg_bytes)
ns = {"svg": "http://www.w3.org/2000/svg"}

# Find all text elements and fix those that contain company names
for text_elem in root.findall(".//svg:text", ns):
    text_content = "".join(text_elem.itertext()).strip()
    if text_content in companies:
        # Set fill color to INK using style attribute to ensure it takes precedence
        current_style = text_elem.get("style", "")
        if current_style:
            text_elem.set("style", f"{current_style};fill:{INK}!important")
        else:
            text_elem.set("style", f"fill:{INK}")

# Re-serialize SVG and render PNG
modified_svg = ET.tostring(root, encoding="utf-8")
with open(f"plot-{THEME}.html", "wb") as f:
    f.write(modified_svg)

# Convert SVG to PNG using cairosvg
cairosvg.svg2png(bytestring=modified_svg, write_to=f"plot-{THEME}.png")
Runnable source as JSON, for any HTTP client: https://api.anyplot.ai/specs/scatter-annotated/pygal/code. Any spec id and library id listed in llms-full.txt fit the same URL shape; every URL below is complete and callable.
{
  "spec_id": "scatter-annotated",
  "language": "python",
  "library": "pygal",
  "page": "https://anyplot.ai/scatter-annotated/python/pygal",
  "hub": "https://anyplot.ai/scatter-annotated",
  "code_json": "https://api.anyplot.ai/specs/scatter-annotated/pygal/code",
  "spec_json": "https://api.anyplot.ai/specs/scatter-annotated",
  "render_light_png": "https://storage.googleapis.com/anyplot-images/plots/scatter-annotated/python/pygal/plot-light.png",
  "render_dark_png": "https://storage.googleapis.com/anyplot-images/plots/scatter-annotated/python/pygal/plot-dark.png",
  "interactive_light_html": "https://storage.googleapis.com/anyplot-images/plots/scatter-annotated/python/pygal/plot-light.html",
  "interactive_dark_html": "https://storage.googleapis.com/anyplot-images/plots/scatter-annotated/python/pygal/plot-dark.html",
  "quality_score": 81.0,
  "license": "MIT",
  "guide": "https://anyplot.ai/llms.txt"
}
Part of Annotated Scatter Plot with Text Labels on anyplot.ai.