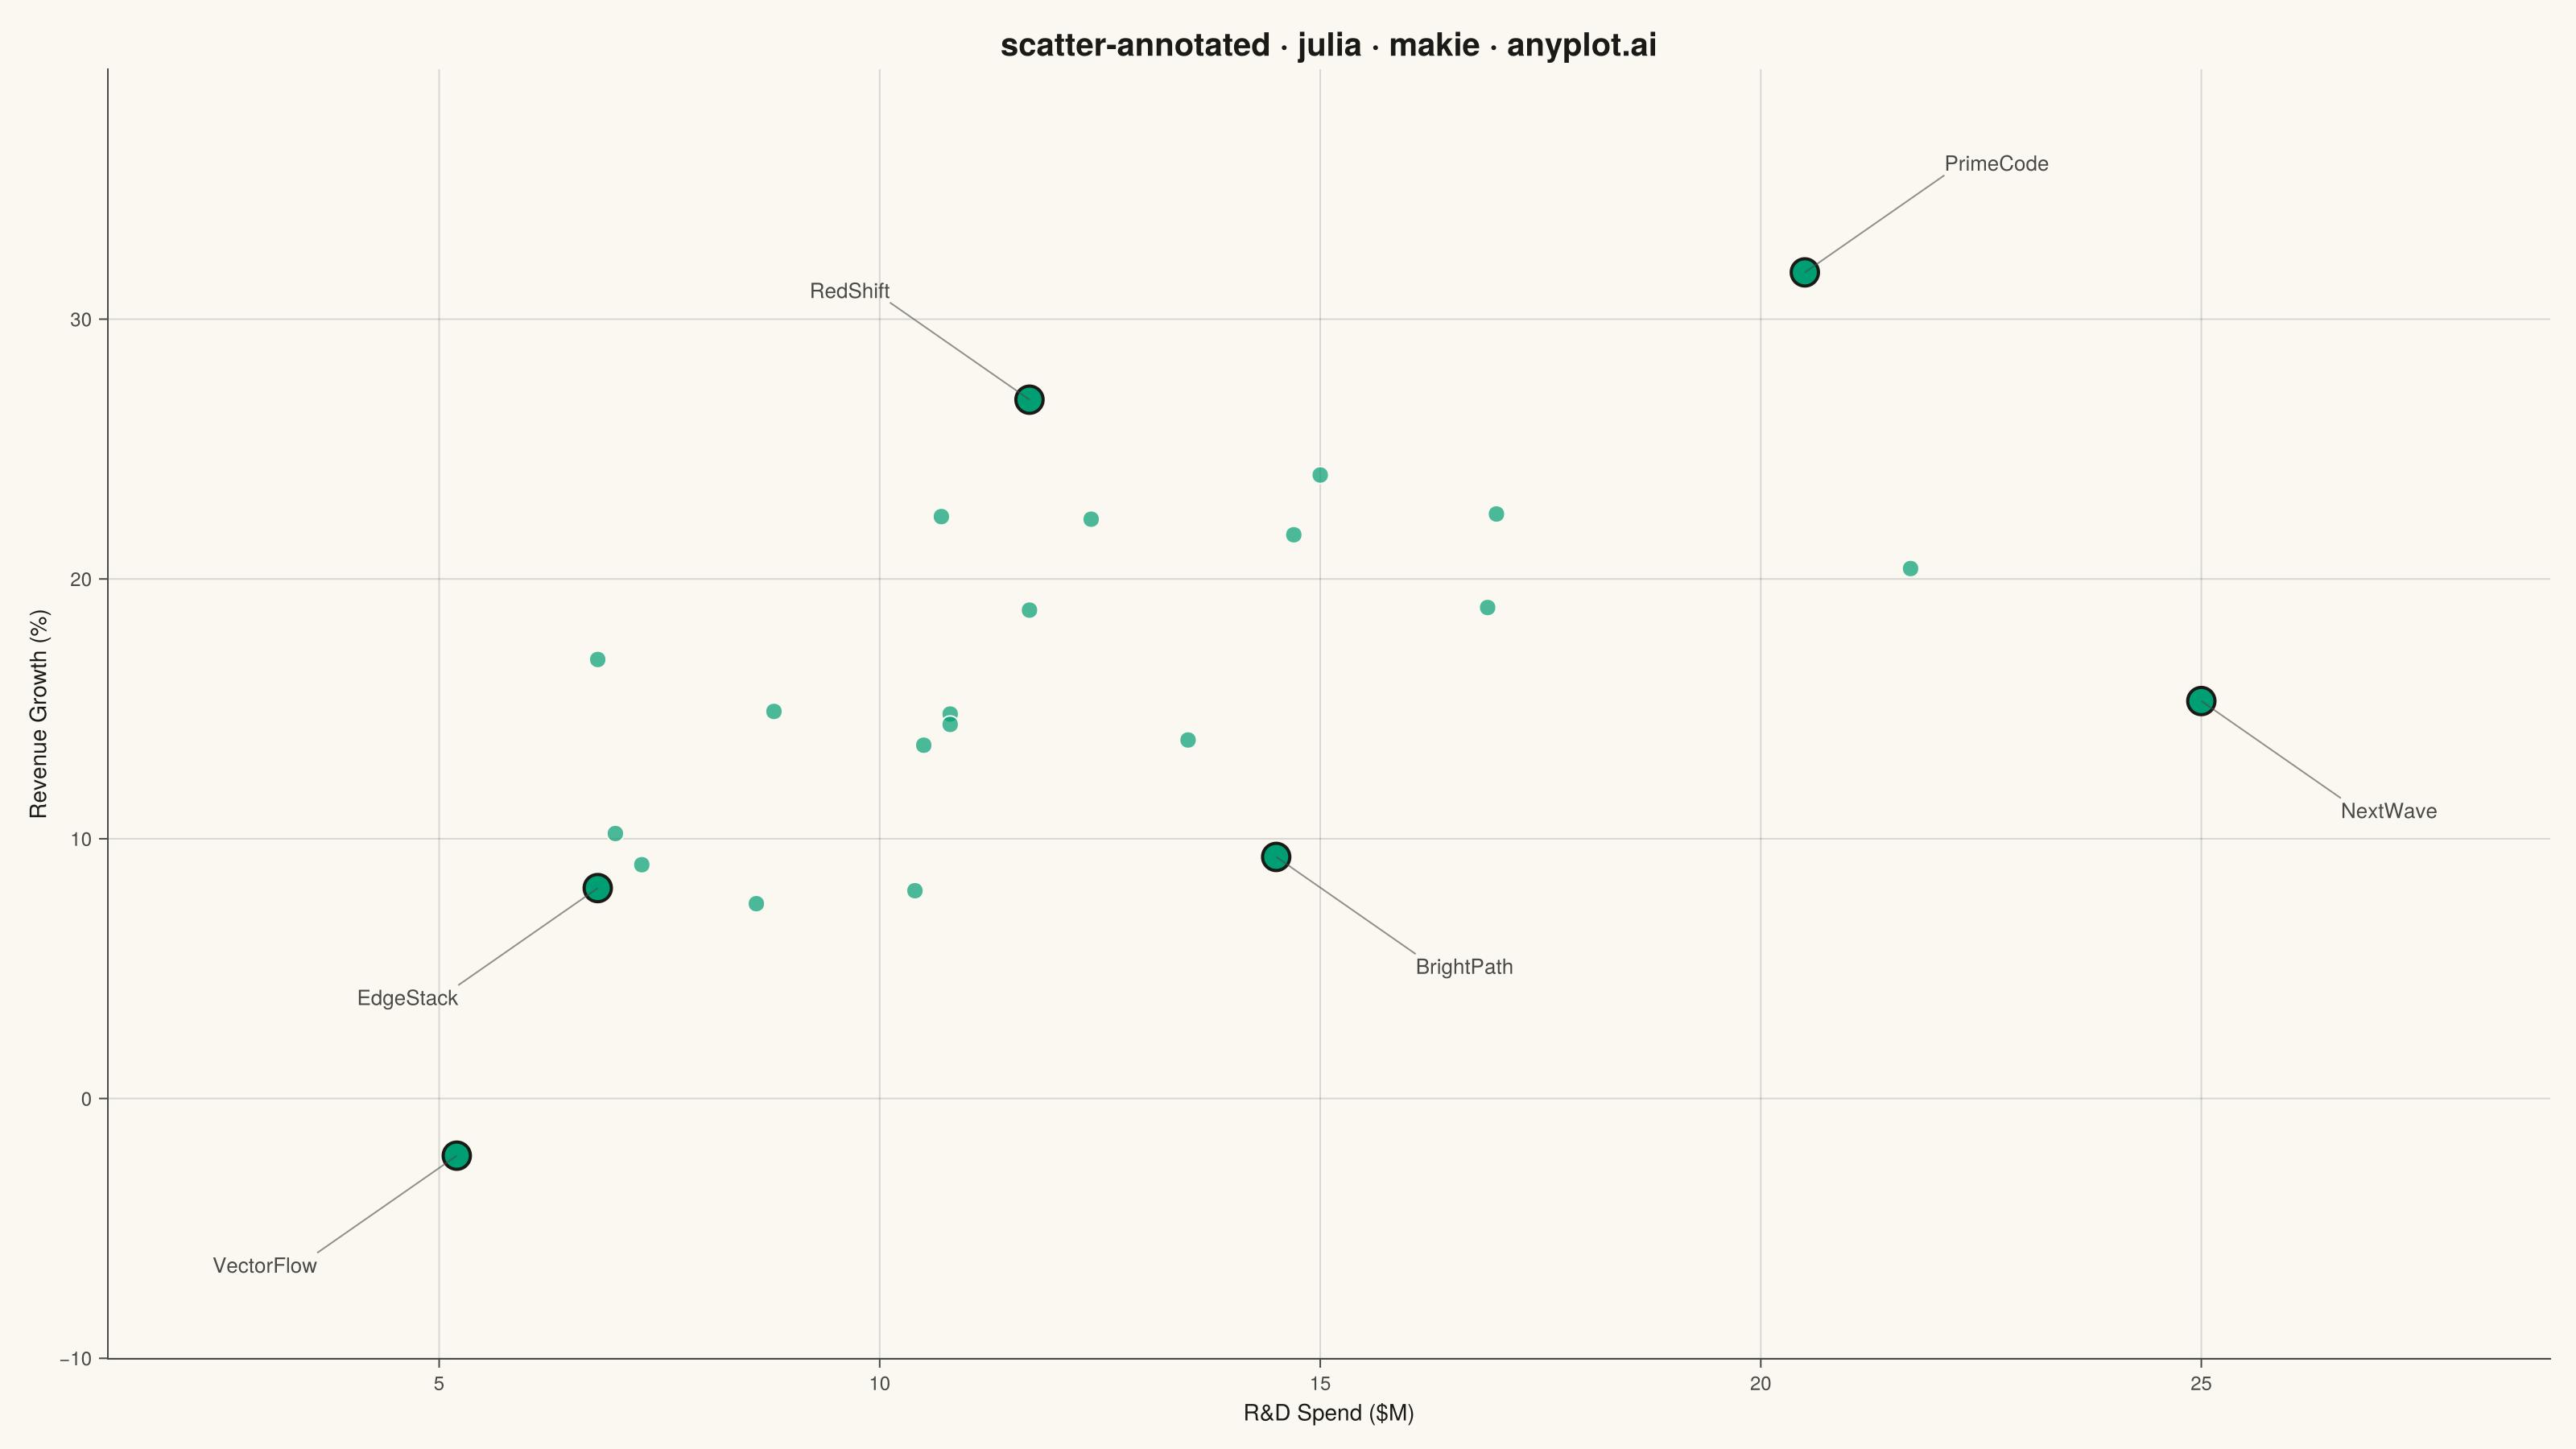
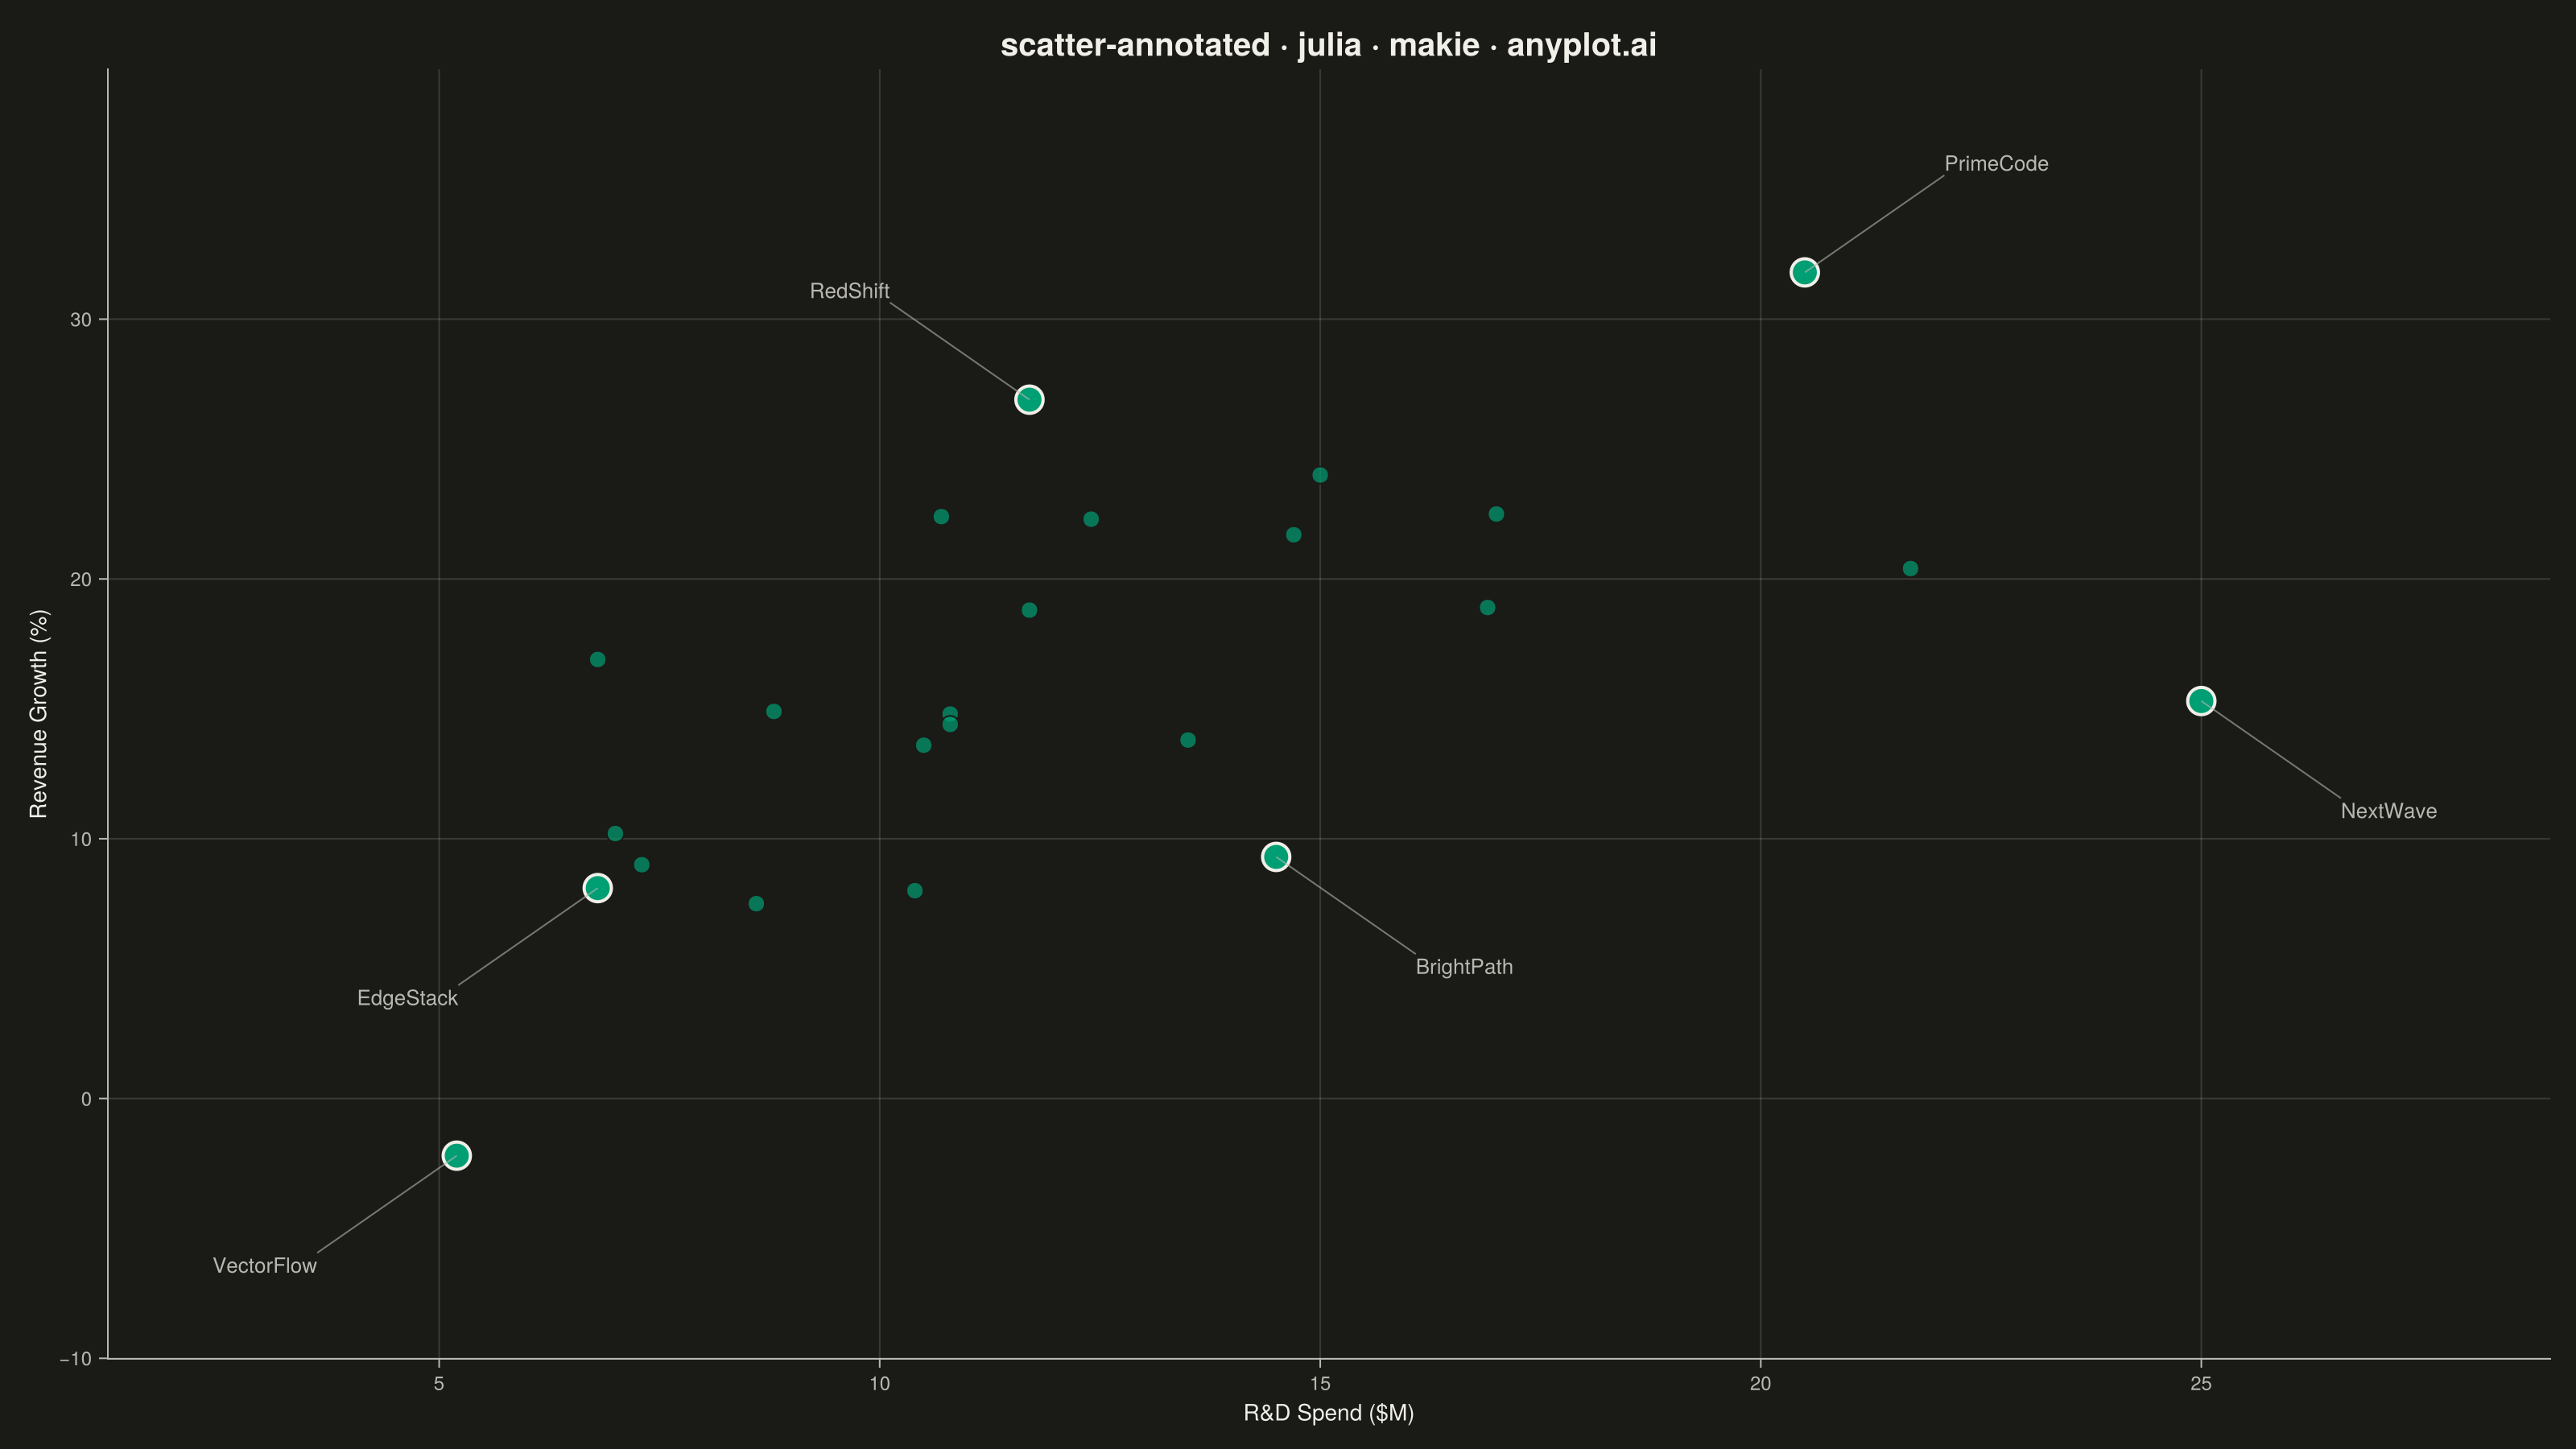
The same plot in 14 other libraries — Python: Altair, Bokeh, lets-plot, Matplotlib, Plotly, plotnine, Pygal, Seaborn; R: ggplot2; JavaScript: Chart.js, D3.js, Apache ECharts, Highcharts, MUI X Charts. Compare all 15 side by side: Annotated Scatter Plot with Text Labels in Python, R, Julia and JavaScript.
A scatter plot where each data point can have a text label annotation, useful for identifying specific points of interest. This visualization enhances basic scatter plots by adding contextual information directly on the chart, making it easy to highlight outliers, named entities, or key data points that deserve special attention.
# anyplot.ai
# scatter-annotated: Annotated Scatter Plot with Text Labels
# Library: makie 0.21.9 | Julia 1.11.9
# Quality: 88/100 | Created: 2026-09-05

using CairoMakie
using Colors
using Random
using Statistics

Random.seed!(42)

# --- Theme tokens -------------------------------------------------------
const THEME    = get(ENV, "ANYPLOT_THEME", "light")
const PAGE_BG  = THEME == "light" ? colorant"#FAF8F1" : colorant"#1A1A17"
const INK      = THEME == "light" ? colorant"#1A1A17" : colorant"#F0EFE8"
const INK_SOFT = THEME == "light" ? colorant"#4A4A44" : colorant"#B8B7B0"
const BRAND    = colorant"#009E73"  # Imprint palette position 1 — always first series

# --- Data -----------------------------------------------------------------
company_names = [
    "NovaSys", "ByteForge", "QuantumLeap", "DataWeave", "CloudPeak", "SwiftAI",
    "NeuralArc", "EdgeStack", "VectorFlow", "PixelCraft", "StreamLine", "CoreLogic",
    "BrightPath", "ZenithTech", "ApexData", "TrueNorth", "SilverBit", "GreenSpark",
    "BluePeak", "RedShift", "OrbitLabs", "FusionWorks", "PrimeCode", "NextWave",
]
n = length(company_names)

rd_spend = round.(exp.(randn(n) .* 0.4 .+ 2.5); digits=1)                 # R&D spend ($M)

# Log-normal spend naturally throws a far-right tail; cap the single biggest
# spender's gap above the rest to 20% of the remaining cluster's range so the
# outlier still reads as notable without stranding the right side of the canvas.
sorted_spend = sort(rd_spend)
gap_cap = 0.2 * (sorted_spend[end-1] - sorted_spend[1])
if maximum(rd_spend) - sorted_spend[end-1] > gap_cap
    rd_spend[argmax(rd_spend)] = round(sorted_spend[end-1] + gap_cap; digits=1)
end

revenue_growth = round.(0.9 .* rd_spend .+ randn(n) .* 6 .+ 5; digits=1)  # Revenue growth (%)

# Highlight a handful of notable points instead of labeling all 24: the
# biggest / leanest spenders, the top / bottom growers, and the two
# companies whose growth deviates most from the spend-growth trend. Some
# extremes coincide (e.g. the same company is both min-growth and
# min-spend), so backfill with the next-most-extreme distinct index until
# six distinct companies are highlighted.
trend_residual = revenue_growth .- 0.9 .* rd_spend
slot_rankings = [
    sortperm(revenue_growth; rev=true), sortperm(revenue_growth),
    sortperm(rd_spend; rev=true), sortperm(rd_spend),
    sortperm(trend_residual; rev=true), sortperm(trend_residual),
]
labeled_idx = Int[]
for ranking in slot_rankings
    for idx in ranking
        if idx ∉ labeled_idx
            push!(labeled_idx, idx)
            break
        end
    end
end

cx, cy = mean(rd_spend), mean(revenue_growth)
x_range = maximum(rd_spend) - minimum(rd_spend)
y_range = maximum(revenue_growth) - minimum(revenue_growth)

# Precompute each label's offset position (and alignment) once so the same
# values drive both the axis-limit padding below and the draw loop later —
# a label landing outside the axis's auto-computed data range would
# otherwise get silently clipped by the axis viewport.
label_dx    = [(rd_spend[i] >= cx ? 1 : -1) * 0.08 * x_range for i in labeled_idx]
label_dy    = [(revenue_growth[i] >= cy ? 1 : -1) * 0.11 * y_range for i in labeled_idx]

# Two highlighted points can sit close together in data space and fall on
# the same side of the centroid on both axes, sending their label anchors
# in the same direction by a near-identical amount -- close enough for one
# anchor to land on top of the other (or on top of the marker cluster
# itself) and read as a missing label. Detect any such close, same-
# quadrant pair and push the later point's offset out farther so its
# anchor clears the first instead of coinciding with it.
for k in eachindex(labeled_idx), j in 1:(k - 1)
    same_quadrant = sign(label_dx[j]) == sign(label_dx[k]) && sign(label_dy[j]) == sign(label_dy[k])
    i_j, i_k = labeled_idx[j], labeled_idx[k]
    nearby = hypot((rd_spend[i_j] - rd_spend[i_k]) / x_range, (revenue_growth[i_j] - revenue_growth[i_k]) / y_range) < 0.15
    if same_quadrant && nearby
        label_dx[k] *= 1.8
        label_dy[k] *= 1.8
    end
end

label_x     = [rd_spend[labeled_idx[k]] + label_dx[k] for k in eachindex(labeled_idx)]
label_y     = [revenue_growth[labeled_idx[k]] + label_dy[k] for k in eachindex(labeled_idx)]

# Pad well beyond the label anchors themselves (not just the data range) to
# leave room for the rendered text glyphs and the connector lines.
x_pad = 0.12 * x_range
y_pad = 0.12 * y_range
x_lo, x_hi = min(minimum(rd_spend), minimum(label_x)) - x_pad, max(maximum(rd_spend), maximum(label_x)) + x_pad
y_lo, y_hi = min(minimum(revenue_growth), minimum(label_y)) - y_pad, max(maximum(revenue_growth), maximum(label_y)) + y_pad

# --- Plot -------------------------------------------------------------------
fig = Figure(
    resolution      = (1600, 900),
    fontsize        = 14,
    backgroundcolor = PAGE_BG,
)

ax = Axis(
    fig[1, 1];
    title             = "scatter-annotated · julia · makie · anyplot.ai",
    titlesize         = 20,
    titlecolor        = INK,
    xlabel            = "R&D Spend (\$M)",
    ylabel            = "Revenue Growth (%)",
    xlabelsize        = 14,
    ylabelsize        = 14,
    xlabelcolor       = INK,
    ylabelcolor       = INK,
    xticklabelsize    = 12,
    yticklabelsize    = 12,
    xticklabelcolor   = INK_SOFT,
    yticklabelcolor   = INK_SOFT,
    xtickcolor        = INK_SOFT,
    ytickcolor        = INK_SOFT,
    backgroundcolor   = PAGE_BG,
    topspinevisible   = false,
    rightspinevisible = false,
    leftspinecolor    = INK_SOFT,
    bottomspinecolor  = INK_SOFT,
    xgridcolor        = RGBAf(INK.r, INK.g, INK.b, 0.15),
    ygridcolor        = RGBAf(INK.r, INK.g, INK.b, 0.15),
)

unlabeled_idx = setdiff(1:n, labeled_idx)
scatter!(ax, rd_spend[unlabeled_idx], revenue_growth[unlabeled_idx];
    color = BRAND, alpha = 0.7, markersize = 15, strokewidth = 1, strokecolor = PAGE_BG)

# Highlighted points get a larger, fully-opaque marker with a dark ring so
# the labeled subset reads as an unambiguous focal point — the ring makes
# the distinction independent of alpha-blending, which is easy to lose in
# a saved raster next to the merely-translucent unlabeled markers.
scatter!(ax, rd_spend[labeled_idx], revenue_growth[labeled_idx];
    color = BRAND, alpha = 1.0, markersize = 24, strokewidth = 2, strokecolor = INK)

# Explicit limits, padded to fit every label anchor computed above, so an
# offset label can never fall outside the axis viewport and get clipped.
xlims!(ax, x_lo, x_hi)
ylims!(ax, y_lo, y_hi)

# Push each label away from the data centroid so it lands in open space,
# with a thin connector line back to its point.
for k in eachindex(labeled_idx)
    i = labeled_idx[k]
    lx, ly = label_x[k], label_y[k]
    halign = label_dx[k] >= 0 ? :left : :right
    valign = label_dy[k] >= 0 ? :bottom : :top

    lines!(ax, [rd_spend[i], lx], [revenue_growth[i], ly];
        color = INK_SOFT, linewidth = 1, alpha = 0.6)
    text!(ax, lx, ly; text = company_names[i], align = (halign, valign),
        fontsize = 13, color = INK_SOFT)
end

# --- Save -------------------------------------------------------------------
save("plot-$(THEME).png", fig; px_per_unit = 2)
Runnable source as JSON, for any HTTP client: https://api.anyplot.ai/specs/scatter-annotated/makie/code. Any spec id and library id listed in llms-full.txt fit the same URL shape; every URL below is complete and callable.
{
  "spec_id": "scatter-annotated",
  "language": "julia",
  "library": "makie",
  "page": "https://anyplot.ai/scatter-annotated/julia/makie",
  "hub": "https://anyplot.ai/scatter-annotated",
  "code_json": "https://api.anyplot.ai/specs/scatter-annotated/makie/code",
  "spec_json": "https://api.anyplot.ai/specs/scatter-annotated",
  "render_light_png": "https://storage.googleapis.com/anyplot-images/plots/scatter-annotated/julia/makie/plot-light.png",
  "render_dark_png": "https://storage.googleapis.com/anyplot-images/plots/scatter-annotated/julia/makie/plot-dark.png",
  "quality_score": 88.0,
  "license": "MIT",
  "guide": "https://anyplot.ai/llms.txt"
}
Part of Annotated Scatter Plot with Text Labels on anyplot.ai.