The same plot in 14 other libraries — Python: Altair, Bokeh, lets-plot, Matplotlib, Plotly, plotnine, Pygal, Seaborn; Julia: Makie.jl; JavaScript: Chart.js, D3.js, Apache ECharts, Highcharts, MUI X Charts. Compare all 15 side by side: Annotated Scatter Plot with Text Labels in Python, R, Julia and JavaScript.
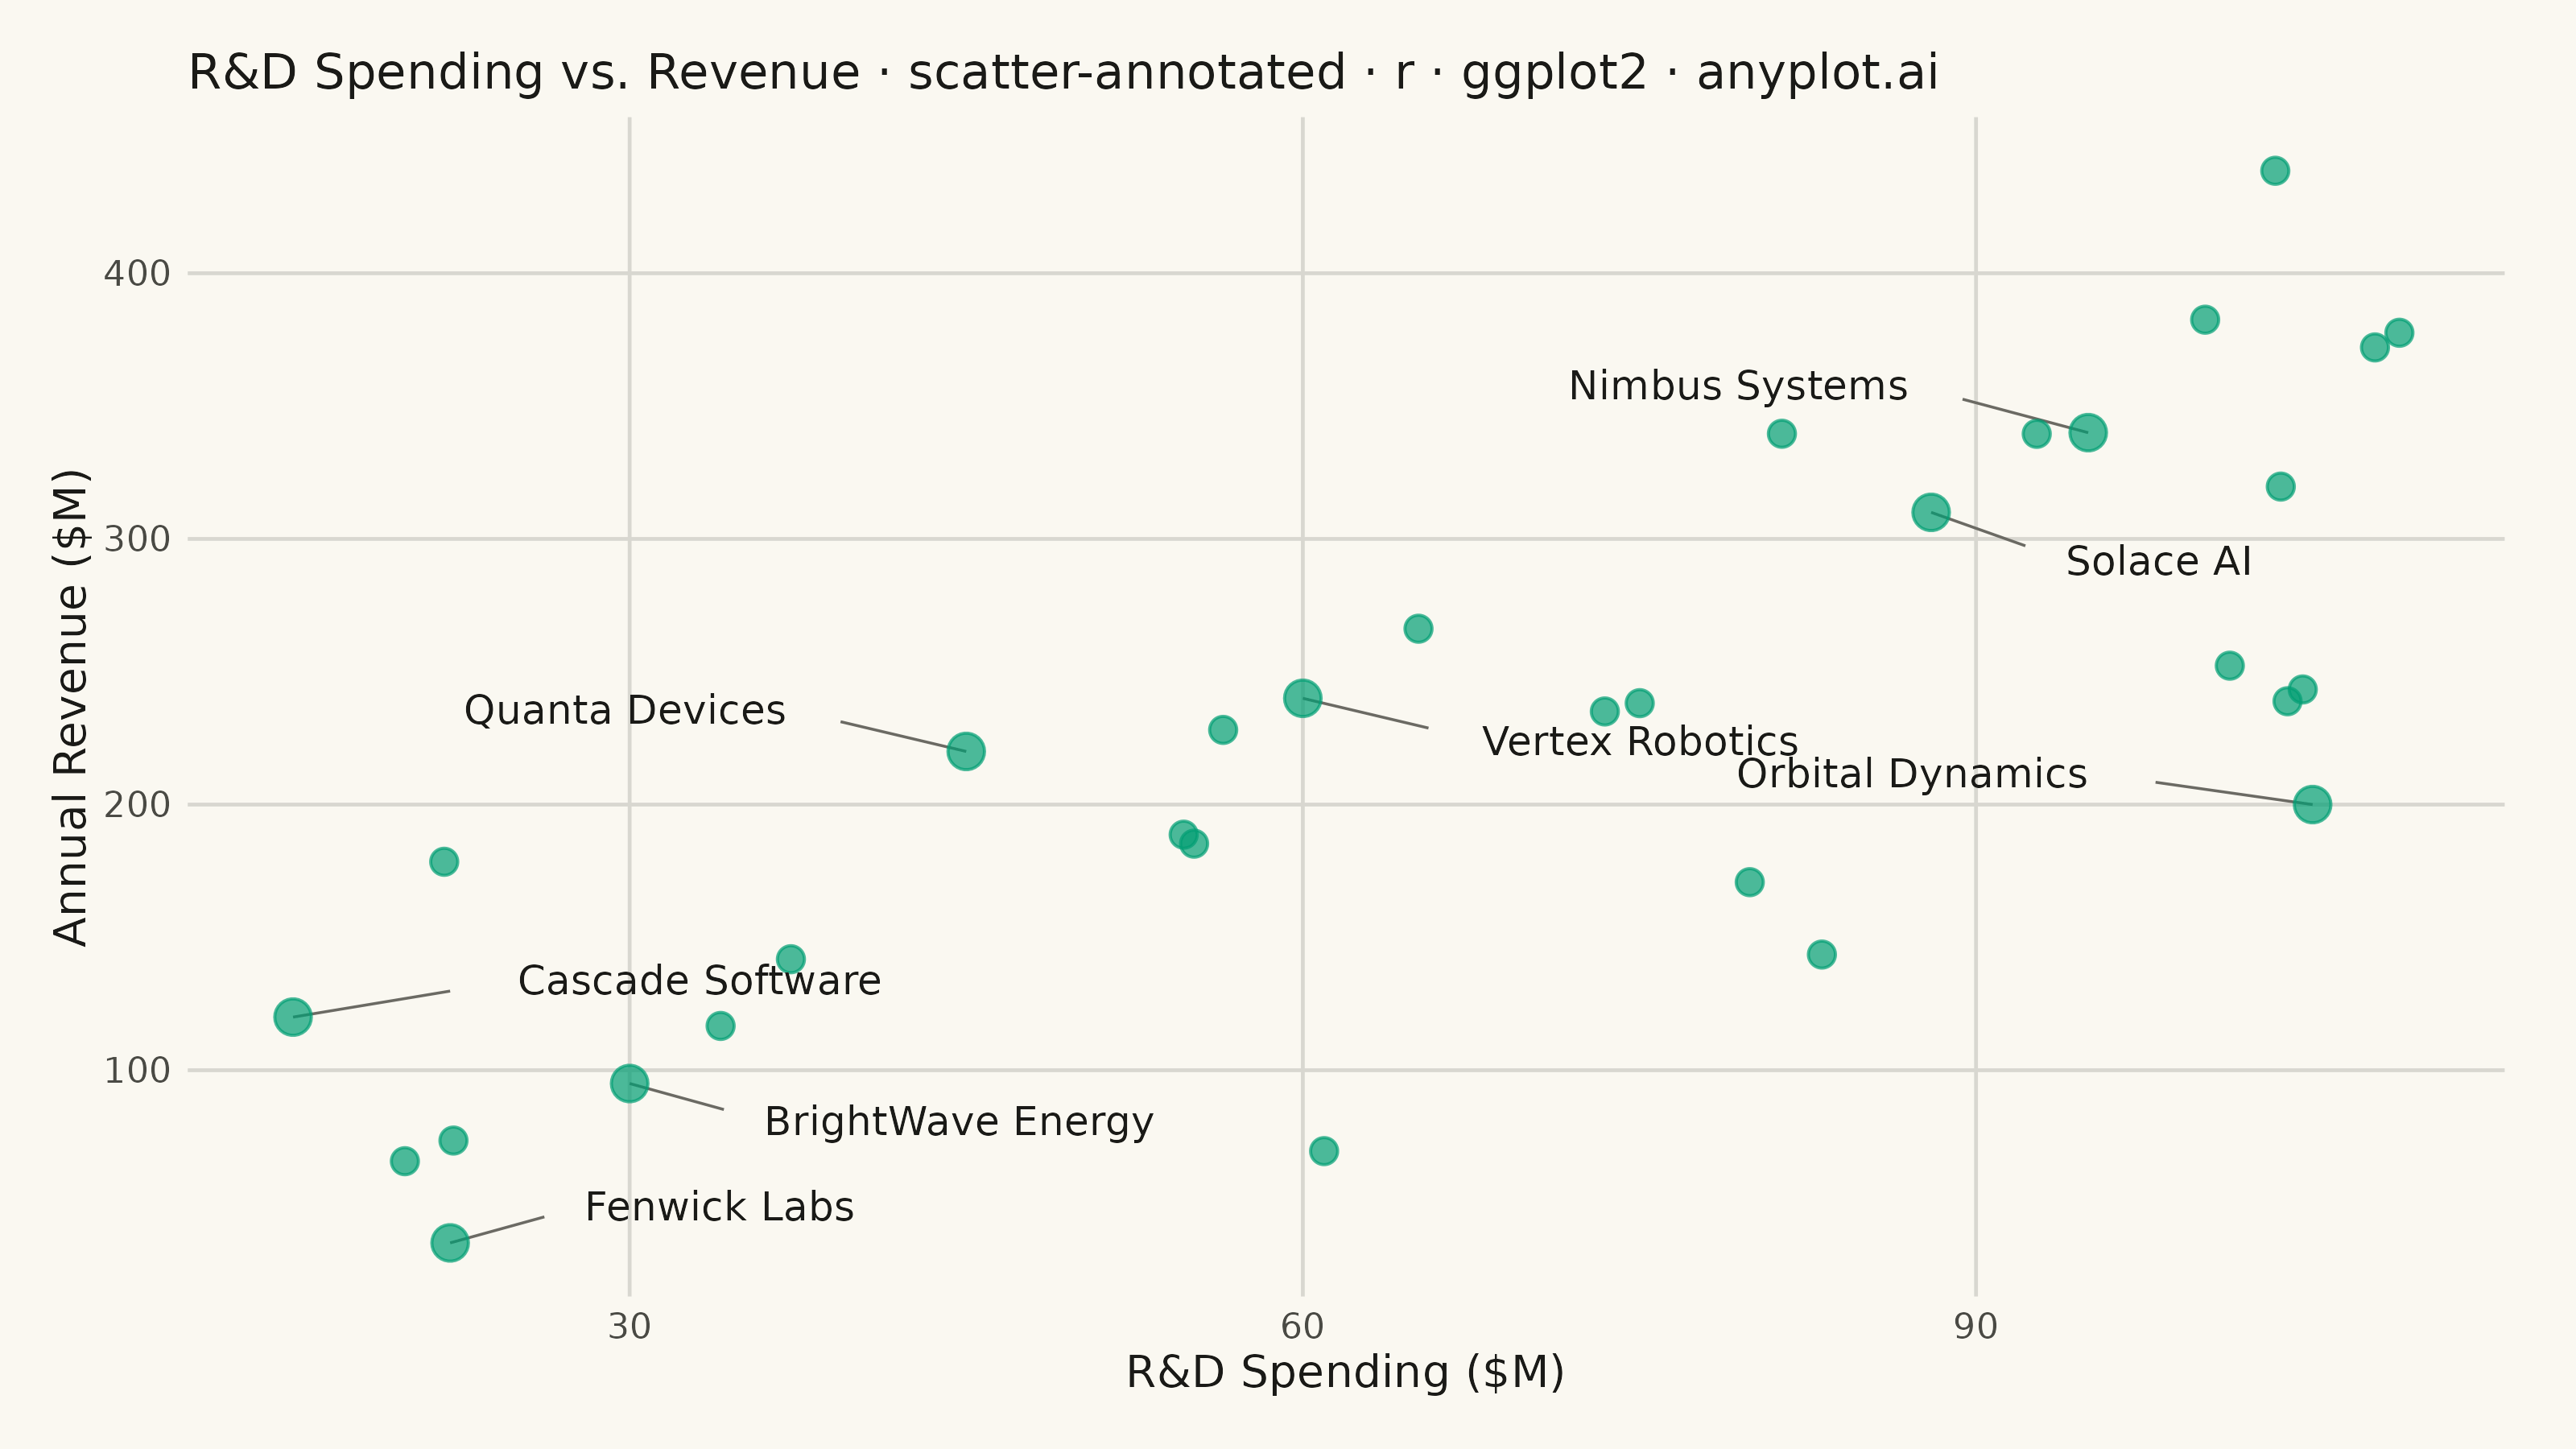
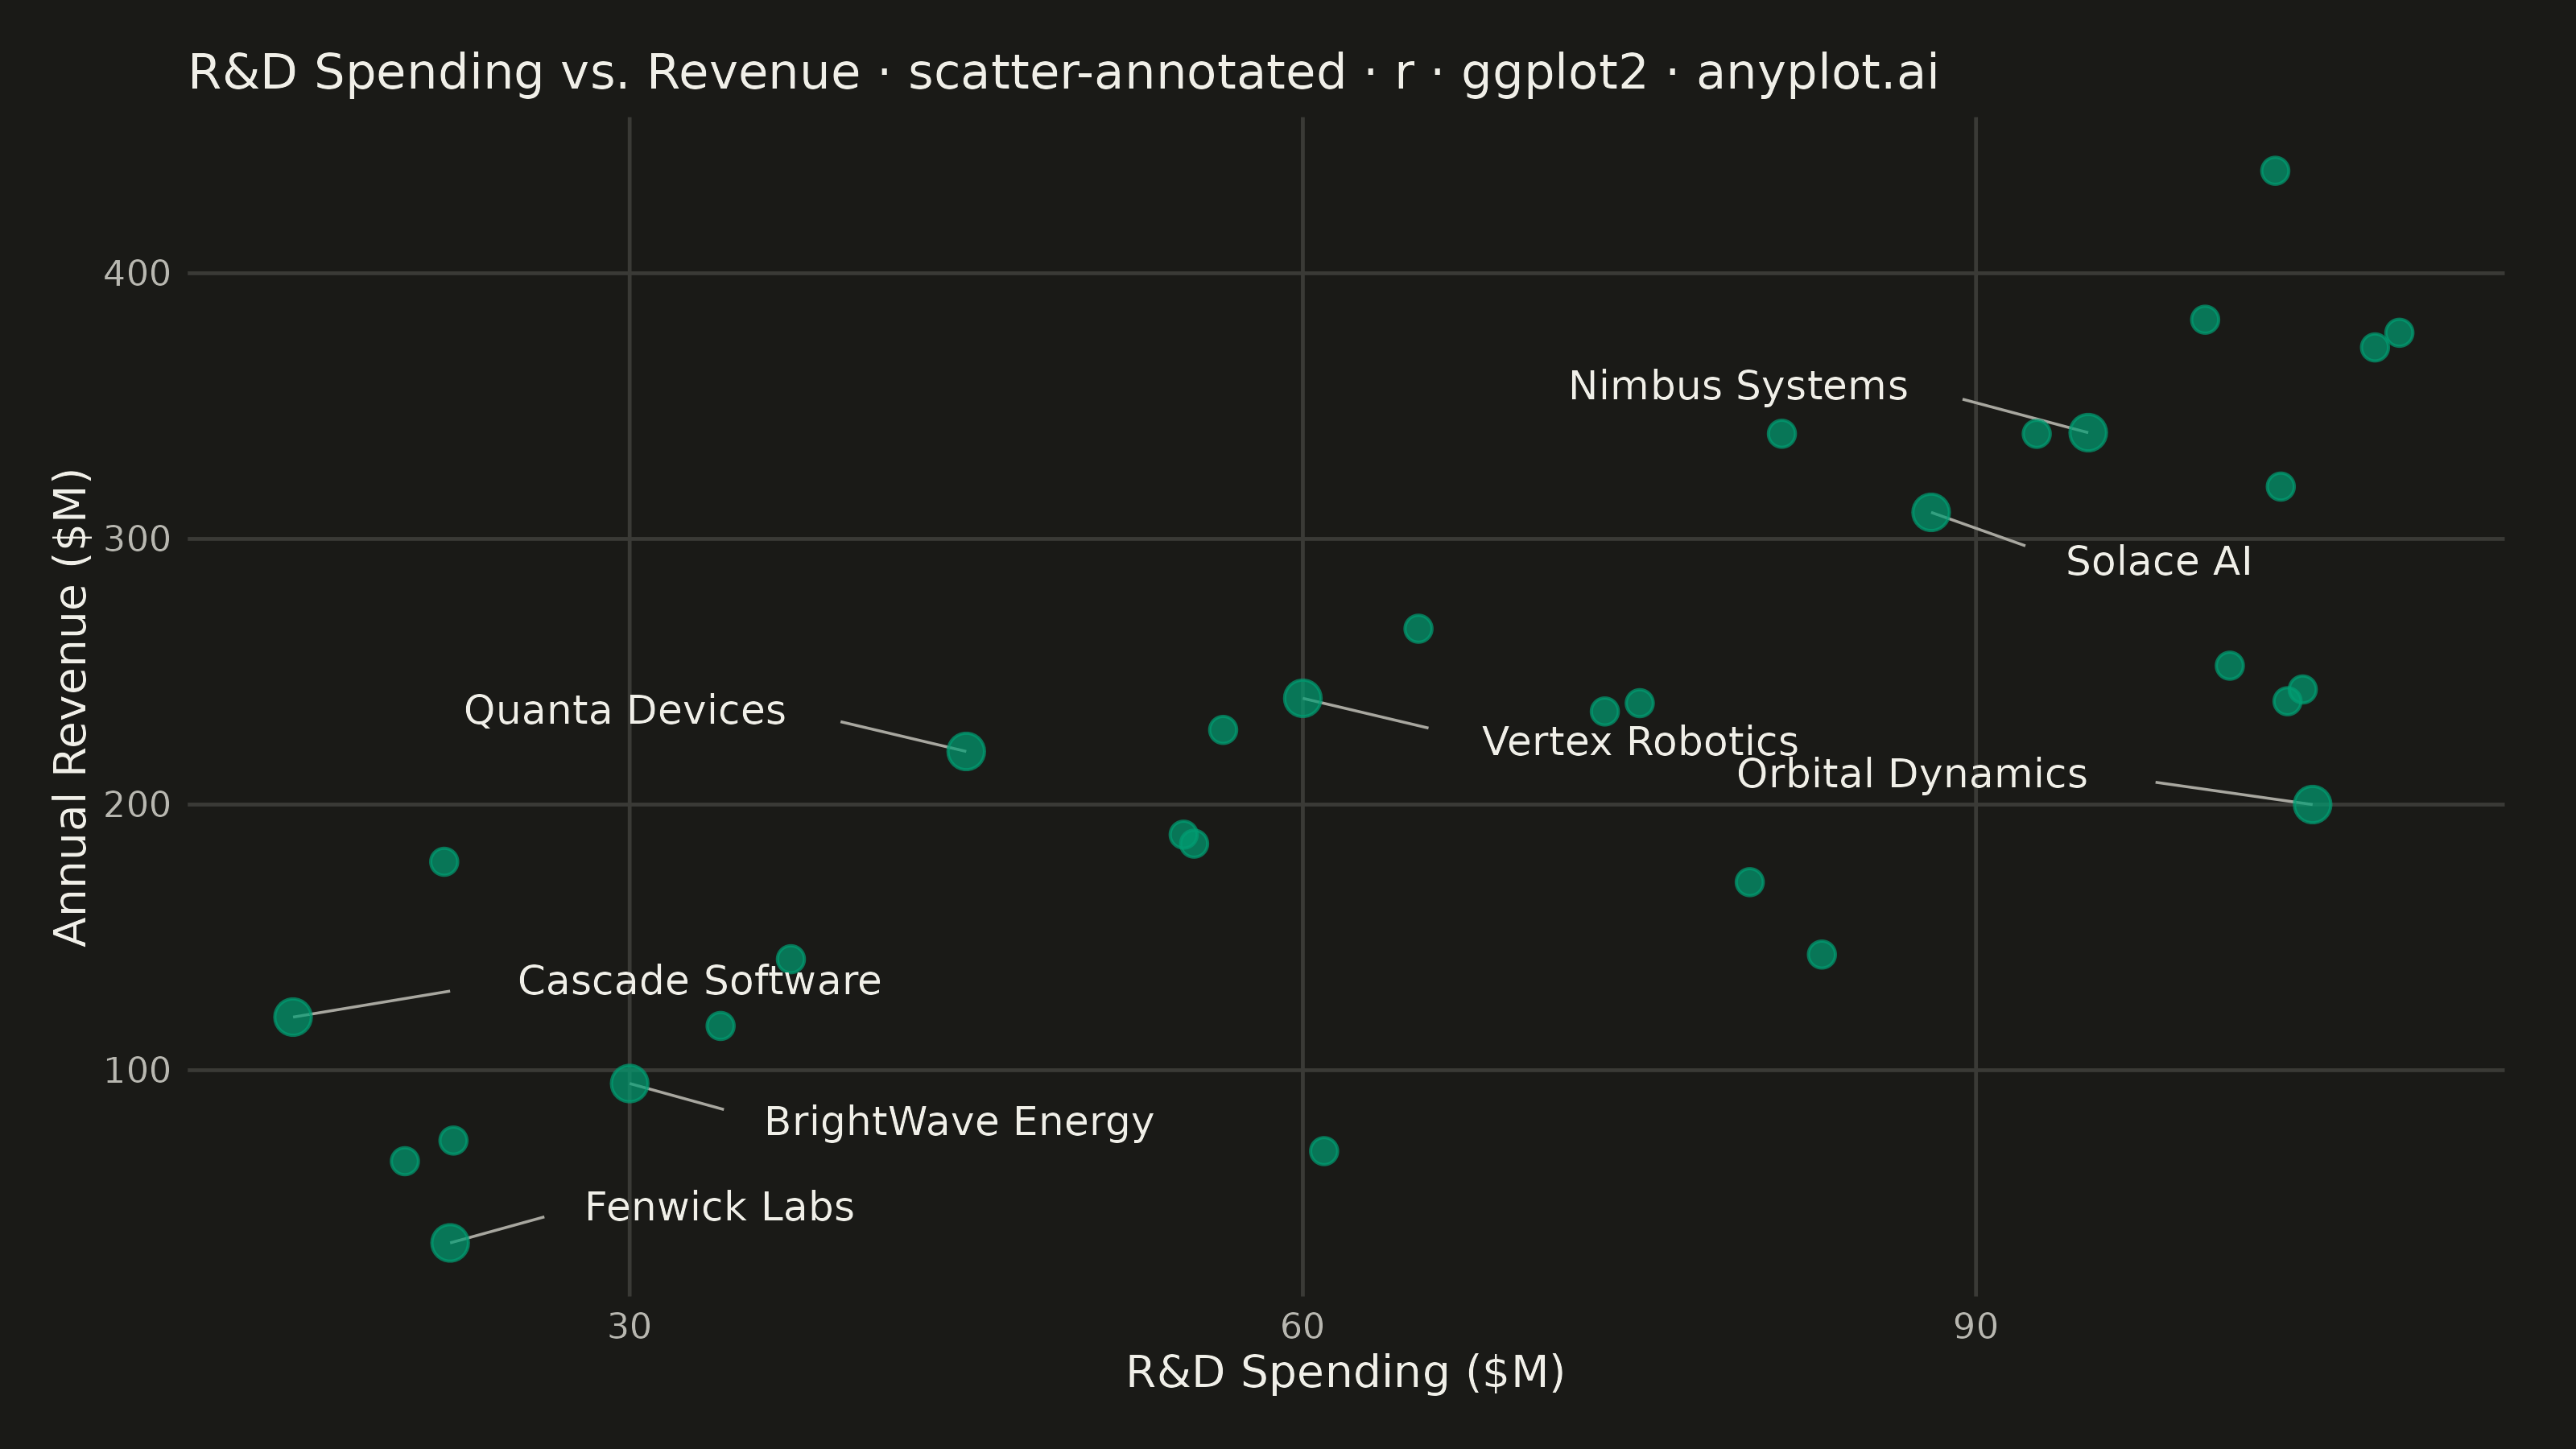
A scatter plot where each data point can have a text label annotation, useful for identifying specific points of interest. This visualization enhances basic scatter plots by adding contextual information directly on the chart, making it easy to highlight outliers, named entities, or key data points that deserve special attention.
#' anyplot.ai
#' scatter-annotated: Annotated Scatter Plot with Text Labels
#' Library: ggplot2 3.5.1 | R 4.4.1
#' Quality: 91/100 | Created: 2026-09-05

library(ggplot2)
library(dplyr)
library(ragg)

set.seed(42)

# --- Theme tokens ------------------------------------------------------------
THEME     <- Sys.getenv("ANYPLOT_THEME", "light")
PAGE_BG   <- if (THEME == "light") "#FAF8F1" else "#1A1A17"
INK       <- if (THEME == "light") "#1A1A17" else "#F0EFE8"
INK_SOFT  <- if (THEME == "light") "#4A4A44" else "#B8B7B0"
INK_MUTED <- if (THEME == "light") "#6B6A63" else "#A8A79F"
GRID      <- if (THEME == "light") "#D8D7D0" else "#3A3A36"  # ~15% INK over PAGE_BG
BRAND     <- "#009E73"  # Imprint palette position 1 — always first series

# --- Data ---------------------------------------------------------------------
# Background cloud: R&D spending vs. revenue for unnamed tech companies
n_background <- 24
rd_spend_bg  <- runif(n_background, 8, 110)
revenue_bg   <- 2.8 * rd_spend_bg + 45 + rnorm(n_background, 0, 55)

background <- tibble(
  rd_spend = rd_spend_bg,
  revenue  = revenue_bg,
  label    = NA_character_,
  nudge_x  = 0,
  nudge_y  = 0
)

# Named companies worth calling out: leaders, an efficient outlier, laggards
companies <- tibble(
  rd_spend = c(95, 88, 15, 22, 60, 45, 105, 30),
  revenue  = c(340, 310, 120, 35, 240, 220, 200, 95),
  label    = c(
    "Nimbus Systems", "Solace AI", "Cascade Software", "Fenwick Labs",
    "Vertex Robotics", "Quanta Devices", "Orbital Dynamics", "BrightWave Energy"
  ),
  nudge_x  = c(-8, 6, 10, 6, 8, -8, -10, 6),
  nudge_y  = c(18, -18, 14, 14, -16, 16, 12, -14)
)

points <- bind_rows(background, companies) %>%
  mutate(is_named = !is.na(label))

# --- Plot -----------------------------------------------------------------
title_text <- "R&D Spending vs. Revenue · scatter-annotated · r · ggplot2 · anyplot.ai"

p <- ggplot(points, aes(x = rd_spend, y = revenue)) +
  geom_segment(
    data = companies,
    aes(x = rd_spend, y = revenue,
        xend = rd_spend + nudge_x * 0.7, yend = revenue + nudge_y * 0.7),
    color = INK_MUTED, linewidth = 0.3
  ) +
  geom_point(aes(size = is_named), color = BRAND, alpha = 0.7) +
  geom_text(
    data = companies,
    aes(x = rd_spend + nudge_x, y = revenue + nudge_y, label = label,
        hjust = ifelse(nudge_x > 0, 0, 1)),
    color = INK, size = 3.2, fontface = "plain"
  ) +
  scale_size_manual(values = c(`FALSE` = 2.5, `TRUE` = 3.5), guide = "none") +
  labs(x = "R&D Spending ($M)", y = "Annual Revenue ($M)", title = title_text) +
  theme_minimal(base_size = 8) +
  theme(
    plot.background   = element_rect(fill = PAGE_BG, color = PAGE_BG),
    panel.background  = element_rect(fill = PAGE_BG, color = NA),
    panel.grid.major  = element_line(color = GRID, linewidth = 0.4),
    panel.grid.minor  = element_blank(),
    axis.title        = element_text(color = INK, size = 10),
    axis.text         = element_text(color = INK_SOFT, size = 8),
    axis.ticks        = element_blank(),
    plot.title        = element_text(color = INK, size = 11),
    plot.margin       = margin(12, 16, 12, 12)
  )

# --- Save -------------------------------------------------------------------
ggsave(
  filename = sprintf("plot-%s.png", THEME),
  plot     = p,
  device   = ragg::agg_png,
  width    = 8,
  height   = 4.5,
  units    = "in",
  dpi      = 400
)
Runnable source as JSON, for any HTTP client: https://api.anyplot.ai/specs/scatter-annotated/ggplot2/code. Any spec id and library id listed in llms-full.txt fit the same URL shape; every URL below is complete and callable.
{
  "spec_id": "scatter-annotated",
  "language": "r",
  "library": "ggplot2",
  "page": "https://anyplot.ai/scatter-annotated/r/ggplot2",
  "hub": "https://anyplot.ai/scatter-annotated",
  "code_json": "https://api.anyplot.ai/specs/scatter-annotated/ggplot2/code",
  "spec_json": "https://api.anyplot.ai/specs/scatter-annotated",
  "render_light_png": "https://storage.googleapis.com/anyplot-images/plots/scatter-annotated/r/ggplot2/plot-light.png",
  "render_dark_png": "https://storage.googleapis.com/anyplot-images/plots/scatter-annotated/r/ggplot2/plot-dark.png",
  "quality_score": 91.0,
  "license": "MIT",
  "guide": "https://anyplot.ai/llms.txt"
}
Part of Annotated Scatter Plot with Text Labels on anyplot.ai.