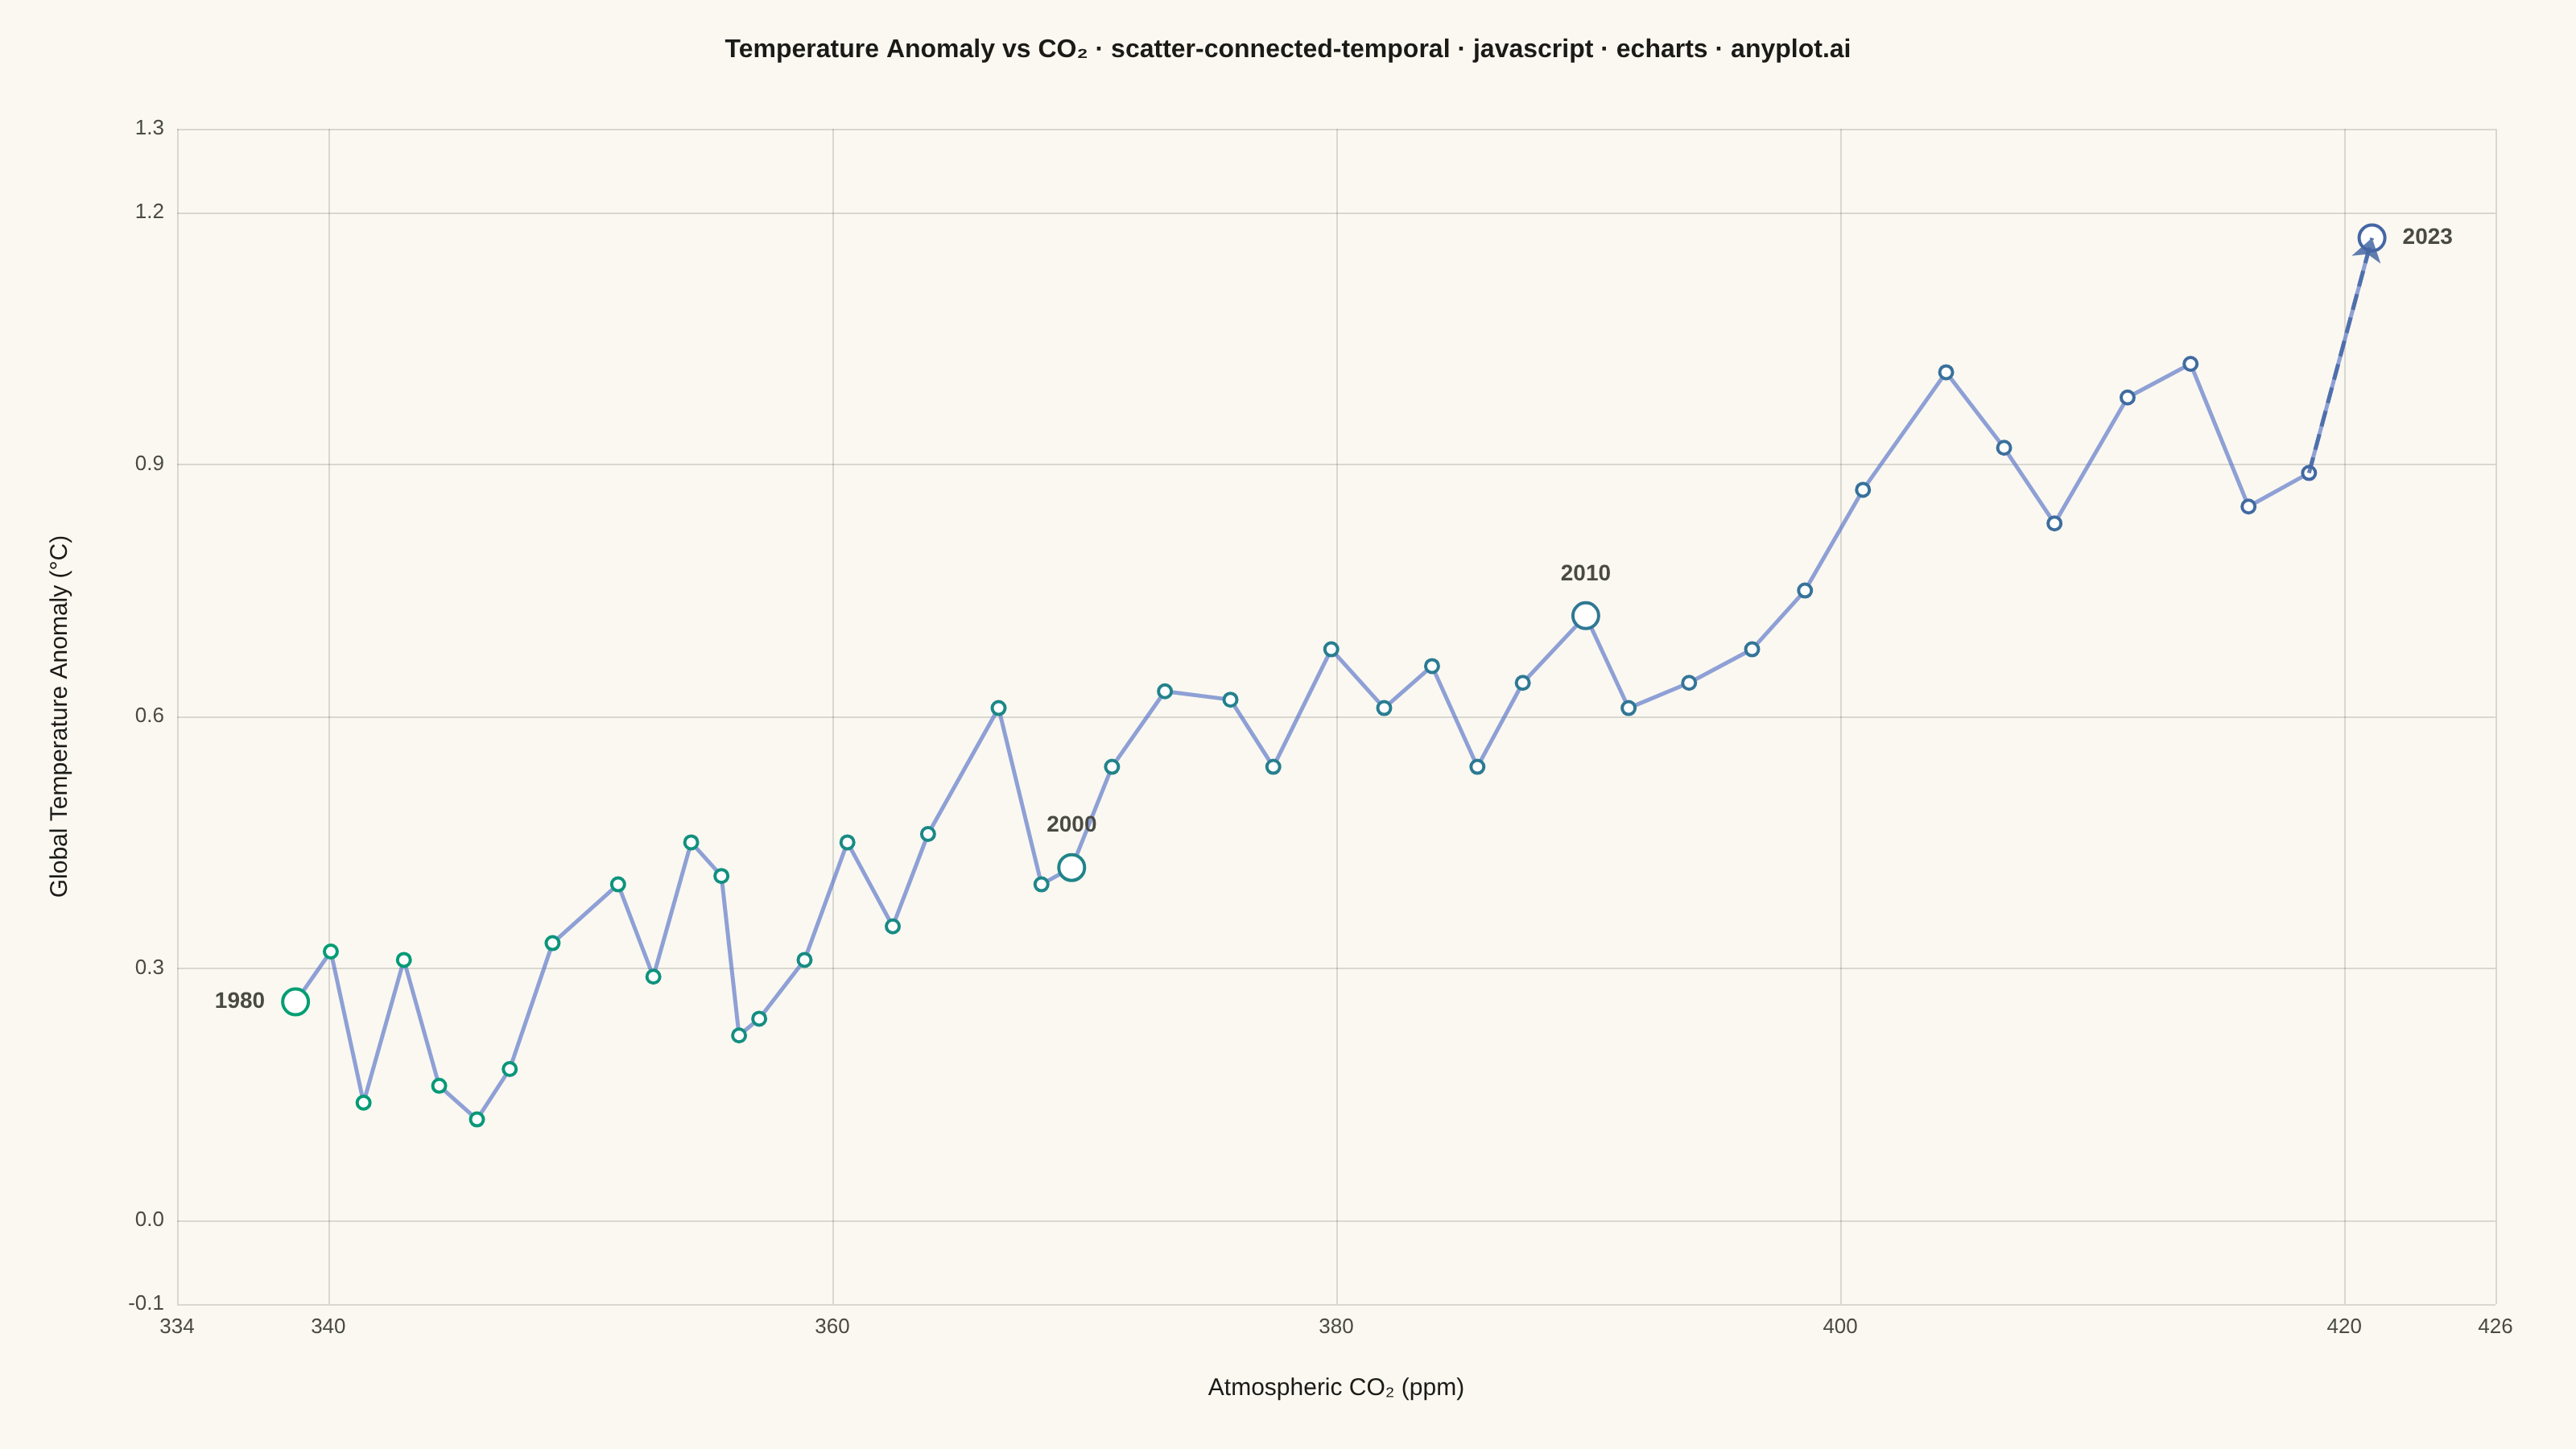
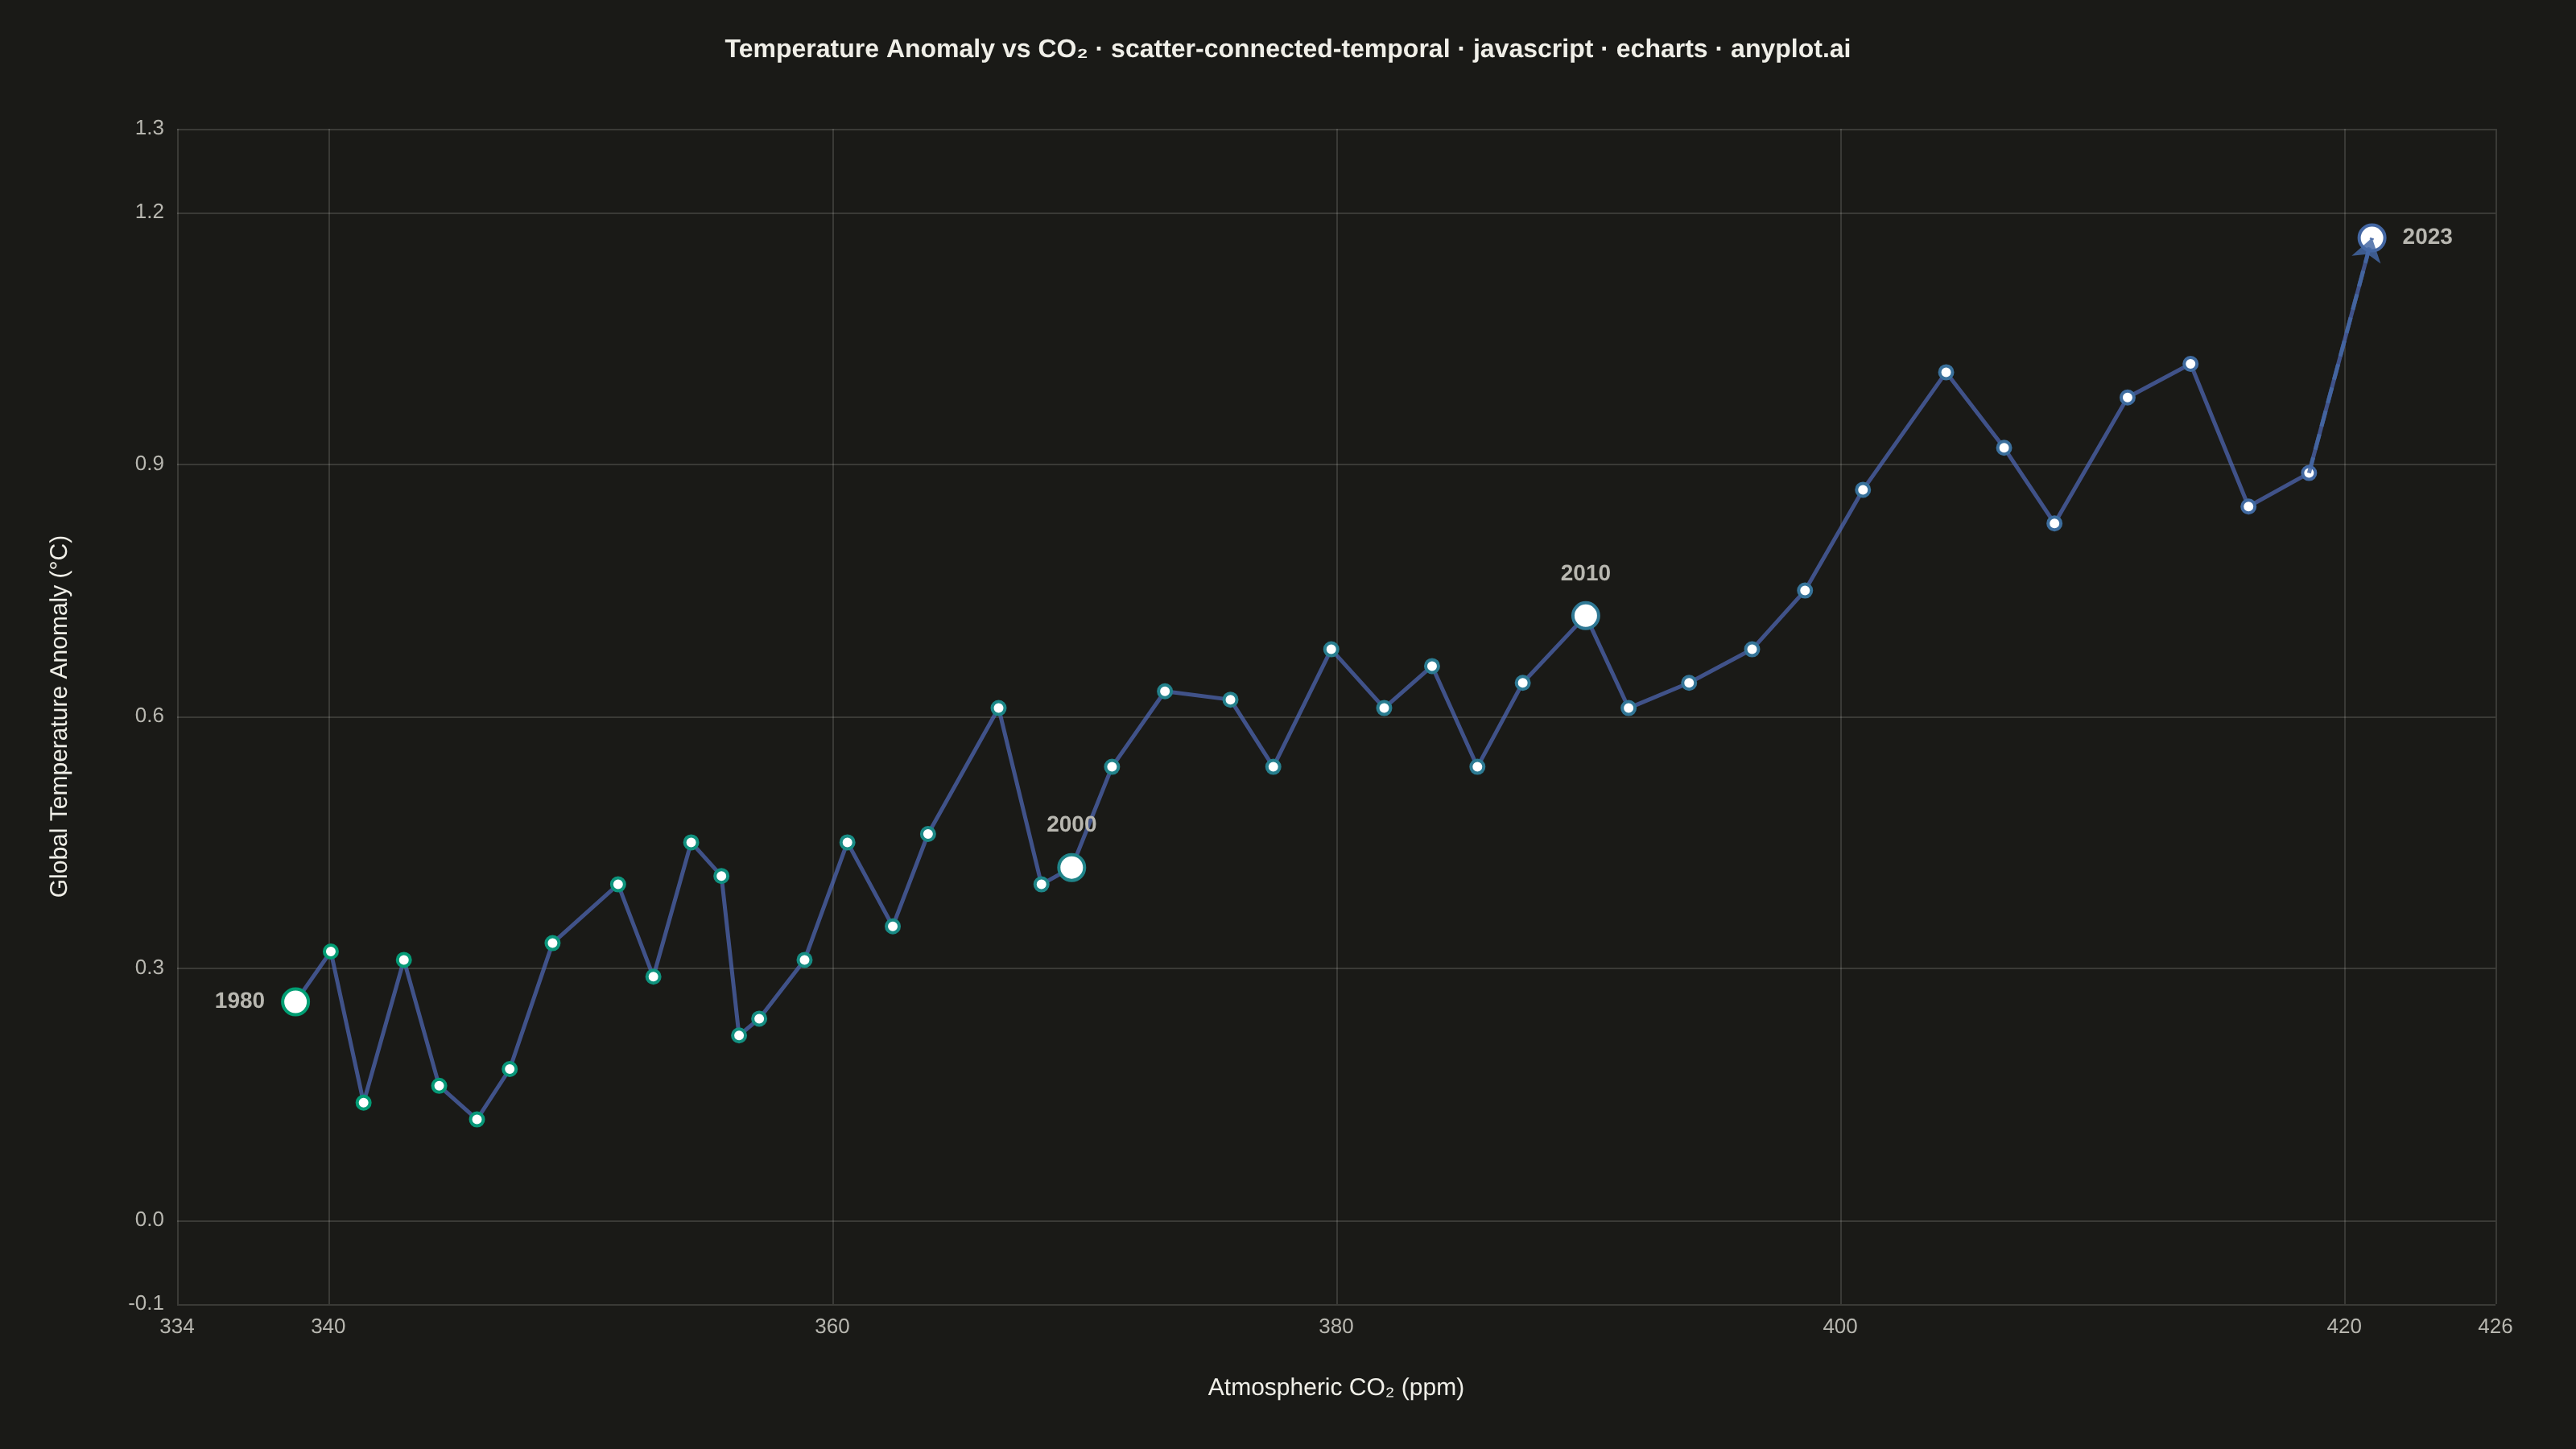
A scatter plot where data points are connected by lines in temporal order, revealing how two variables co-evolve over time. Unlike standard time series plots that show one variable against time, this plot encodes time as movement through 2D space, making cyclical patterns, regime changes, and directional trends visible. Popularized by the New York Times, it is a powerful tool for narrative data visualization.
Preview render from the Apache ECharts implementation.