The same plot in 14 other libraries — JavaScript: Chart.js, D3.js, Apache ECharts, Highcharts; Python: Altair, Bokeh, lets-plot, Matplotlib, Plotly, plotnine, Pygal, Seaborn; R: ggplot2; Julia: Makie.jl. Compare all 15 side by side: Connected Scatter Plot with Temporal Path in Python, R, Julia and JavaScript.
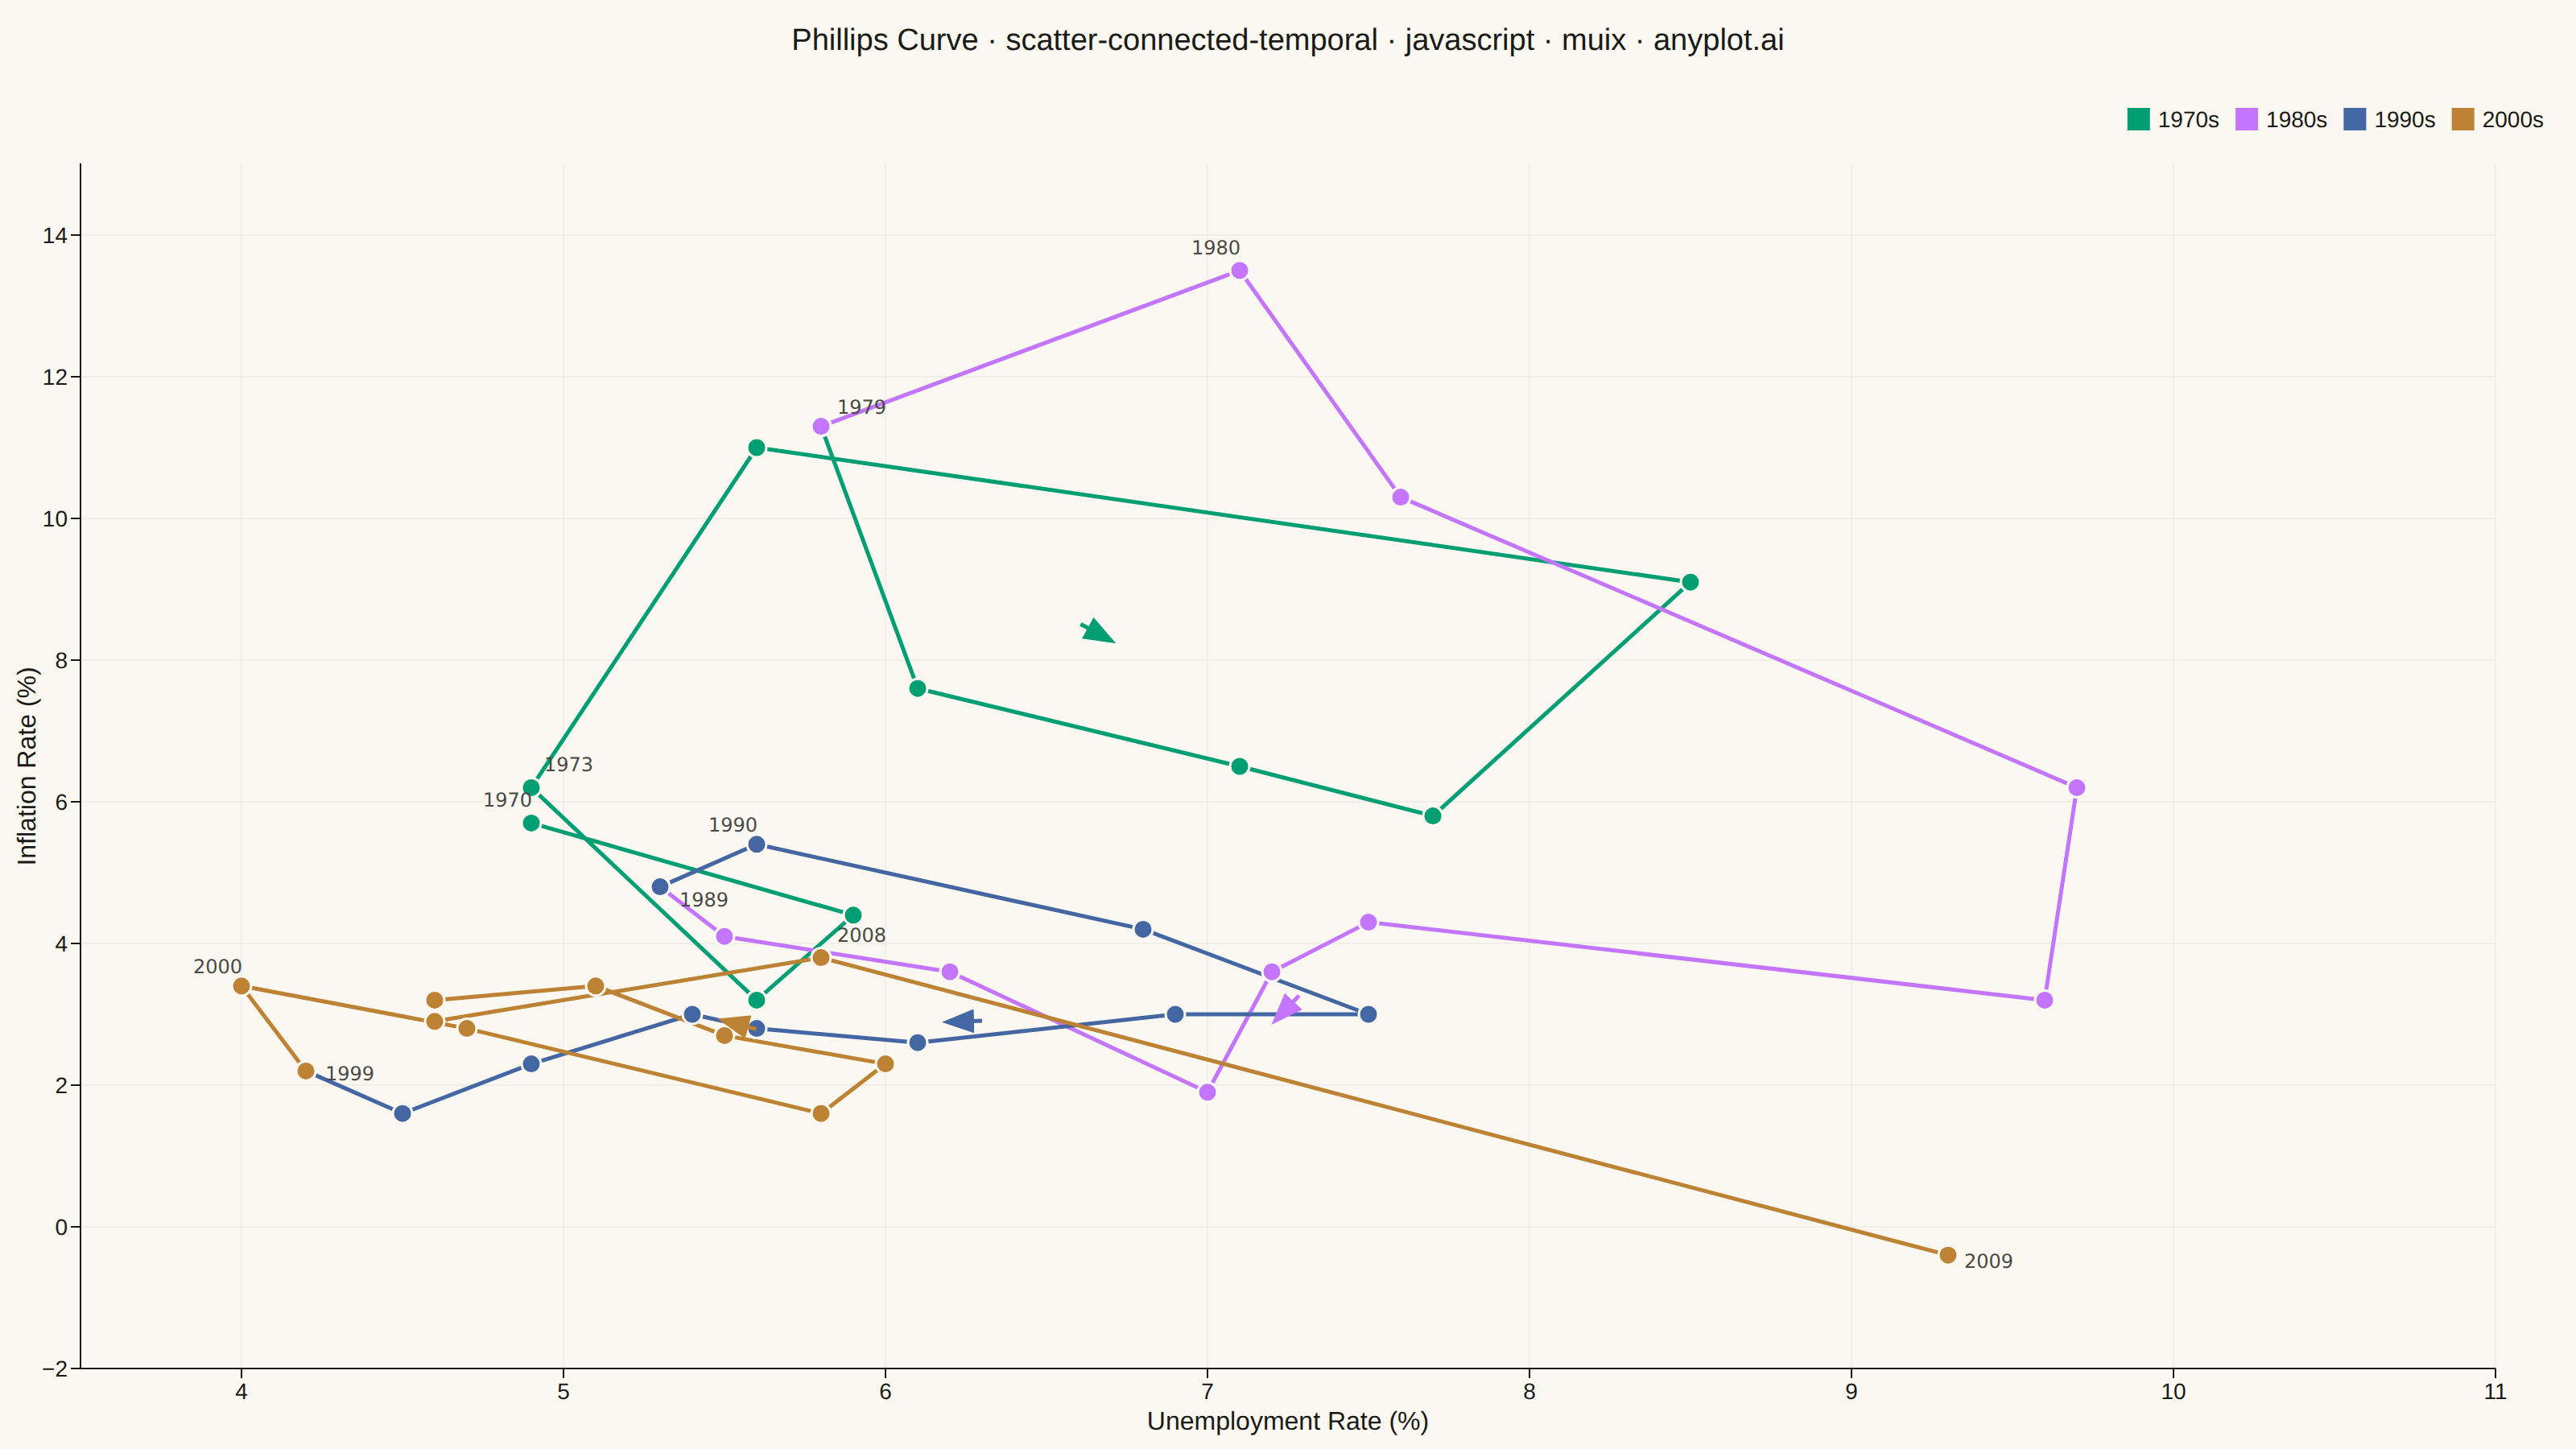
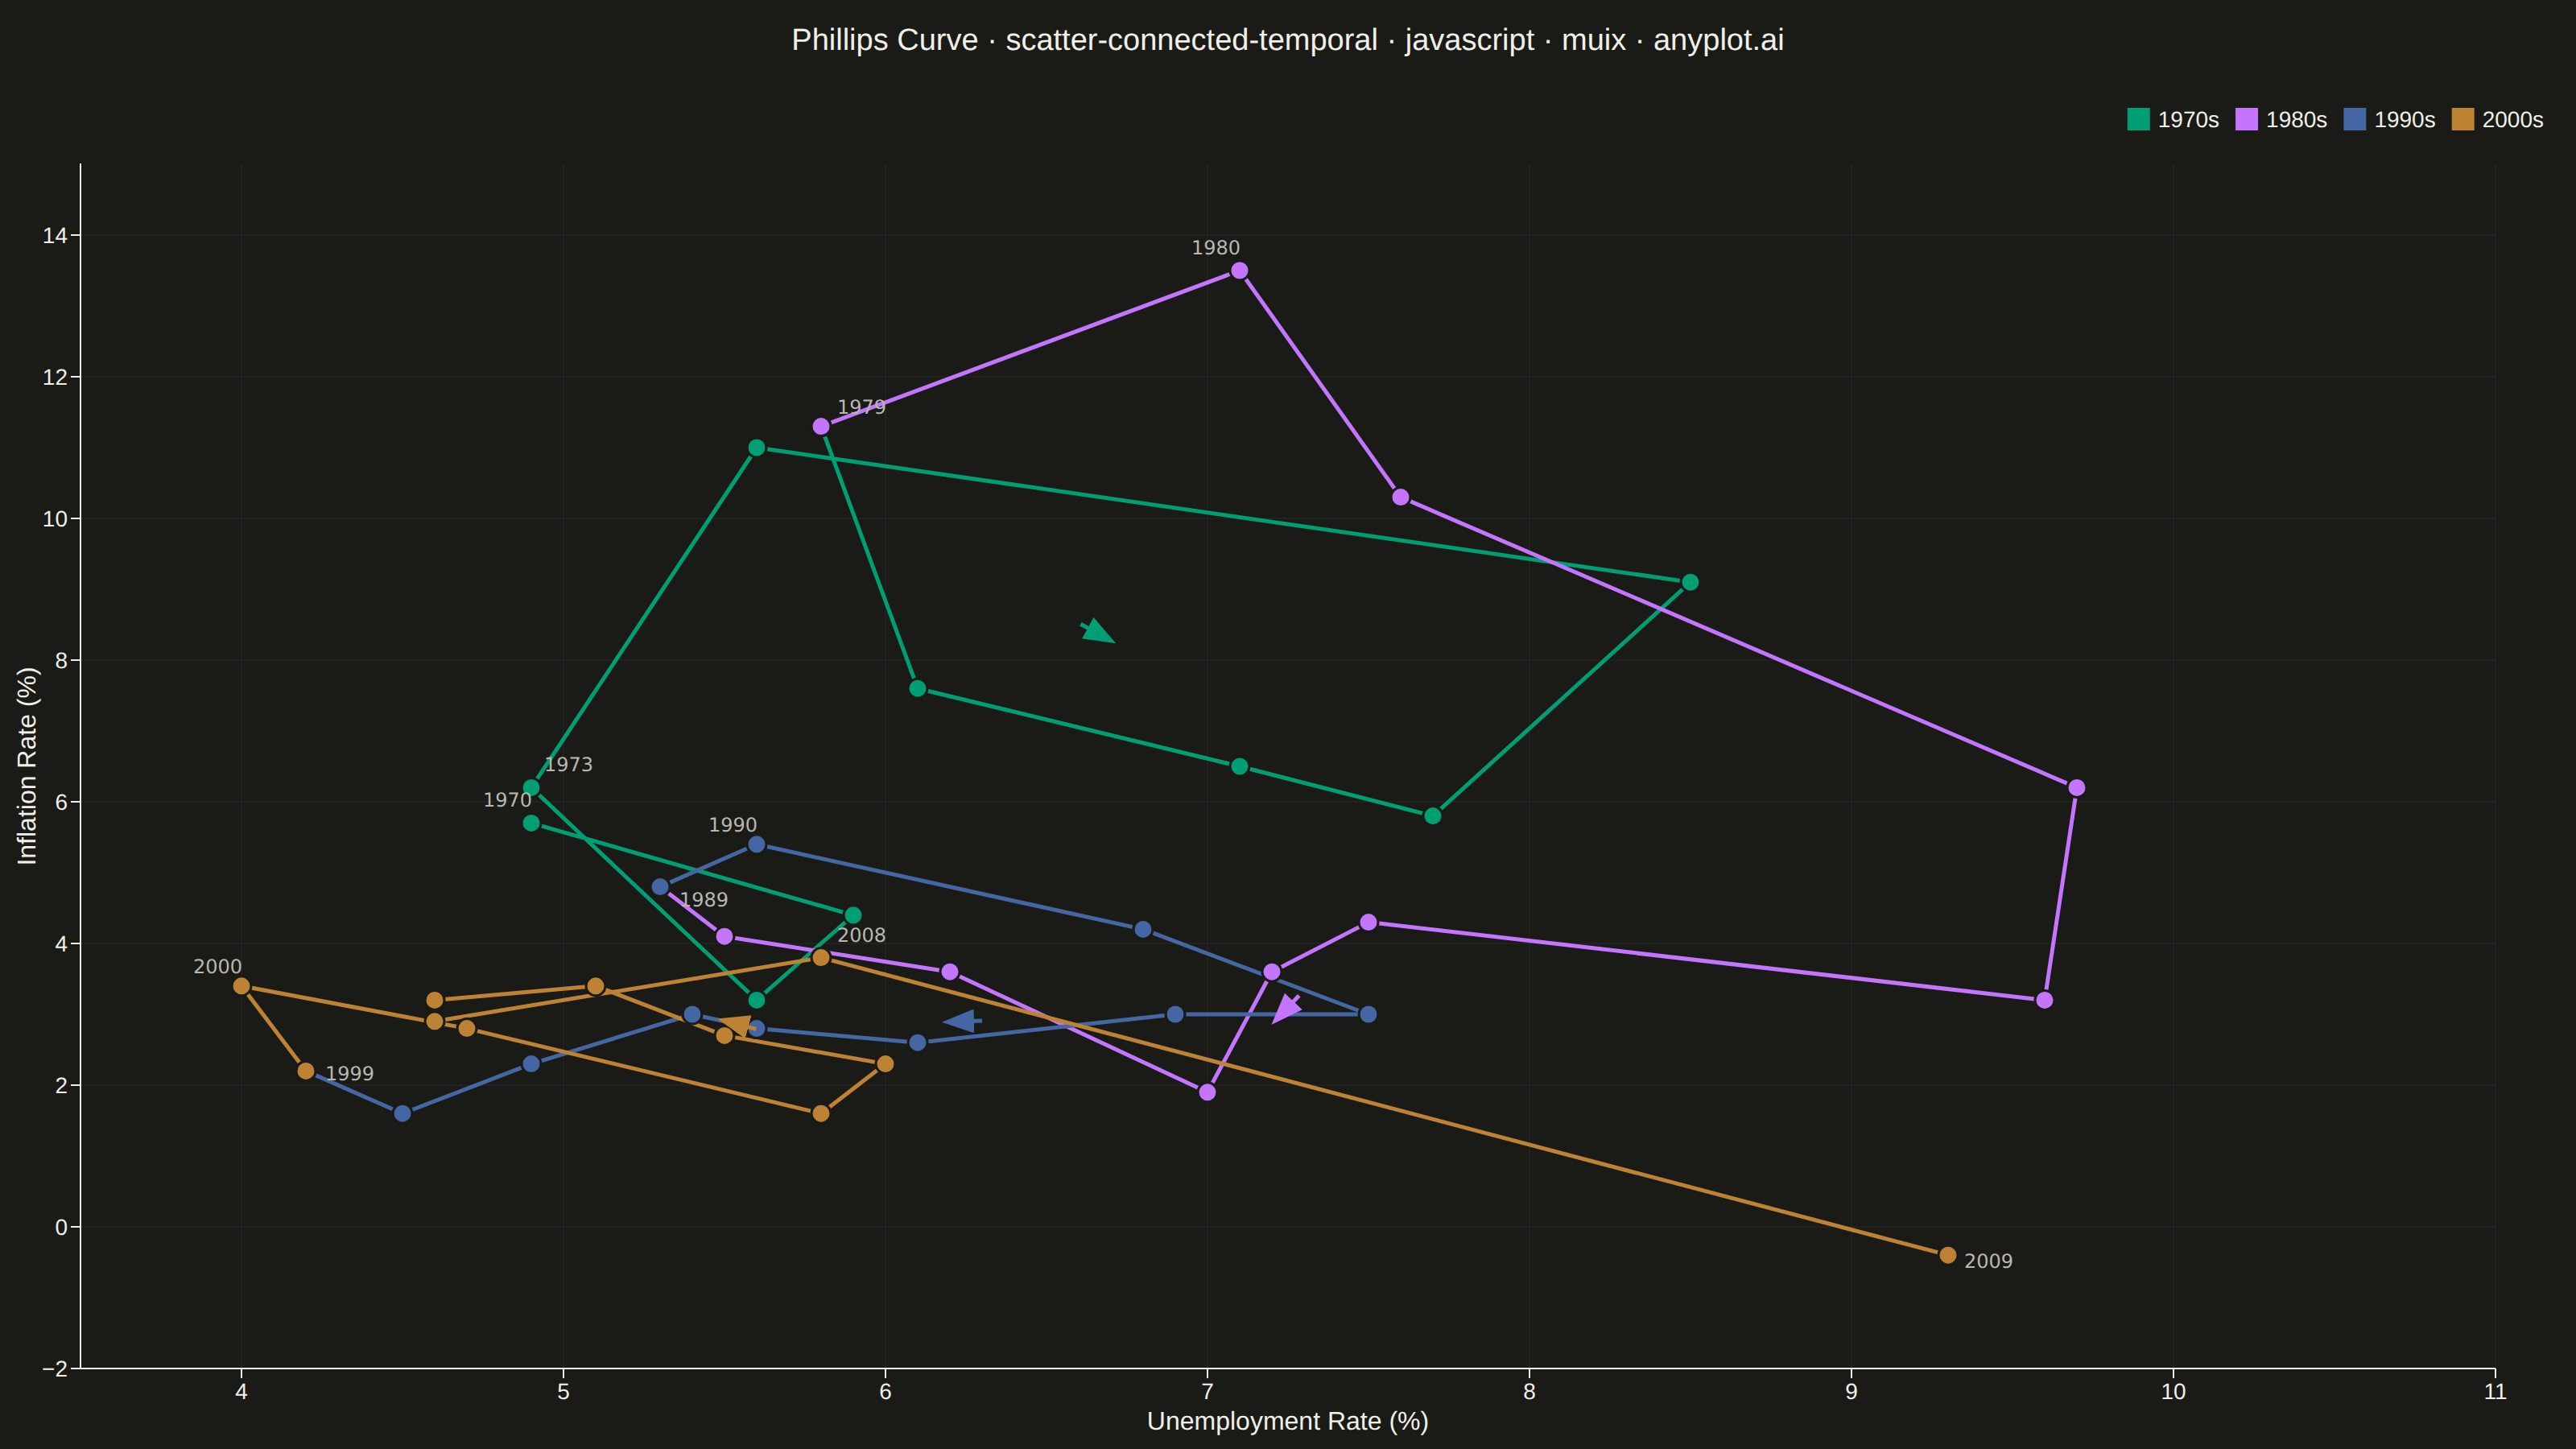
A scatter plot where data points are connected by lines in temporal order, revealing how two variables co-evolve over time. Unlike standard time series plots that show one variable against time, this plot encodes time as movement through 2D space, making cyclical patterns, regime changes, and directional trends visible. Popularized by the New York Times, it is a powerful tool for narrative data visualization.
// anyplot.ai
// scatter-connected-temporal: Connected Scatter Plot with Temporal Path
// Library: muix 7.29.1 | JavaScript 22.22.3
// Quality: 84/100 | Updated: 2026-06-10

import { LineChart, useXScale, useYScale } from "@mui/x-charts";
import Box from "@mui/material/Box";
import Typography from "@mui/material/Typography";

const t = window.ANYPLOT_TOKENS;

// US Phillips curve: unemployment rate (%) vs. inflation rate (%), 1970–2009
const unemployment = [
  4.9, 5.9, 5.6, 4.9, 5.6, 8.5, 7.7, 7.1, 6.1, 5.8, // 1970-1979
  7.1, 7.6, 9.7, 9.6, 7.5, 7.2, 7.0, 6.2, 5.5, 5.3, // 1980-1989
  5.6, 6.8, 7.5, 6.9, 6.1, 5.6, 5.4, 4.9, 4.5, 4.2, // 1990-1999
  4.0, 4.7, 5.8, 6.0, 5.5, 5.1, 4.6, 4.6, 5.8, 9.3, // 2000-2009
];

const inflation = [
   5.7,  4.4,  3.2,  6.2, 11.0,  9.1,  5.8,  6.5,  7.6, 11.3, // 1970-1979
  13.5, 10.3,  6.2,  3.2,  4.3,  3.6,  1.9,  3.6,  4.1,  4.8, // 1980-1989
   5.4,  4.2,  3.0,  3.0,  2.6,  2.8,  3.0,  2.3,  1.6,  2.2, // 1990-1999
   3.4,  2.8,  1.6,  2.3,  2.7,  3.4,  3.2,  2.9,  3.8, -0.4, // 2000-2009
];

// Decade segments — overlap at boundary indices for seamless path connection
const s1970s = inflation.map((v, i) => (i <= 9 ? v : null));
const s1980s = inflation.map((v, i) => (i >= 9 && i <= 19 ? v : null));
const s1990s = inflation.map((v, i) => (i >= 19 && i <= 29 ? v : null));
const s2000s = inflation.map((v, i) => (i >= 29 ? v : null));

// Decade start/end + notable event year annotations [index, label, dx, dy]
const KEY_POINTS = [
  { i:  0, label: "1970", dx: -30, dy: -10 },
  { i:  3, label: "1973", dx:   8, dy: -10 }, // oil shock
  { i:  9, label: "1979", dx:  10, dy:  -8 },
  { i: 10, label: "1980", dx: -30, dy: -10 },
  { i: 19, label: "1989", dx:  12, dy:  12 },
  { i: 20, label: "1990", dx: -30, dy:  -8 },
  { i: 29, label: "1999", dx:  12, dy:   6 },
  { i: 30, label: "2000", dx: -30, dy:  -8 },
  { i: 38, label: "2008", dx:  10, dy: -10 }, // financial crisis
  { i: 39, label: "2009", dx:  10, dy:   8 },
];

// One directional arrow per decade at its midpoint to show temporal flow
const ARROWS = [
  { i:  5, color: t.palette[0] }, // 1975 (1970s midpoint)
  { i: 15, color: t.palette[1] }, // 1985 (1980s midpoint)
  { i: 24, color: t.palette[2] }, // 1994 (1990s midpoint)
  { i: 34, color: t.palette[3] }, // 2004 (2000s midpoint)
];

// Custom overlay rendered inside the LineChart SVG via the children prop.
// Uses useXScale/useYScale (MUI X composition hooks) to convert data coordinates
// to SVG pixel positions for year annotations and directional arrows.
function TemporalOverlay() {
  const xScale = useXScale();
  const yScale = useYScale();
  if (!xScale || !yScale) return null;

  return (
    <g>
      <defs>
        {ARROWS.map(({ color }, idx) => (
          <marker key={idx} id={`arr${idx}`} markerWidth="8" markerHeight="8" refX="6" refY="3" orient="auto">
            <path d="M0,0 L0,6 L8,3 z" fill={color} />
          </marker>
        ))}
      </defs>

      {/* Direction arrows at decade midpoints */}
      {ARROWS.map(({ i, color }, idx) => {
        const x1 = xScale(unemployment[i - 1]);
        const y1 = yScale(inflation[i - 1]);
        const x2 = xScale(unemployment[i + 1]);
        const y2 = yScale(inflation[i + 1]);
        if (x1 == null || y1 == null || x2 == null || y2 == null) return null;
        const mx = (x1 + x2) / 2;
        const my = (y1 + y2) / 2;
        const dx = x2 - x1;
        const dy = y2 - y1;
        const len = Math.sqrt(dx * dx + dy * dy) || 1;
        const s = 20 / len;
        return (
          <line
            key={idx}
            x1={mx - dx * s * 0.5}
            y1={my - dy * s * 0.5}
            x2={mx + dx * s * 0.5}
            y2={my + dy * s * 0.5}
            stroke={color}
            strokeWidth={2.5}
            markerEnd={`url(#arr${idx})`}
          />
        );
      })}

      {/* Year annotations at decade boundaries and notable events */}
      {KEY_POINTS.map(({ i, label, dx, dy }) => {
        const x = xScale(unemployment[i]);
        const y = yScale(inflation[i]);
        if (x == null || y == null) return null;
        return (
          <text
            key={label}
            x={x + dx}
            y={y + dy}
            fontSize={12}
            fill={t.inkSoft}
            fontFamily="system-ui, sans-serif"
          >
            {label}
          </text>
        );
      })}
    </g>
  );
}

// Larger filled markers (r=6) with page-bg outline to distinguish connected-scatter from plain line
function CustomMark({ x, y, color }) {
  return <circle cx={x} cy={y} r={6} fill={color} stroke={t.pageBg} strokeWidth={1.5} />;
}

const TITLE_H = 52;

export default function Chart() {
  const W = window.ANYPLOT_SIZE.width;
  const H = window.ANYPLOT_SIZE.height;

  return (
    <Box
      sx={{
        width: W,
        height: H,
        bgcolor: t.pageBg,
        display: "flex",
        flexDirection: "column",
      }}
    >
      <Typography
        sx={{
          color: t.ink,
          fontSize: 19,
          fontWeight: 500,
          textAlign: "center",
          height: TITLE_H,
          lineHeight: `${TITLE_H}px`,
          flexShrink: 0,
        }}
      >
        Phillips Curve · scatter-connected-temporal · javascript · muix · anyplot.ai
      </Typography>
      <LineChart
        width={W}
        height={H - TITLE_H}
        skipAnimation
        grid={{ horizontal: true, vertical: true }}
        xAxis={[{
          data: unemployment,
          scaleType: "linear",
          label: "Unemployment Rate (%)",
          min: 3.5,
          max: 11.0,
          tickMinStep: 1,
          tickLabelStyle: { fontSize: 14 },
          labelStyle: { fontSize: 16 },
        }]}
        yAxis={[{
          label: "Inflation Rate (%)",
          min: -2,
          max: 15,
          tickMinStep: 2,
          tickLabelStyle: { fontSize: 14 },
          labelStyle: { fontSize: 16 },
        }]}
        series={[
          { data: s1970s, label: "1970s", color: t.palette[0], showMark: true, curve: "linear" },
          { data: s1980s, label: "1980s", color: t.palette[1], showMark: true, curve: "linear" },
          { data: s1990s, label: "1990s", color: t.palette[2], showMark: true, curve: "linear" },
          { data: s2000s, label: "2000s", color: t.palette[3], showMark: true, curve: "linear" },
        ]}
        slots={{ mark: CustomMark }}
        slotProps={{
          legend: {
            direction: "row",
            position: { vertical: "top", horizontal: "right" },
            itemMarkWidth: 14,
            itemMarkHeight: 14,
            labelStyle: { fontSize: 14 },
          },
        }}
        sx={{
          "& .MuiLineElement-root": { strokeWidth: 2.5 },
          "& .MuiChartsGrid-root line": { strokeOpacity: 0.25 },
        }}
      >
        <TemporalOverlay />
      </LineChart>
    </Box>
  );
}
Runnable source as JSON, for any HTTP client: https://api.anyplot.ai/specs/scatter-connected-temporal/muix/code. Any spec id and library id listed in llms-full.txt fit the same URL shape; every URL below is complete and callable.
{
  "spec_id": "scatter-connected-temporal",
  "language": "javascript",
  "library": "muix",
  "page": "https://anyplot.ai/scatter-connected-temporal/javascript/muix",
  "hub": "https://anyplot.ai/scatter-connected-temporal",
  "code_json": "https://api.anyplot.ai/specs/scatter-connected-temporal/muix/code",
  "spec_json": "https://api.anyplot.ai/specs/scatter-connected-temporal",
  "render_light_png": "https://storage.googleapis.com/anyplot-images/plots/scatter-connected-temporal/javascript/muix/plot-light.png",
  "render_dark_png": "https://storage.googleapis.com/anyplot-images/plots/scatter-connected-temporal/javascript/muix/plot-dark.png",
  "interactive_light_html": "https://storage.googleapis.com/anyplot-images/plots/scatter-connected-temporal/javascript/muix/plot-light.html",
  "interactive_dark_html": "https://storage.googleapis.com/anyplot-images/plots/scatter-connected-temporal/javascript/muix/plot-dark.html",
  "quality_score": 84.0,
  "license": "MIT",
  "guide": "https://anyplot.ai/llms.txt"
}
Part of Connected Scatter Plot with Temporal Path on anyplot.ai.