The same plot in 14 other libraries — JavaScript: Chart.js, D3.js, Apache ECharts, MUI X Charts; Python: Altair, Bokeh, lets-plot, Matplotlib, Plotly, plotnine, Pygal, Seaborn; R: ggplot2; Julia: Makie.jl. Compare all 15 side by side: Connected Scatter Plot with Temporal Path in Python, R, Julia and JavaScript.
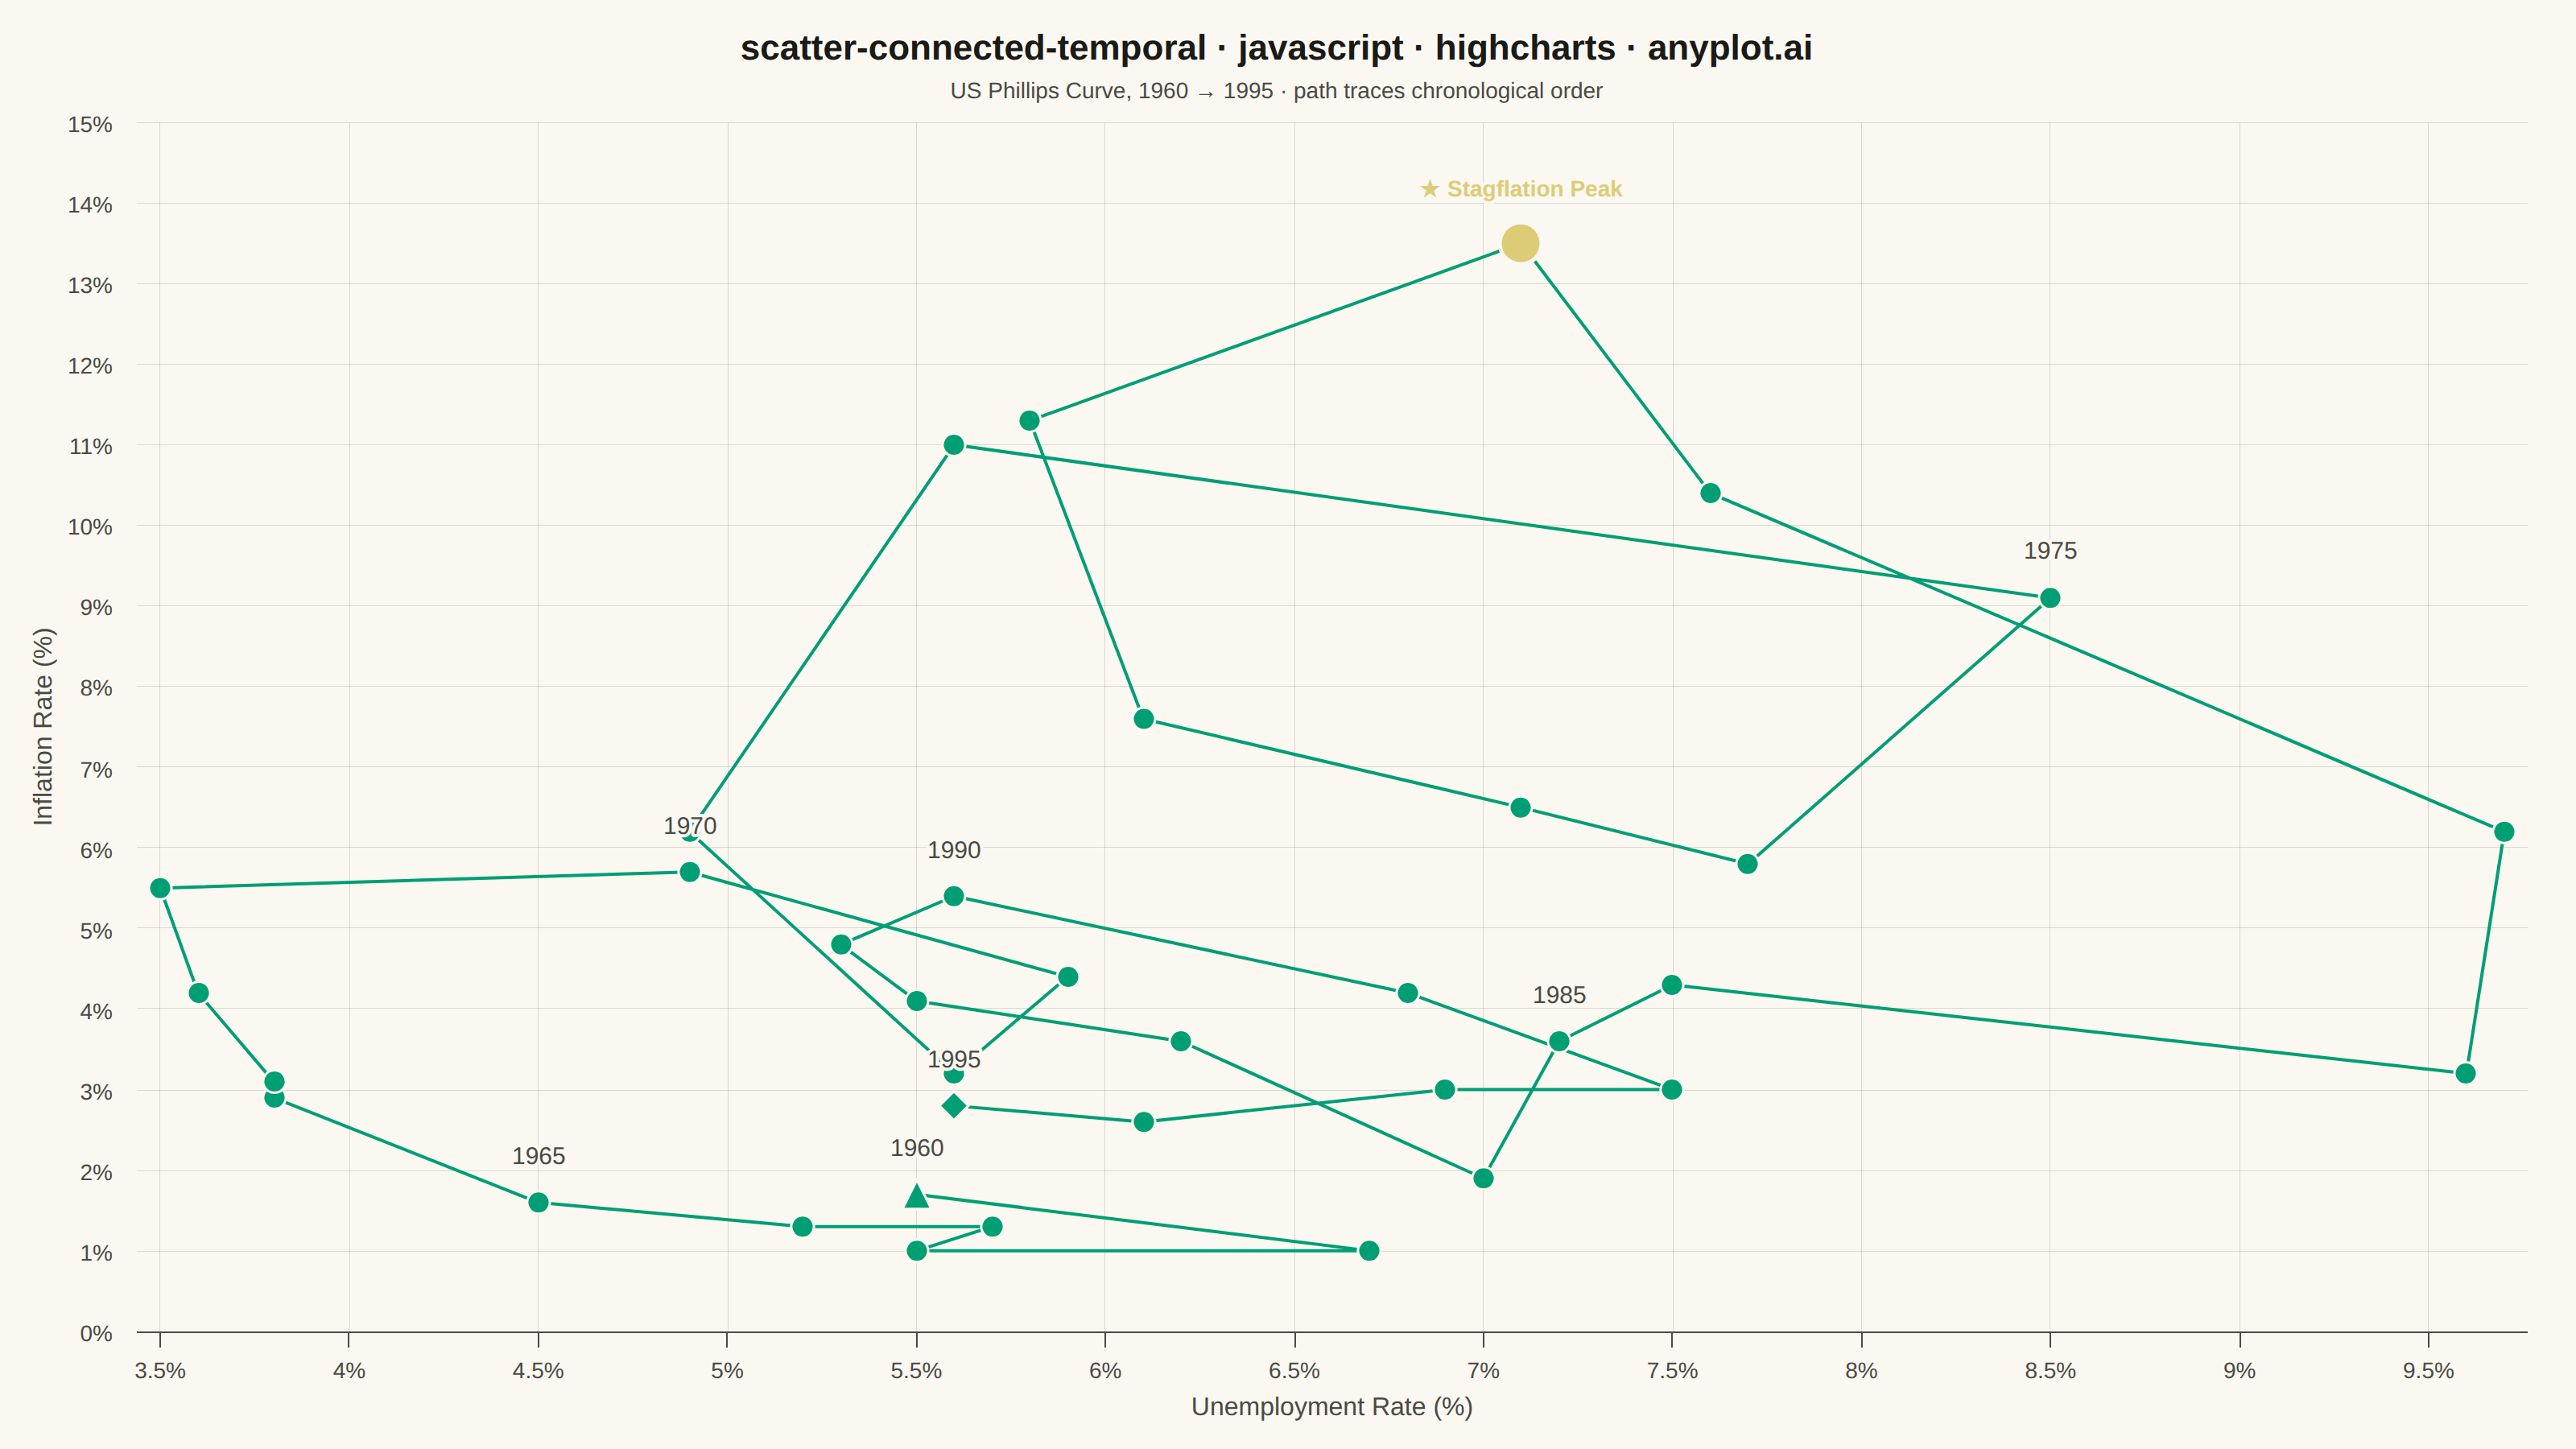
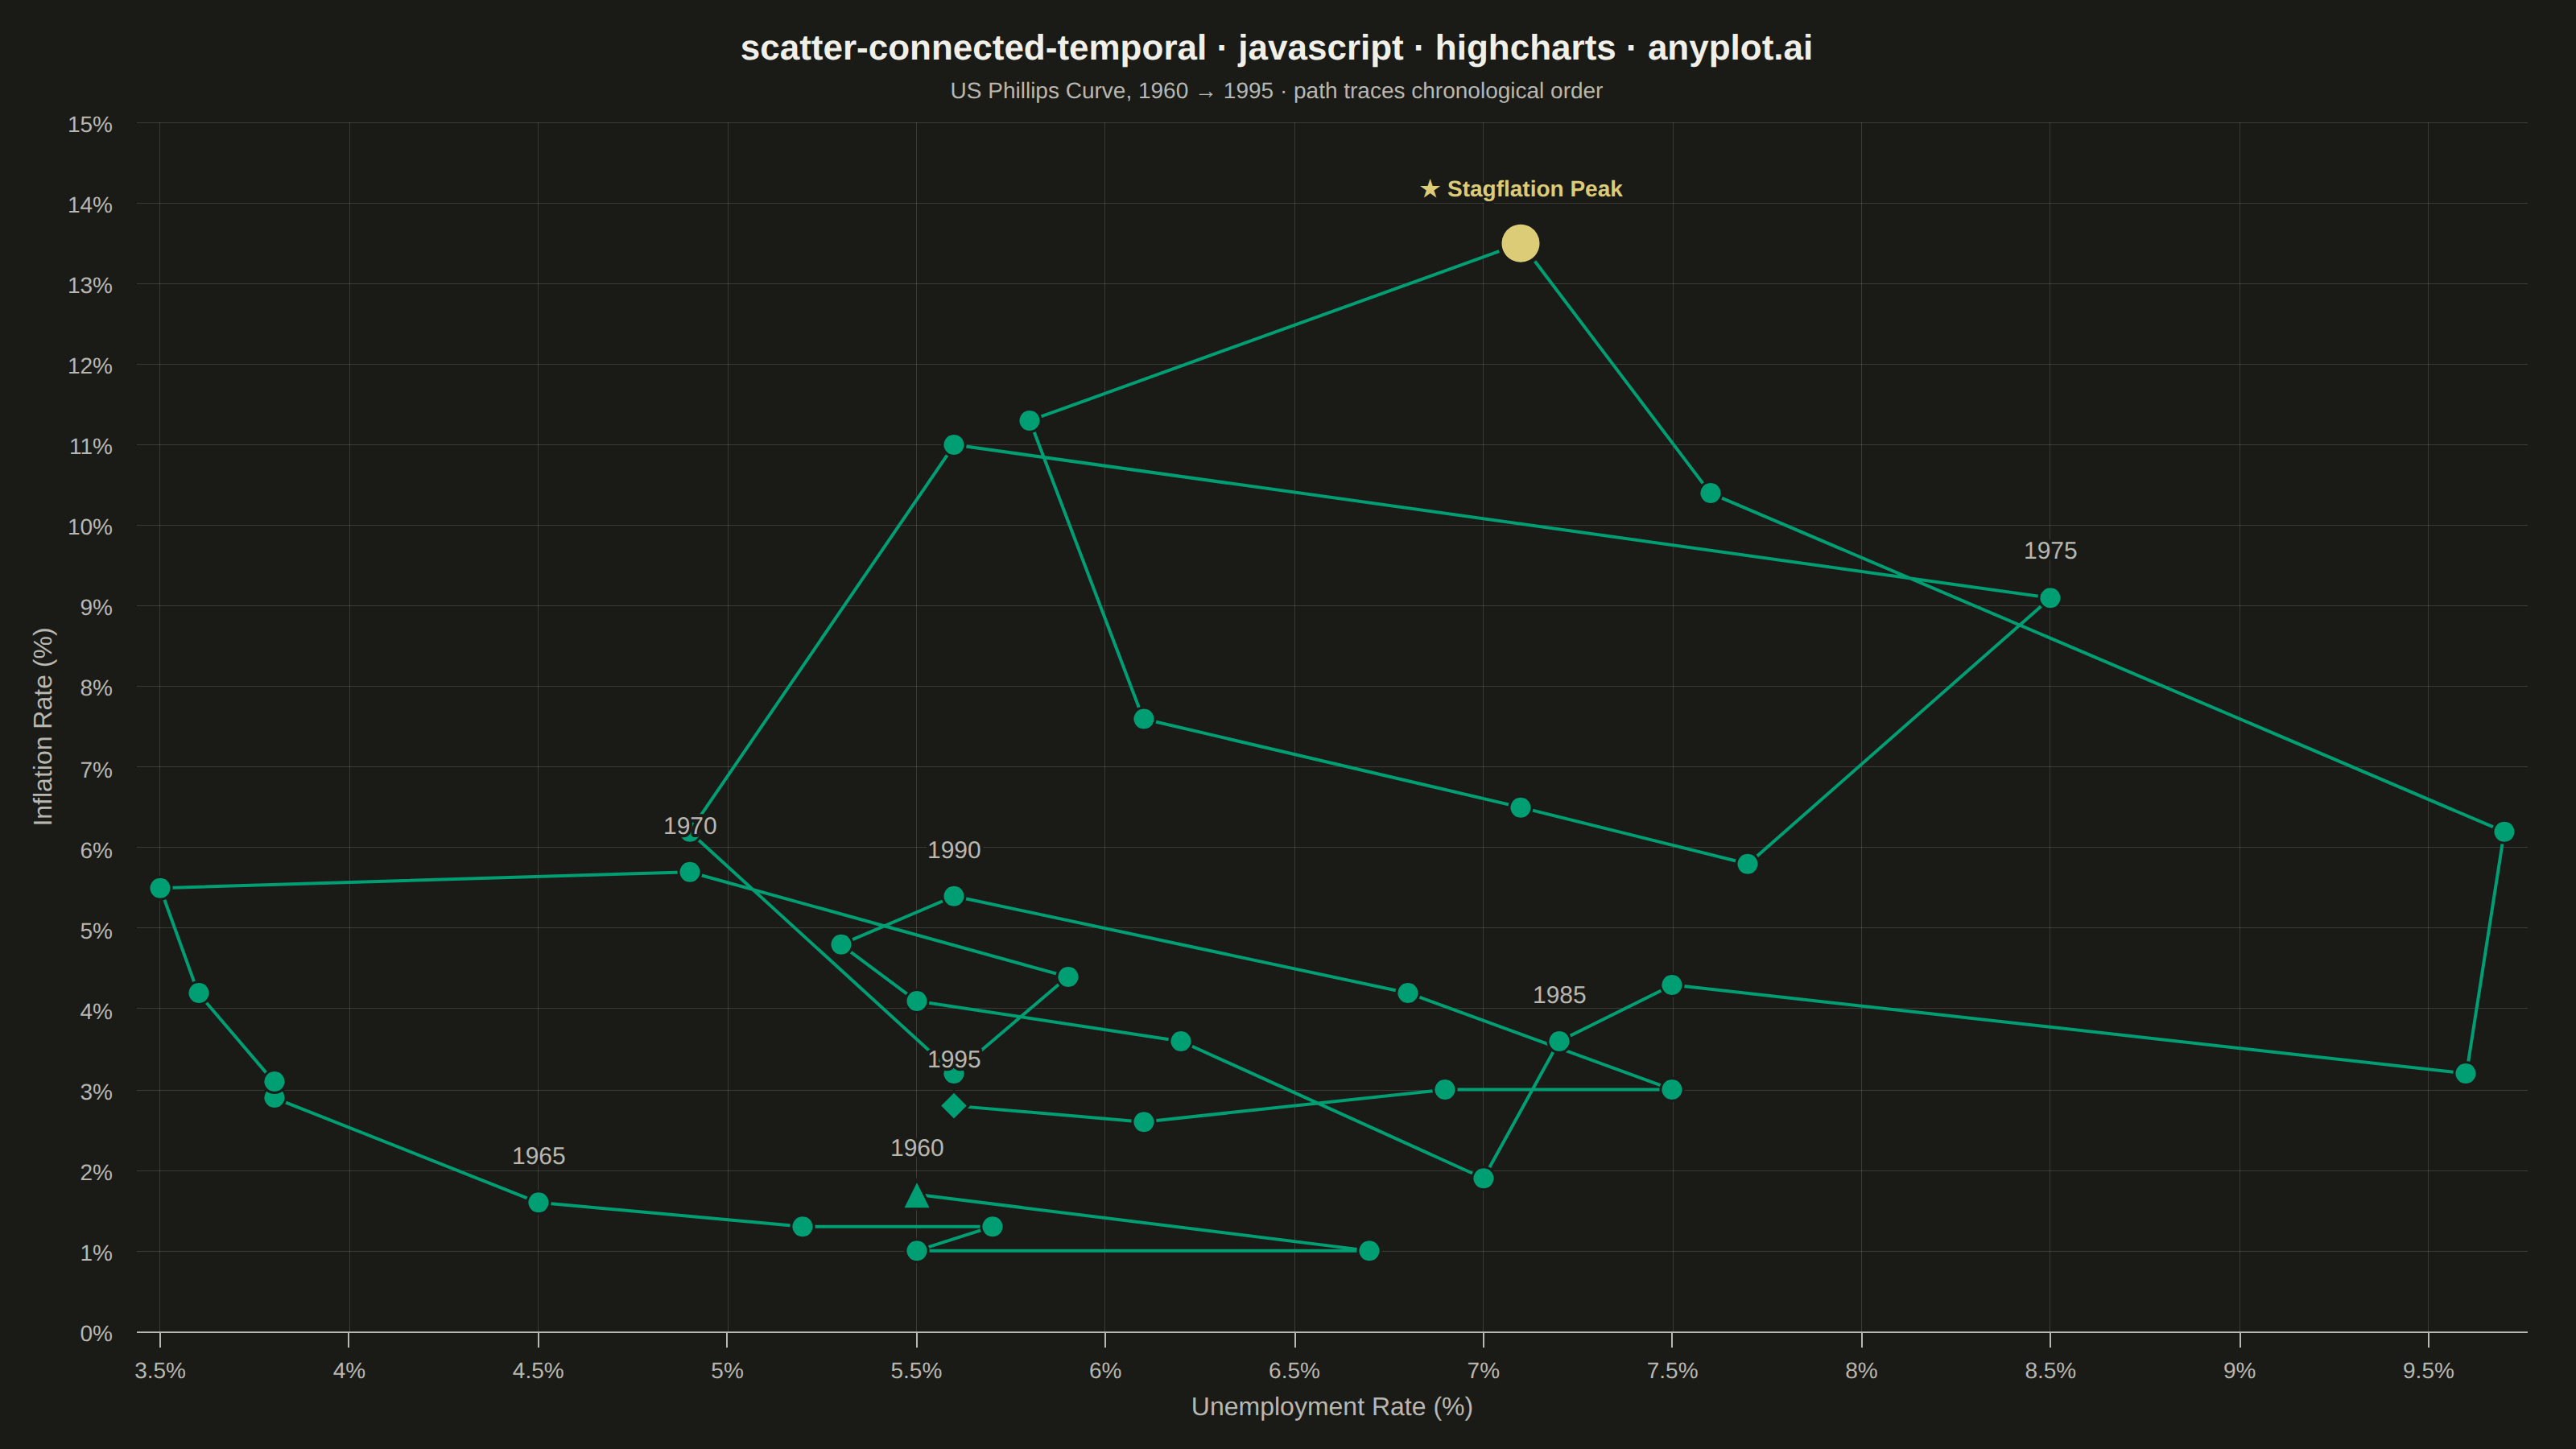
A scatter plot where data points are connected by lines in temporal order, revealing how two variables co-evolve over time. Unlike standard time series plots that show one variable against time, this plot encodes time as movement through 2D space, making cyclical patterns, regime changes, and directional trends visible. Popularized by the New York Times, it is a powerful tool for narrative data visualization.
// anyplot.ai
// scatter-connected-temporal: Connected Scatter Plot with Temporal Path
// Library: highcharts 12.6.0 | JavaScript 22.22.3
// Quality: 84/100 | Created: 2026-06-09
//# anyplot-orientation: landscape

const t = window.ANYPLOT_TOKENS;

// US Phillips Curve data [year, unemployment%, inflation%] 1960-1995
const rawData = [
  [1960,  5.5,  1.7], [1961,  6.7,  1.0], [1962,  5.5,  1.0], [1963,  5.7,  1.3],
  [1964,  5.2,  1.3], [1965,  4.5,  1.6], [1966,  3.8,  2.9], [1967,  3.8,  3.1],
  [1968,  3.6,  4.2], [1969,  3.5,  5.5], [1970,  4.9,  5.7], [1971,  5.9,  4.4],
  [1972,  5.6,  3.2], [1973,  4.9,  6.2], [1974,  5.6, 11.0], [1975,  8.5,  9.1],
  [1976,  7.7,  5.8], [1977,  7.1,  6.5], [1978,  6.1,  7.6], [1979,  5.8, 11.3],
  [1980,  7.1, 13.5], [1981,  7.6, 10.4], [1982,  9.7,  6.2], [1983,  9.6,  3.2],
  [1984,  7.5,  4.3], [1985,  7.2,  3.6], [1986,  7.0,  1.9], [1987,  6.2,  3.6],
  [1988,  5.5,  4.1], [1989,  5.3,  4.8], [1990,  5.6,  5.4], [1991,  6.8,  4.2],
  [1992,  7.5,  3.0], [1993,  6.9,  3.0], [1994,  6.1,  2.6], [1995,  5.6,  2.8]
];

// 1980 has its own per-point label; omit it from the regular set
const labelYears = new Set([1960, 1965, 1970, 1975, 1985, 1990, 1995]);

// Scatter series with lineWidth connects points in DATA ARRAY ORDER (temporal order),
// unlike line series which sorts by x — crucial for the connected scatter path.
const seriesData = rawData.map(function([year, unemp, infl]) {
  const isStart = year === 1960;
  const isEnd = year === 1995;
  const isPeak = year === 1980;
  const point = {
    x: unemp,
    y: infl,
    name: String(year),
    marker: {
      radius: (isStart || isEnd) ? 9 : isPeak ? 13 : 7,
      symbol: isStart ? 'triangle' : (isEnd ? 'diamond' : 'circle'),
      fillColor: isPeak ? t.amber : t.palette[0],
      lineWidth: isPeak ? 2.5 : 1.5,
      lineColor: t.pageBg
    }
  };
  // Prominent focal-point label for the 1980 stagflation climax
  if (isPeak) {
    point.dataLabels = {
      enabled: true,
      formatter: function () { return '★ Stagflation Peak'; },
      y: -22,
      style: {
        color: t.amber,
        fontSize: '14px',
        fontWeight: '700',
        textOutline: '2px ' + t.pageBg
      }
    };
  }
  return point;
});

Highcharts.chart('container', {
  chart: {
    type: 'scatter',
    backgroundColor: 'transparent',
    animation: false,
    style: { fontFamily: 'inherit' },
    spacingTop: 20,
    spacingRight: 30,
    spacingBottom: 20,
    spacingLeft: 15
  },
  credits: { enabled: false },
  colors: t.palette,
  title: {
    text: 'scatter-connected-temporal · javascript · highcharts · anyplot.ai',
    style: { color: t.ink, fontSize: '22px', fontWeight: '600' }
  },
  subtitle: {
    text: 'US Phillips Curve, 1960 → 1995 · path traces chronological order',
    style: { color: t.inkSoft, fontSize: '14px' }
  },
  xAxis: {
    title: {
      text: 'Unemployment Rate (%)',
      style: { color: t.inkSoft, fontSize: '16px' }
    },
    lineColor: t.inkSoft,
    tickColor: t.inkSoft,
    gridLineWidth: 0.5,
    gridLineColor: t.grid,
    labels: {
      style: { color: t.inkSoft, fontSize: '14px' },
      format: '{value}%'
    }
  },
  yAxis: {
    title: {
      text: 'Inflation Rate (%)',
      style: { color: t.inkSoft, fontSize: '16px' }
    },
    gridLineWidth: 0.5,
    gridLineColor: t.grid,
    labels: {
      style: { color: t.inkSoft, fontSize: '14px' },
      format: '{value}%'
    }
  },
  legend: { enabled: false },
  tooltip: {
    formatter: function () {
      return '<b>' + this.point.name + '</b><br/>' +
             'Unemployment: ' + this.x.toFixed(1) + '%<br/>' +
             'Inflation: ' + this.y.toFixed(1) + '%';
    },
    backgroundColor: t.elevatedBg,
    borderColor: t.inkSoft,
    style: { color: t.ink, fontSize: '14px' }
  },
  plotOptions: {
    series: { animation: false },
    scatter: {
      lineWidth: 2,
      color: t.palette[0],
      marker: {
        enabled: true,
        radius: 7,
        symbol: 'circle',
        fillColor: t.palette[0],
        lineWidth: 1.5,
        lineColor: t.pageBg
      },
      dataLabels: {
        enabled: true,
        formatter: function () {
          return labelYears.has(parseInt(this.point.name, 10)) ? this.point.name : null;
        },
        y: -16,
        style: {
          color: t.inkSoft,
          fontSize: '15px',
          fontWeight: 'normal',
          textOutline: '2px ' + t.pageBg
        }
      }
    }
  },
  series: [{
    name: 'Phillips Curve (1960–1995)',
    data: seriesData
  }]
});
Runnable source as JSON, for any HTTP client: https://api.anyplot.ai/specs/scatter-connected-temporal/highcharts/code. Any spec id and library id listed in llms-full.txt fit the same URL shape; every URL below is complete and callable.
{
  "spec_id": "scatter-connected-temporal",
  "language": "javascript",
  "library": "highcharts",
  "page": "https://anyplot.ai/scatter-connected-temporal/javascript/highcharts",
  "hub": "https://anyplot.ai/scatter-connected-temporal",
  "code_json": "https://api.anyplot.ai/specs/scatter-connected-temporal/highcharts/code",
  "spec_json": "https://api.anyplot.ai/specs/scatter-connected-temporal",
  "render_light_png": "https://storage.googleapis.com/anyplot-images/plots/scatter-connected-temporal/javascript/highcharts/plot-light.png",
  "render_dark_png": "https://storage.googleapis.com/anyplot-images/plots/scatter-connected-temporal/javascript/highcharts/plot-dark.png",
  "interactive_light_html": "https://storage.googleapis.com/anyplot-images/plots/scatter-connected-temporal/javascript/highcharts/plot-light.html",
  "interactive_dark_html": "https://storage.googleapis.com/anyplot-images/plots/scatter-connected-temporal/javascript/highcharts/plot-dark.html",
  "quality_score": 84.0,
  "license": "MIT",
  "guide": "https://anyplot.ai/llms.txt"
}
Part of Connected Scatter Plot with Temporal Path on anyplot.ai.