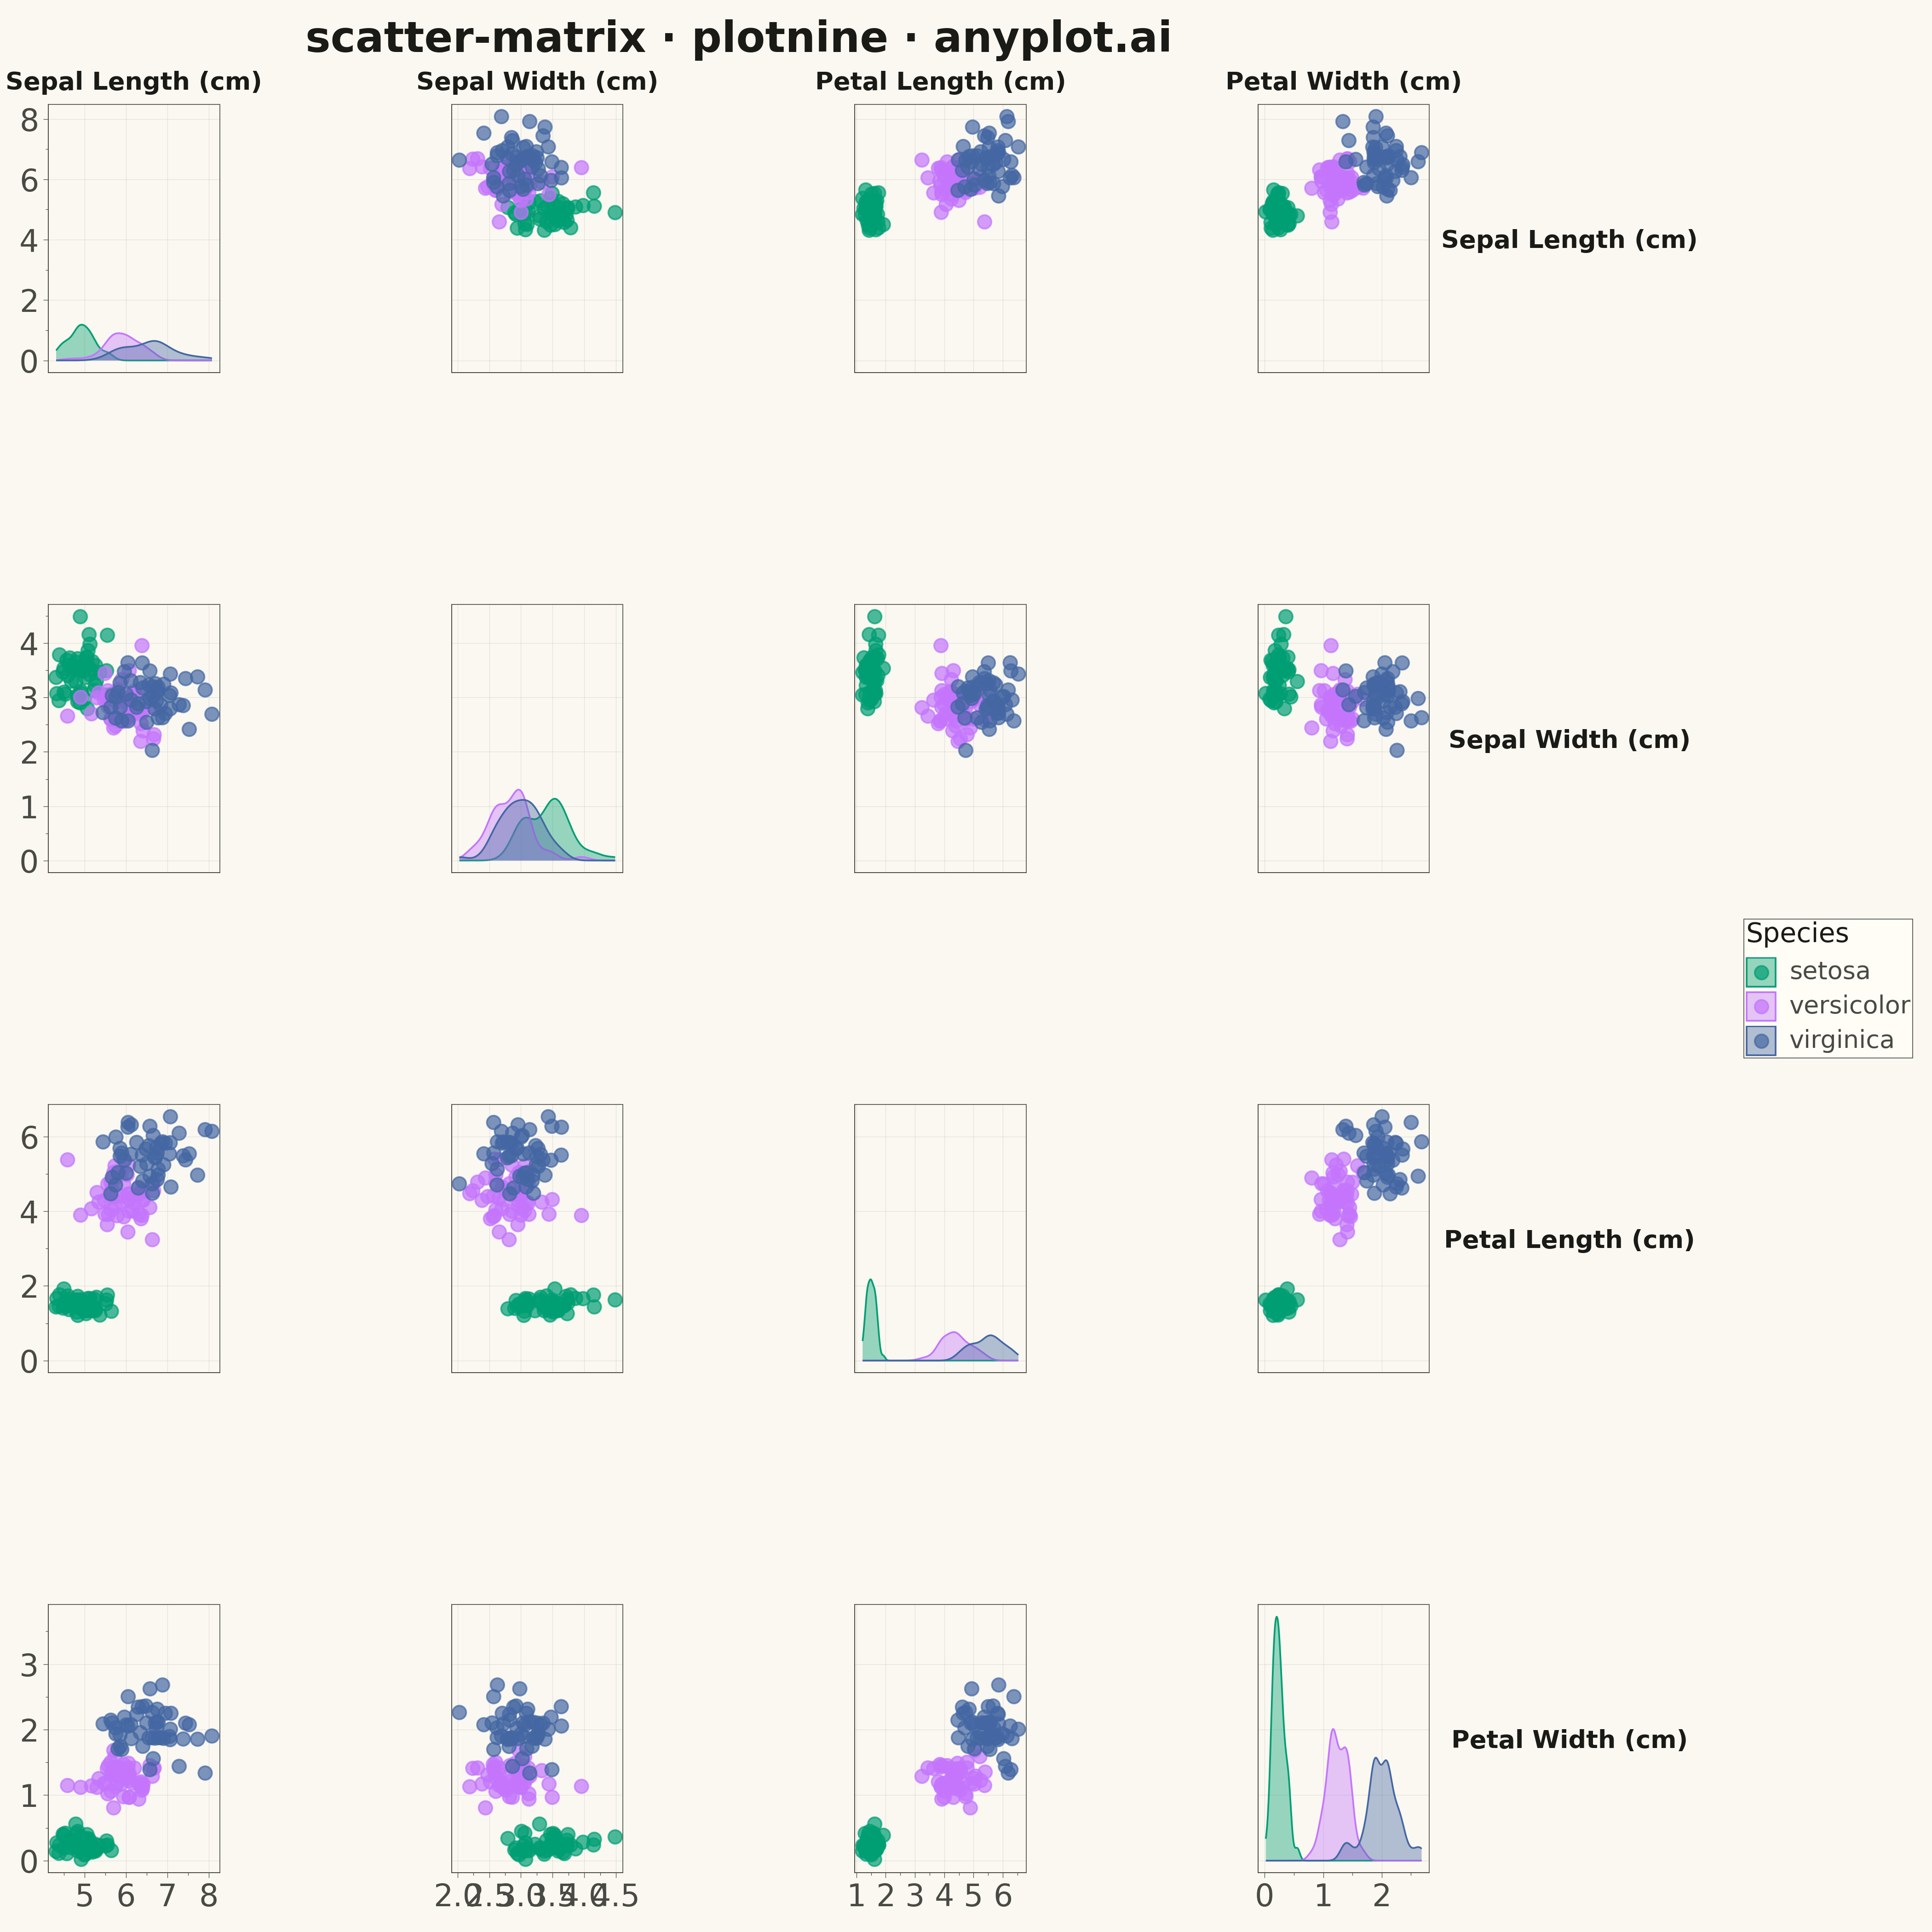
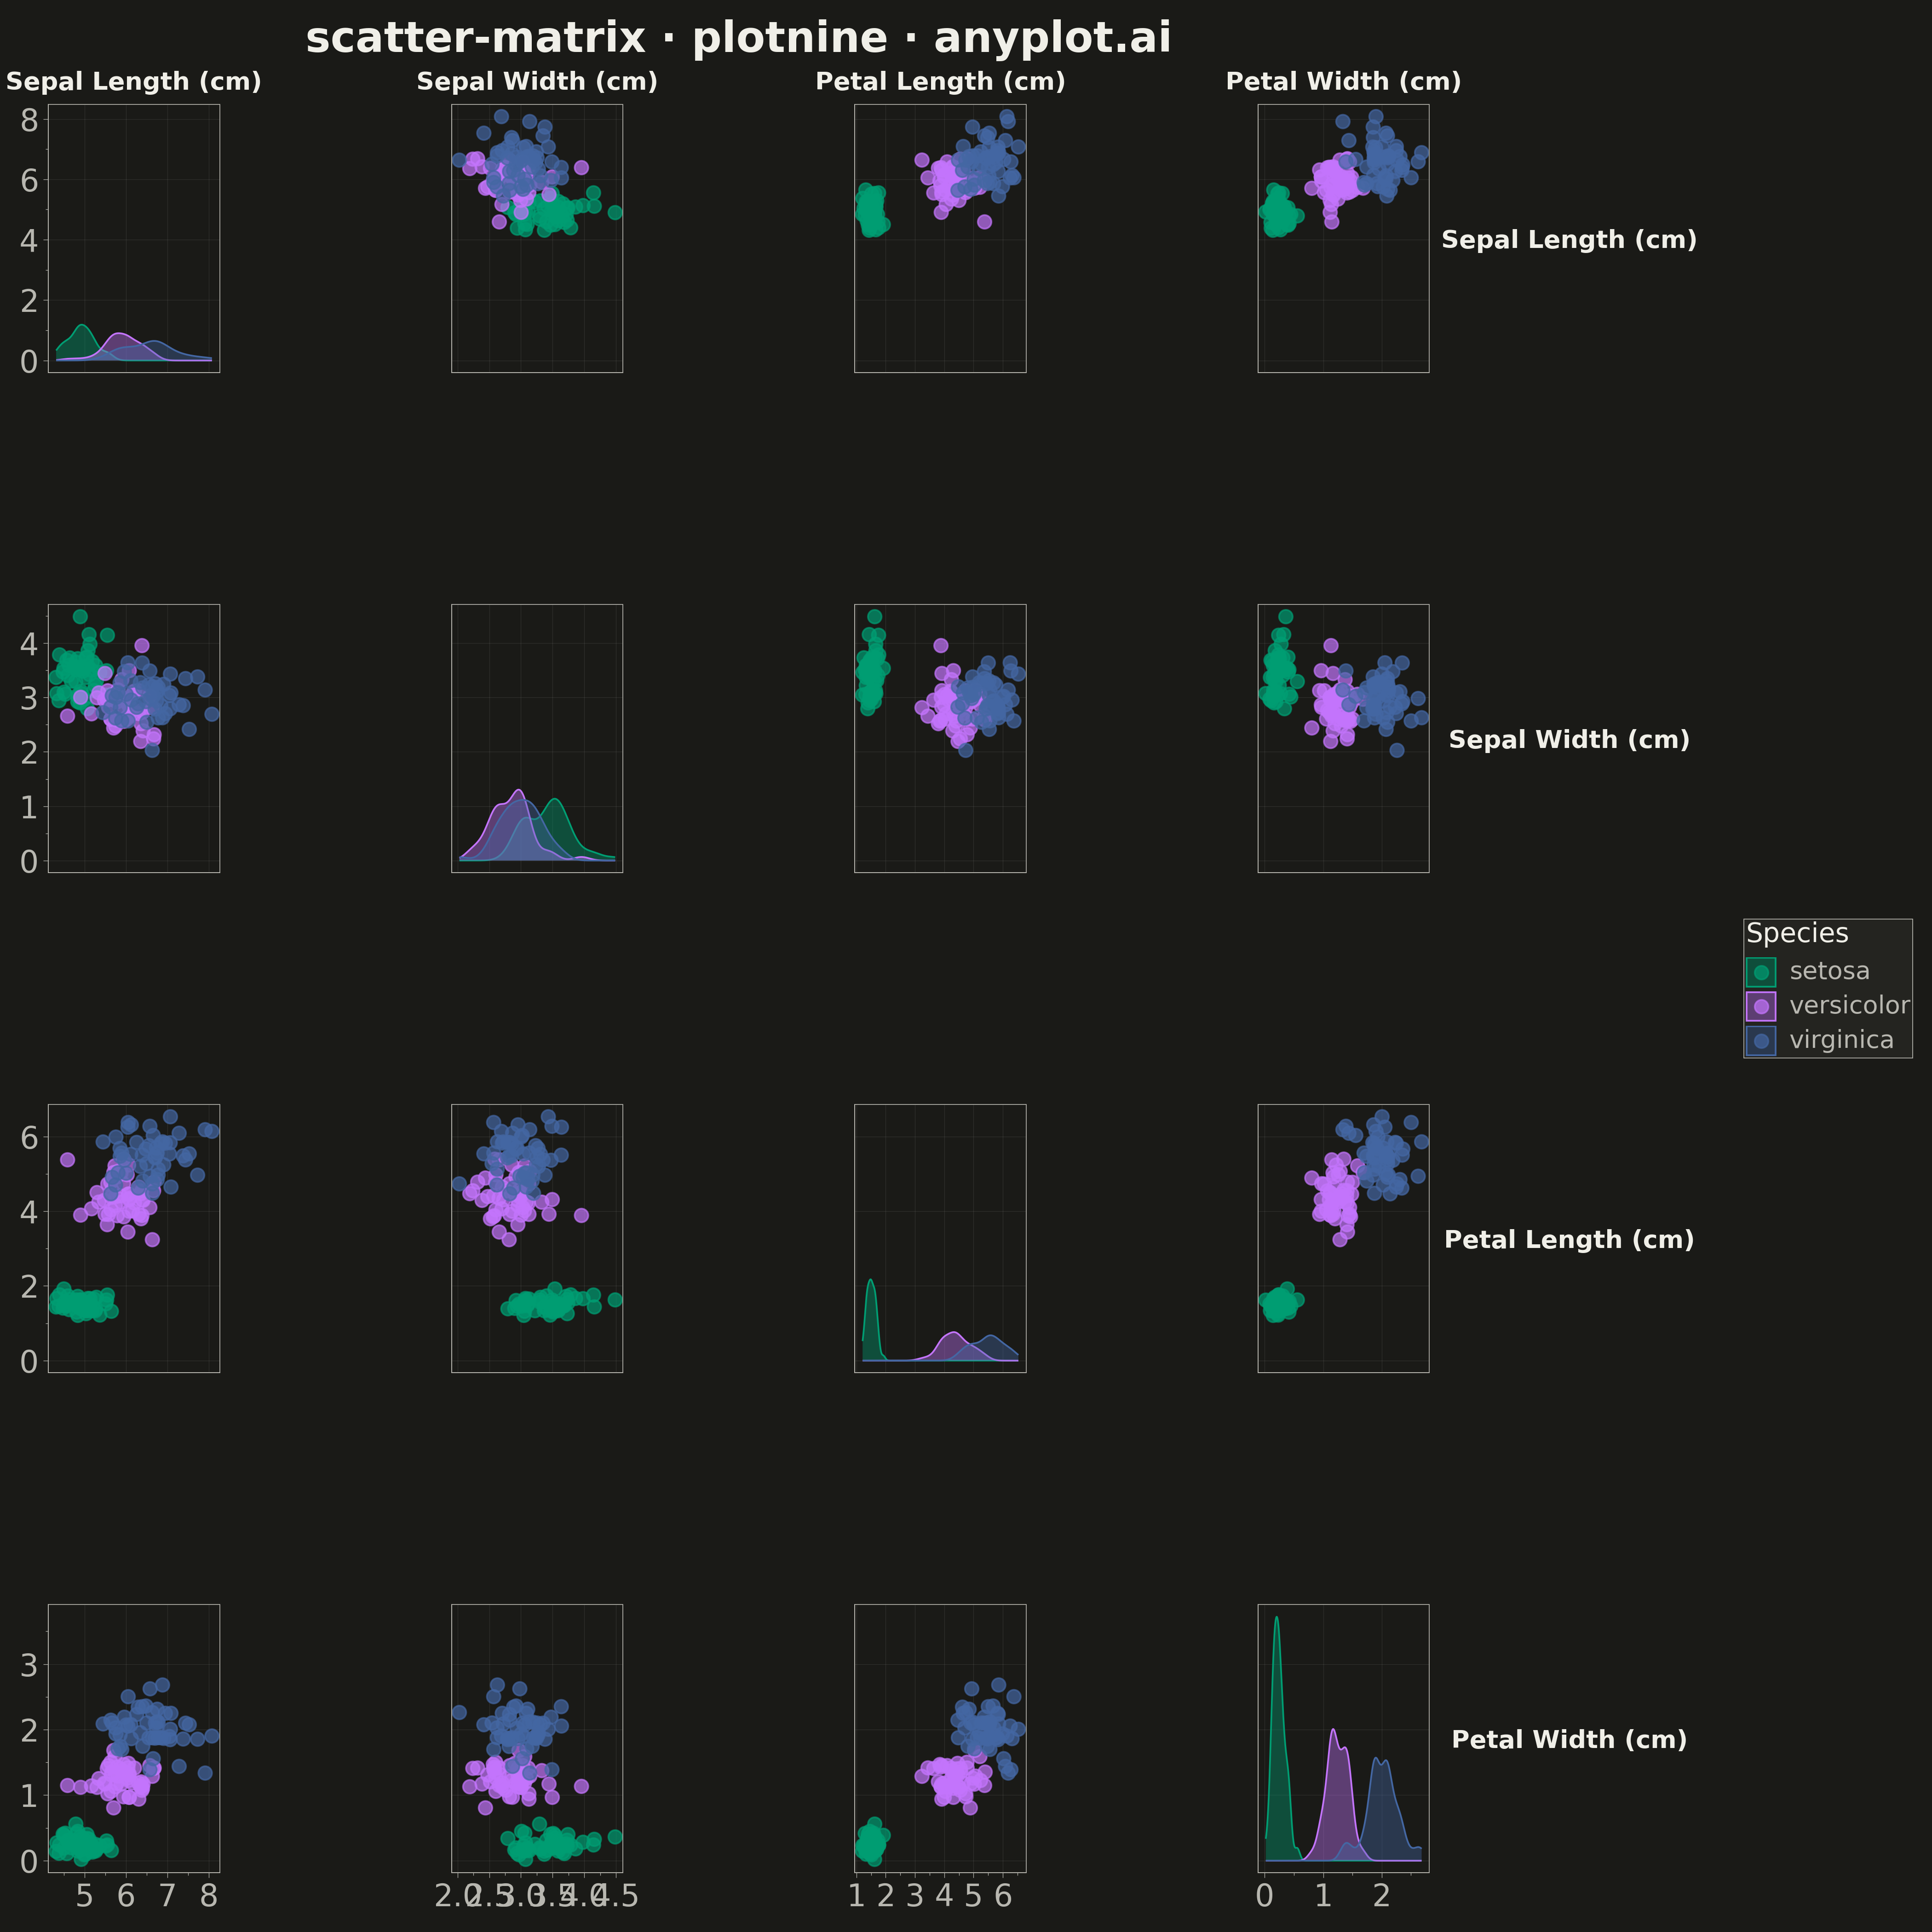
A grid of scatter plots showing all pairwise relationships between multiple variables, with histograms or kernel density estimates on the diagonal. This comprehensive visualization enables simultaneous exploration of correlations and distributions across an entire dataset, making it invaluable for understanding multivariate data structure at a glance. Also known as a pairplot or SPLOM (Scatter Plot Matrix).
Preview render from the plotnine implementation.