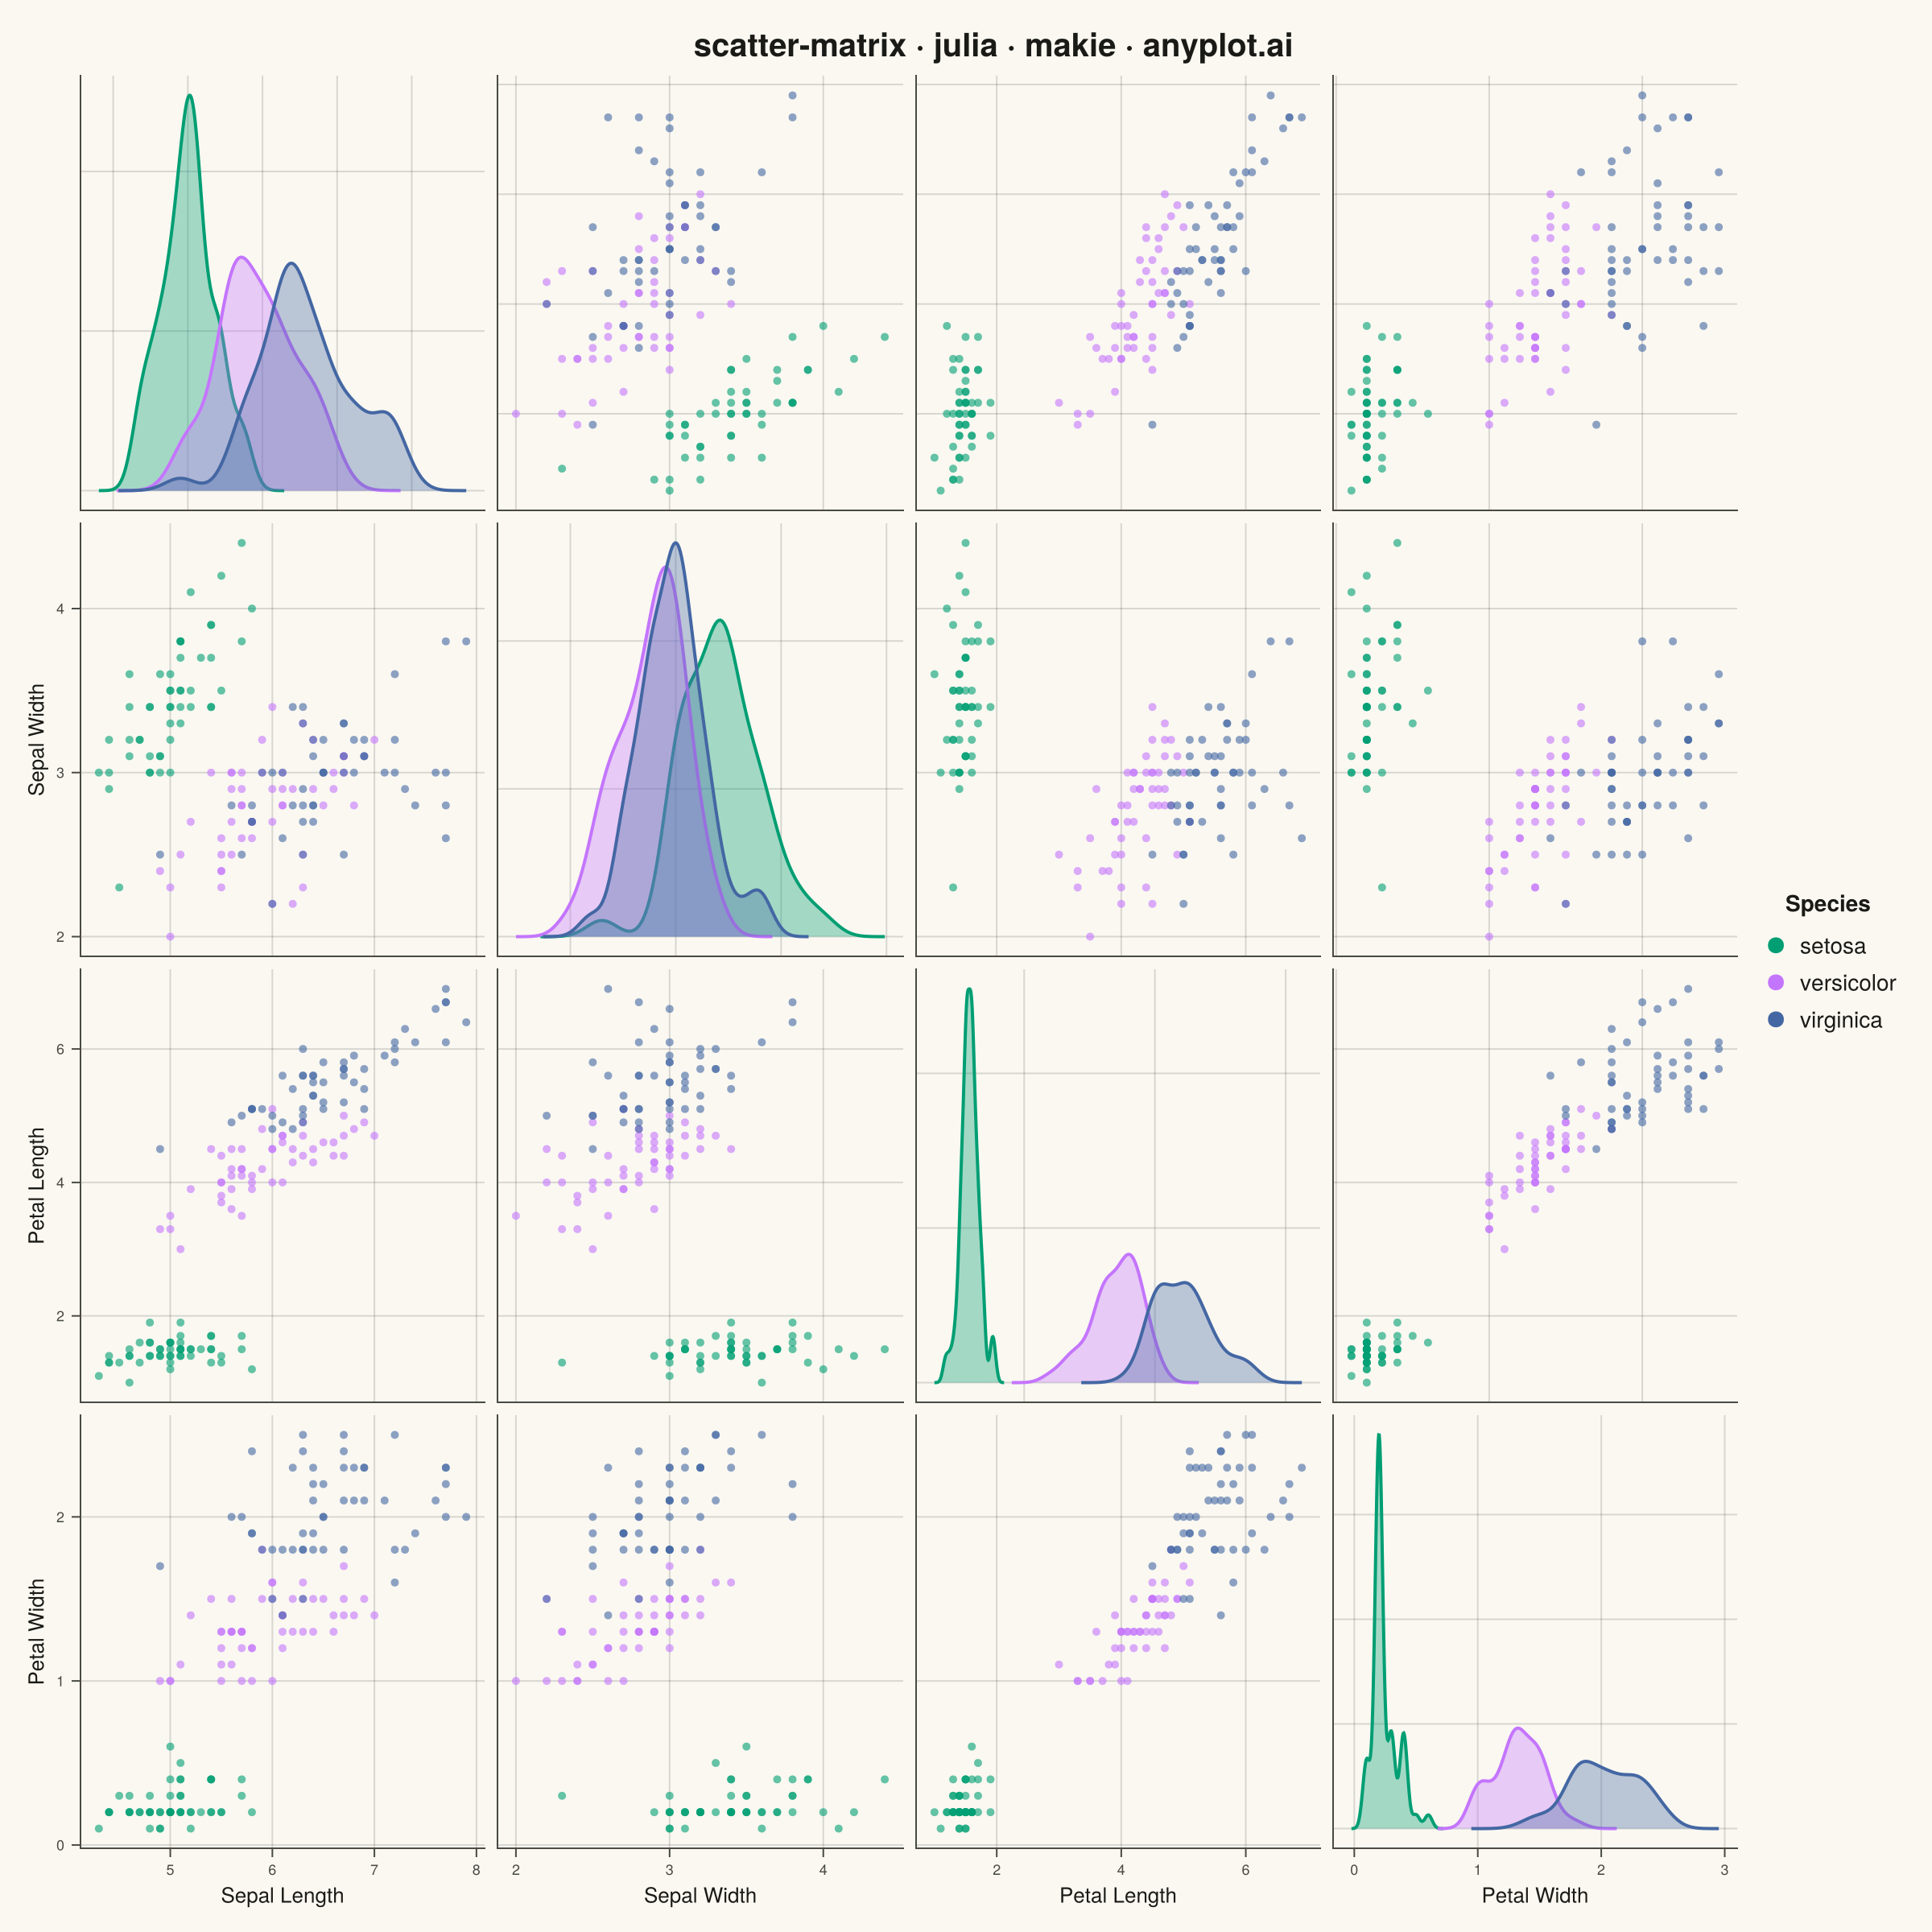
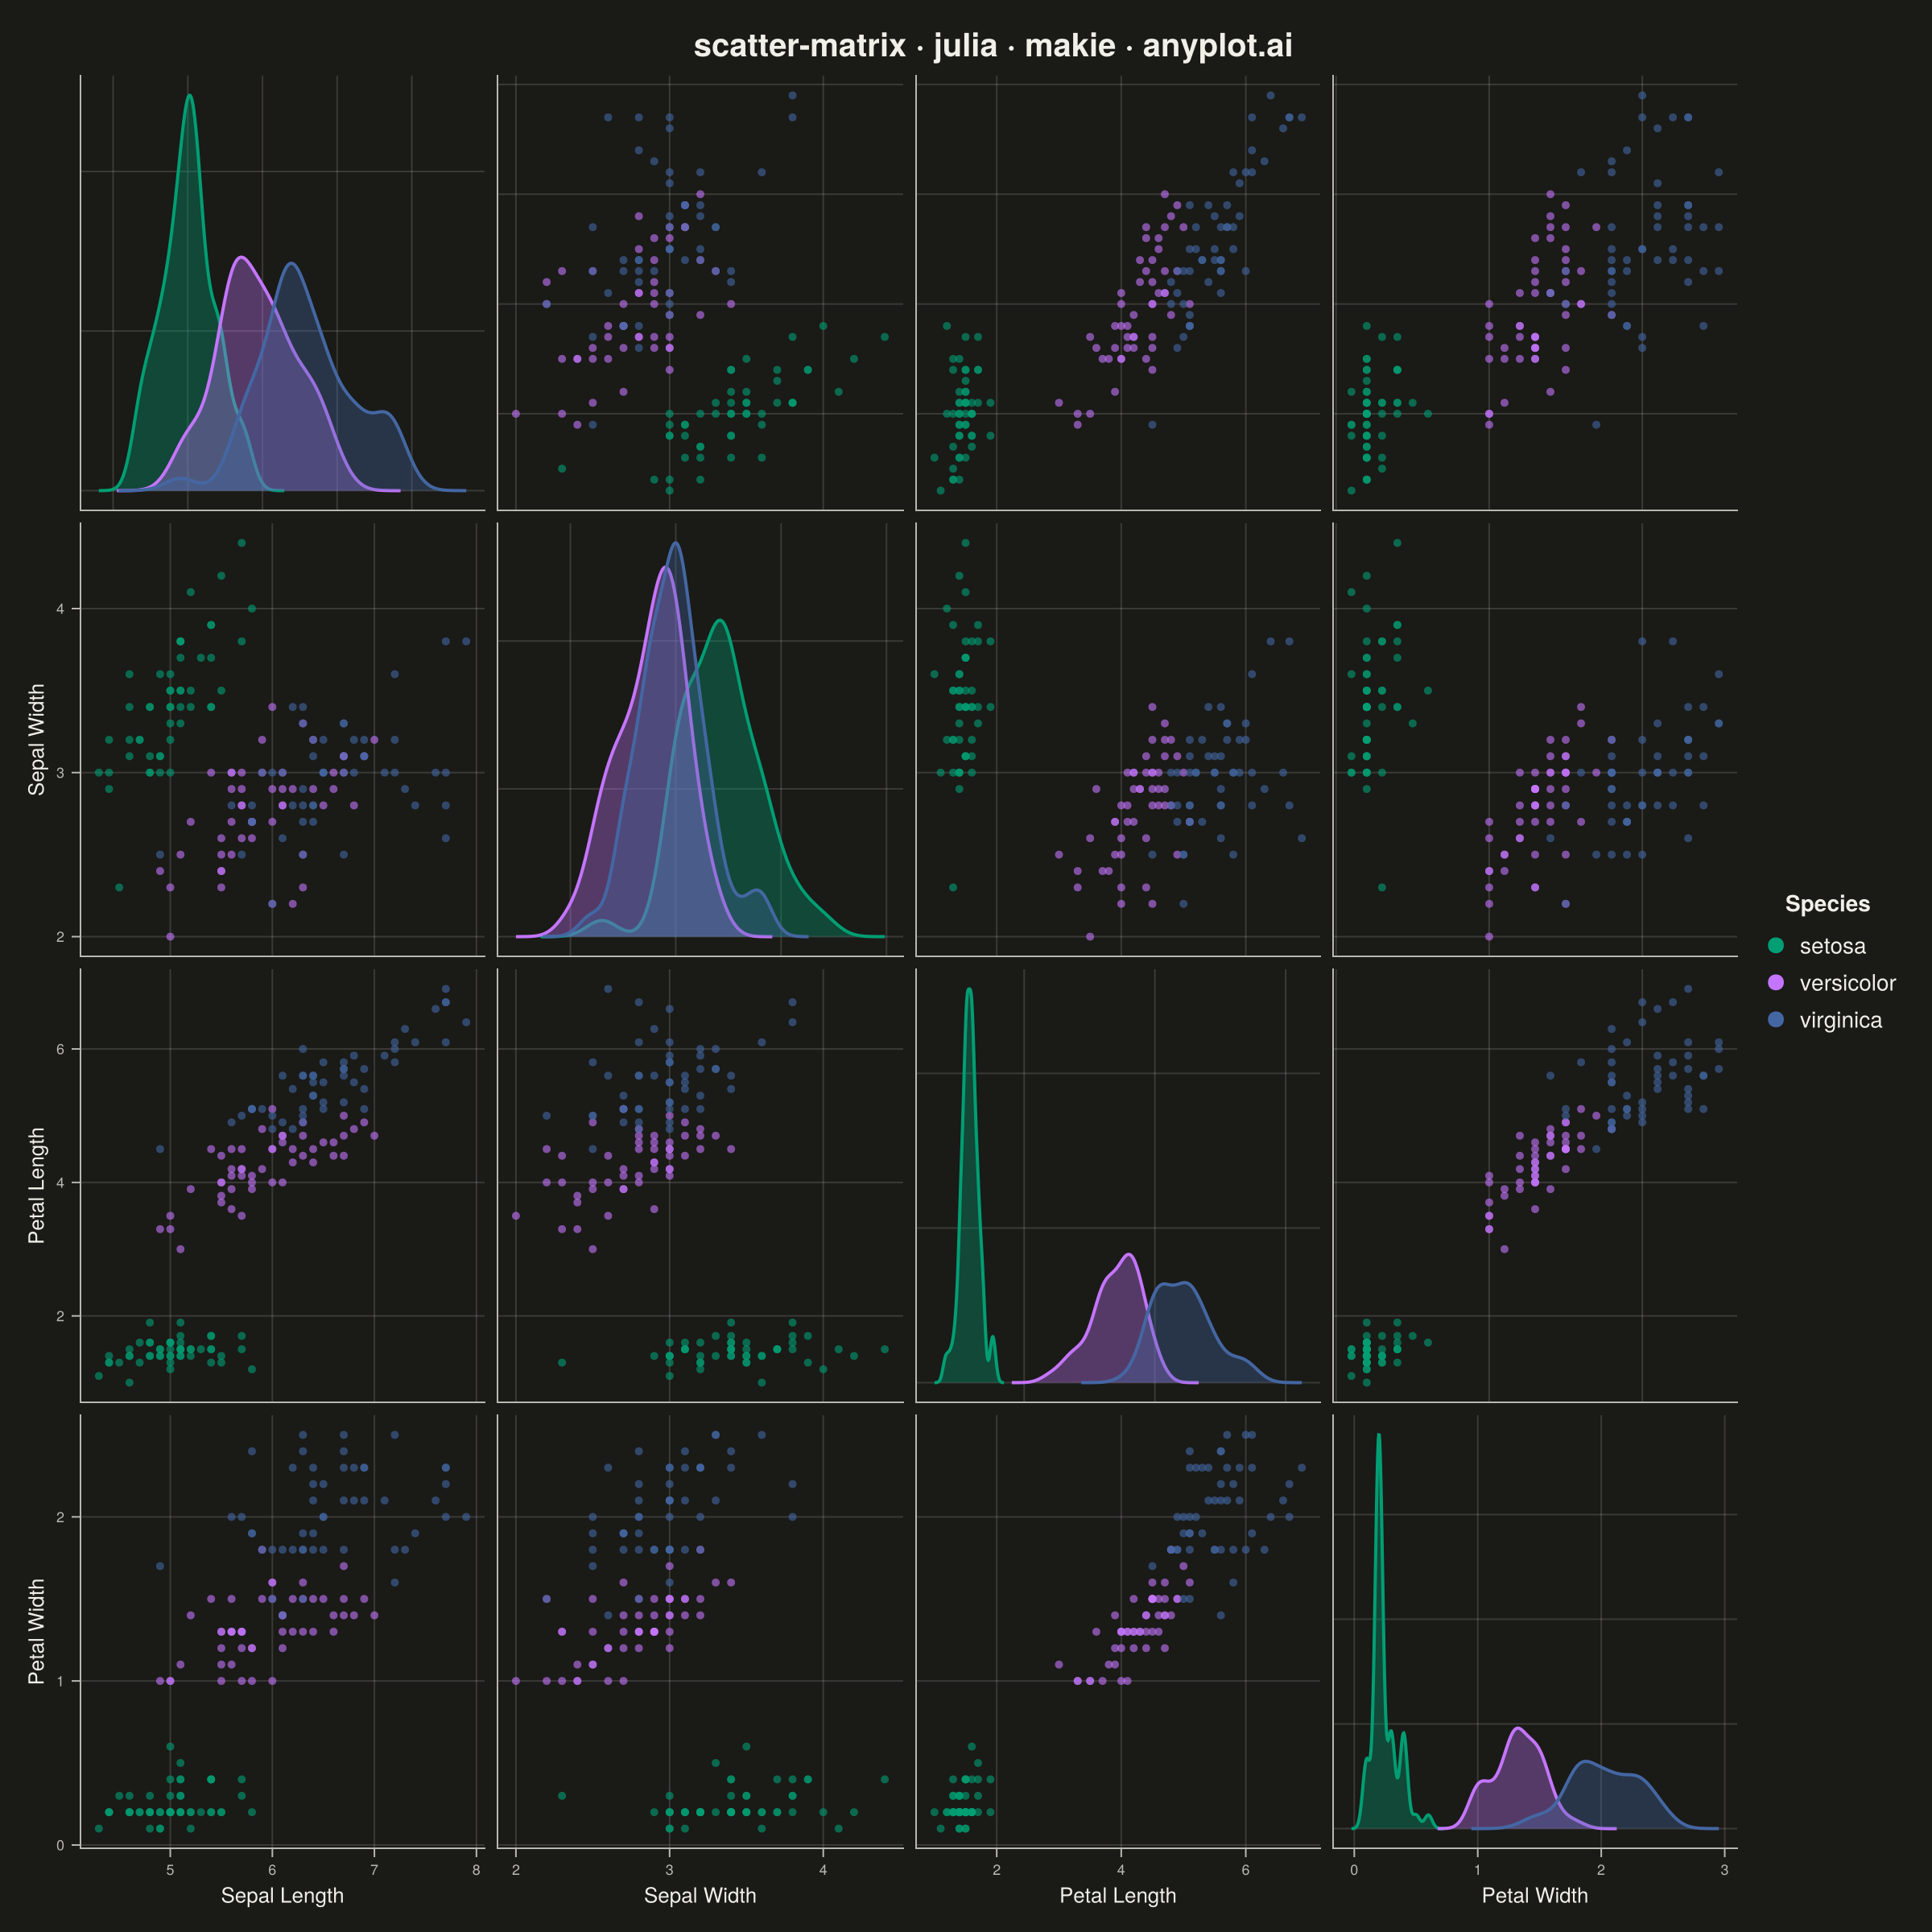
The same plot in 14 other libraries — Python: Altair, Bokeh, lets-plot, Matplotlib, Plotly, plotnine, Pygal, Seaborn; R: ggplot2; JavaScript: Chart.js, D3.js, Apache ECharts, Highcharts, MUI X Charts. Compare all 15 side by side: Scatter Plot Matrix in Python, R, Julia and JavaScript.
A grid of scatter plots showing all pairwise relationships between multiple variables, with histograms or kernel density estimates on the diagonal. This comprehensive visualization enables simultaneous exploration of correlations and distributions across an entire dataset, making it invaluable for understanding multivariate data structure at a glance. Also known as a pairplot or SPLOM (Scatter Plot Matrix).
# anyplot.ai
# scatter-matrix: Scatter Plot Matrix
# Library: makie 0.21.9 | Julia 1.11.9
# Quality: 91/100 | Created: 2026-09-09

using CairoMakie
using Colors
using RDatasets
using Random
using Statistics

Random.seed!(42)

# --- Theme tokens -------------------------------------------------------
THEME       = get(ENV, "ANYPLOT_THEME", "light")
PAGE_BG     = THEME == "light" ? colorant"#FAF8F1" : colorant"#1A1A17"
ELEVATED_BG = THEME == "light" ? colorant"#FFFDF6" : colorant"#242420"
INK         = THEME == "light" ? colorant"#1A1A17" : colorant"#F0EFE8"
INK_SOFT    = THEME == "light" ? colorant"#4A4A44" : colorant"#B8B7B0"
GRID_COLOR  = RGBAf(INK.r, INK.g, INK.b, 0.15)

IMPRINT_PALETTE = [
    colorant"#009E73", colorant"#C475FD", colorant"#4467A3", colorant"#BD8233",
    colorant"#AE3030", colorant"#2ABCCD", colorant"#954477", colorant"#99B314",
]

# --- Data -----------------------------------------------------------------
iris = dataset("datasets", "iris")

variables = [:SepalLength, :SepalWidth, :PetalLength, :PetalWidth]
var_labels = ["Sepal Length", "Sepal Width", "Petal Length", "Petal Width"]
n_vars = length(variables)

species_names = unique(iris.Species)
species_colors = Dict(sp => IMPRINT_PALETTE[i] for (i, sp) in enumerate(species_names))
point_colors = [species_colors[sp] for sp in iris.Species]

# Locate the most strongly correlated pair of variables to draw the eye
# toward a focal insight, rather than treating every panel identically.
cor_matrix = [cor(iris[!, variables[i]], iris[!, variables[j]]) for i in 1:n_vars, j in 1:n_vars]
best_row, best_col, best_r = 1, 2, 0.0
for i in 1:n_vars, j in 1:n_vars
    if i != j && abs(cor_matrix[i, j]) > best_r
        global best_row, best_col, best_r = i, j, abs(cor_matrix[i, j])
    end
end

# --- Plot -------------------------------------------------------------------
title_str = "scatter-matrix · julia · makie · anyplot.ai"

fig = Figure(
    resolution      = (1200, 1200),
    fontsize        = 14,
    backgroundcolor = PAGE_BG,
)

Label(fig[1, 1:(n_vars + 1)], title_str; fontsize = 20, color = INK, font = :bold)

axes = Matrix{Axis}(undef, n_vars, n_vars)

for row in 1:n_vars, col in 1:n_vars
    is_diag      = row == col
    is_focal     = !is_diag && (row, col) in ((best_row, best_col), (best_col, best_row))
    show_y       = col == 1 && !is_diag
    show_x       = row == n_vars
    spine_color  = is_focal ? IMPRINT_PALETTE[1] : INK_SOFT

    ax = Axis(
        fig[row + 1, col];
        backgroundcolor  = PAGE_BG,
        xlabel           = var_labels[col],
        ylabel           = var_labels[row],
        xlabelsize       = 13,
        ylabelsize       = 13,
        xlabelcolor      = INK,
        ylabelcolor      = INK,
        xlabelvisible    = show_x,
        ylabelvisible    = show_y,
        xticklabelsize   = 10,
        yticklabelsize   = 10,
        xticklabelcolor  = INK_SOFT,
        yticklabelcolor  = INK_SOFT,
        xticklabelsvisible = show_x,
        yticklabelsvisible  = show_y,
        xticksvisible    = show_x,
        yticksvisible    = show_y,
        xtickcolor       = INK_SOFT,
        ytickcolor       = INK_SOFT,
        leftspinecolor   = spine_color,
        bottomspinecolor = spine_color,
        topspinevisible    = is_focal,
        rightspinevisible  = is_focal,
        topspinecolor      = spine_color,
        rightspinecolor    = spine_color,
        spinewidth         = is_focal ? 2.5 : 1,
        xgridcolor         = GRID_COLOR,
        ygridcolor         = GRID_COLOR,
        xminorgridvisible  = false,
        yminorgridvisible  = false,
    )
    axes[row, col] = ax

    if is_diag
        ax.yticklabelsvisible = false
        ax.ylabelvisible      = false
        ax.yticksvisible      = false
        for sp in species_names
            vals = iris[iris.Species .== sp, variables[row]]
            density!(
                ax, vals;
                color       = (species_colors[sp], 0.35),
                strokecolor = species_colors[sp],
                strokewidth = 2,
            )
        end
    else
        scatter!(
            ax, iris[!, variables[col]], iris[!, variables[row]];
            color       = point_colors,
            alpha       = 0.6,
            markersize  = 7,
            strokewidth = 0,
        )
        if is_focal
            text!(
                ax, 0.05, 0.95;
                text      = "r = $(round(best_r, digits = 2))",
                space     = :relative,
                align     = (:left, :top),
                color     = IMPRINT_PALETTE[1],
                fontsize  = 12,
                font      = :bold,
            )
        end
    end
end

# Distinctive Makie SPLOM idiom: explicitly guarantee identical per-column /
# per-row ranges instead of relying on each Axis picking its own limits.
for col in 1:n_vars
    linkxaxes!(axes[:, col]...)
end
for row in 1:n_vars
    off_diag_in_row = [axes[row, col] for col in 1:n_vars if col != row]
    linkyaxes!(off_diag_in_row...)
end

legend_elements = [MarkerElement(color = species_colors[sp], marker = :circle, markersize = 14) for sp in species_names]
Legend(
    fig[2:(n_vars + 1), n_vars + 1],
    legend_elements, string.(species_names), "Species";
    labelcolor      = INK,
    titlecolor      = INK,
    backgroundcolor = ELEVATED_BG,
    framevisible    = false,
)

colgap!(fig.layout, 8)
rowgap!(fig.layout, 8)

# --- Save -------------------------------------------------------------------
save("plot-$(THEME).png", fig; px_per_unit = 2)
Runnable source as JSON, for any HTTP client: https://api.anyplot.ai/specs/scatter-matrix/makie/code. Any spec id and library id listed in llms-full.txt fit the same URL shape; every URL below is complete and callable.
{
  "spec_id": "scatter-matrix",
  "language": "julia",
  "library": "makie",
  "page": "https://anyplot.ai/scatter-matrix/julia/makie",
  "hub": "https://anyplot.ai/scatter-matrix",
  "code_json": "https://api.anyplot.ai/specs/scatter-matrix/makie/code",
  "spec_json": "https://api.anyplot.ai/specs/scatter-matrix",
  "render_light_png": "https://storage.googleapis.com/anyplot-images/plots/scatter-matrix/julia/makie/plot-light.png",
  "render_dark_png": "https://storage.googleapis.com/anyplot-images/plots/scatter-matrix/julia/makie/plot-dark.png",
  "quality_score": 91.0,
  "license": "MIT",
  "guide": "https://anyplot.ai/llms.txt"
}
Part of Scatter Plot Matrix on anyplot.ai.