The same plot in 14 other libraries — Python: Altair, Bokeh, lets-plot, Matplotlib, Plotly, plotnine, Pygal, Seaborn; Julia: Makie.jl; JavaScript: Chart.js, D3.js, Apache ECharts, Highcharts, MUI X Charts. Compare all 15 side by side: Scatter Plot Matrix in Python, R, Julia and JavaScript.
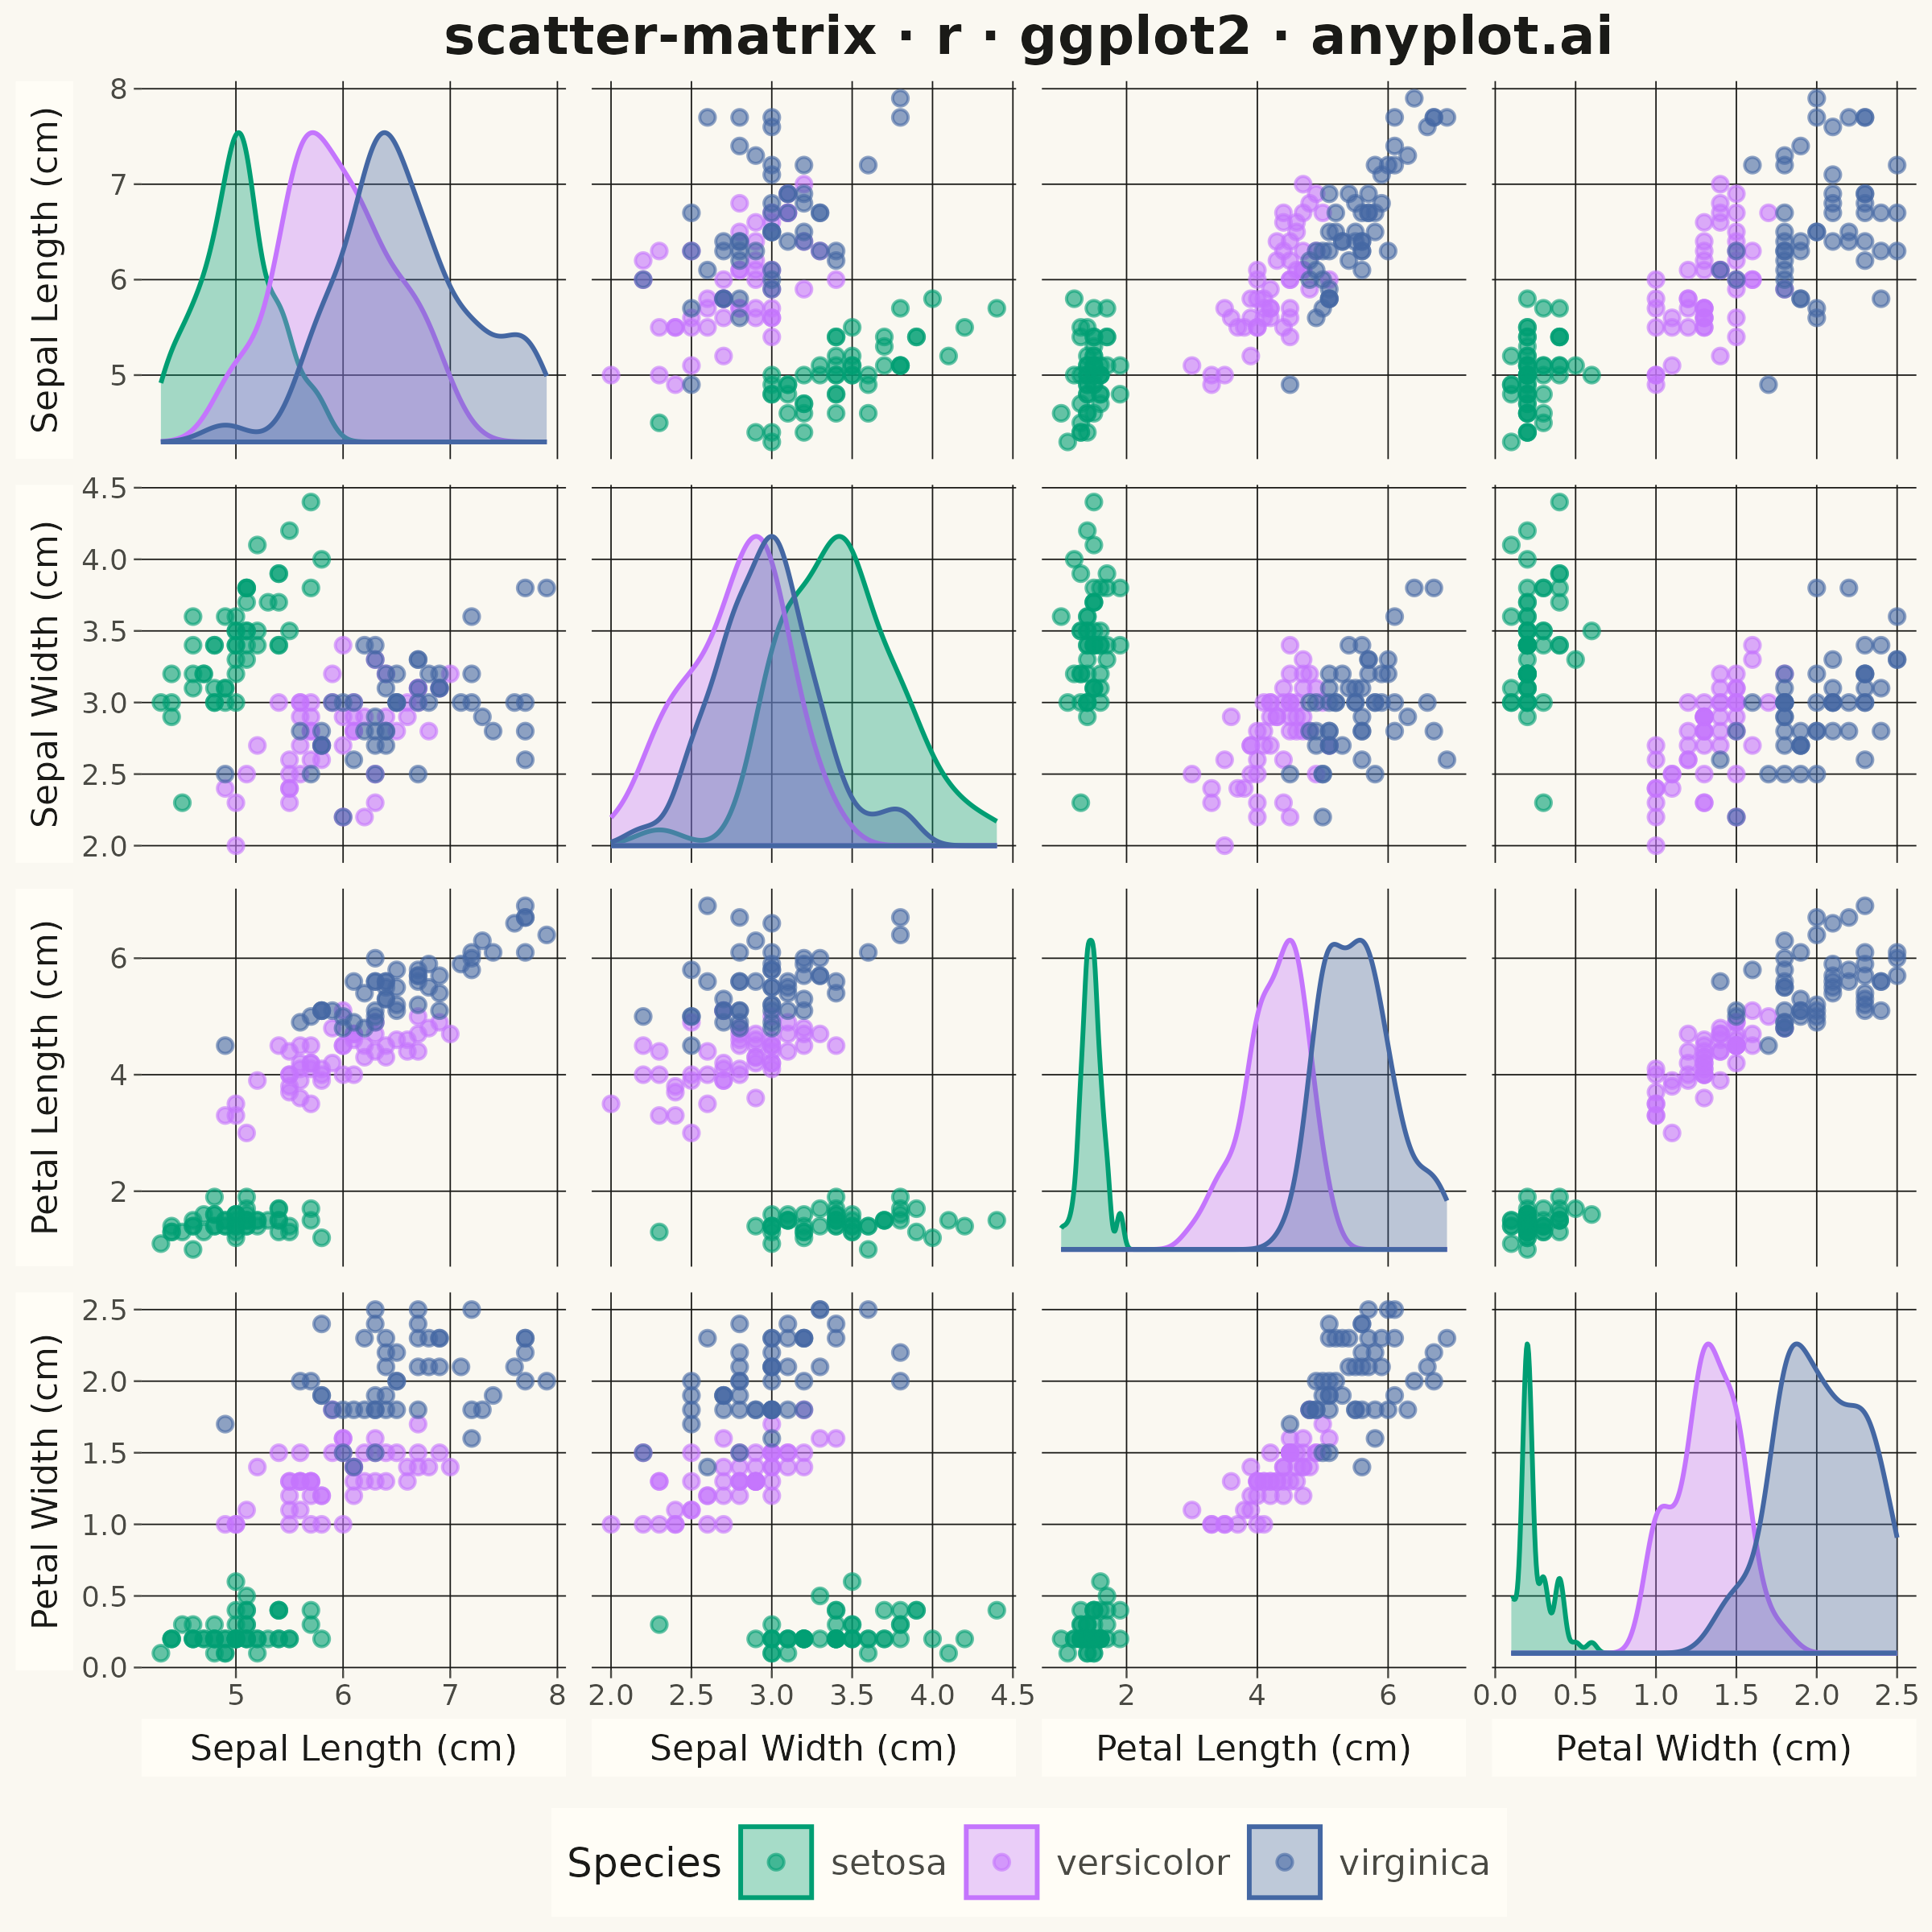
A grid of scatter plots showing all pairwise relationships between multiple variables, with histograms or kernel density estimates on the diagonal. This comprehensive visualization enables simultaneous exploration of correlations and distributions across an entire dataset, making it invaluable for understanding multivariate data structure at a glance. Also known as a pairplot or SPLOM (Scatter Plot Matrix).
#' anyplot.ai
#' scatter-matrix: Scatter Plot Matrix
#' Library: ggplot2 3.5.1 | R 4.4.1
#' Quality: 88/100 | Created: 2026-09-09

library(ggplot2)
library(dplyr)
library(ragg)

set.seed(42)

# --- Theme tokens -----------------------------------------------------------
THEME       <- Sys.getenv("ANYPLOT_THEME", "light")
PAGE_BG     <- if (THEME == "light") "#FAF8F1" else "#1A1A17"
ELEVATED_BG <- if (THEME == "light") "#FFFDF6" else "#242420"
INK         <- if (THEME == "light") "#1A1A17" else "#F0EFE8"
INK_SOFT    <- if (THEME == "light") "#4A4A44" else "#B8B7B0"
IMPRINT_PALETTE <- c(
  "#009E73", # 1 - first categorical series (brand green)
  "#C475FD", # 2 - lavender
  "#4467A3", # 3 - blue
  "#BD8233", # 4 - ochre
  "#AE3030", # 5 - matte red
  "#2ABCCD", # 6 - cyan
  "#954477", # 7 - rose
  "#99B314"  # 8 - lime
)

# --- Data ---------------------------------------------------------------
# Four flower measurements from the classic iris dataset, compared pairwise
# across the three species so correlations and cluster separation both show.
vars <- c("Sepal.Length", "Sepal.Width", "Petal.Length", "Petal.Width")
var_labels <- c(
  "Sepal.Length" = "Sepal Length (cm)",
  "Sepal.Width"  = "Sepal Width (cm)",
  "Petal.Length" = "Petal Length (cm)",
  "Petal.Width"  = "Petal Width (cm)"
)

pairs_list <- list()
idx <- 1
for (rv in vars) {
  for (cv in vars) {
    if (rv == cv) next
    pairs_list[[idx]] <- tibble::tibble(
      row_var = factor(rv, levels = vars),
      col_var = factor(cv, levels = vars),
      x       = iris[[cv]],
      y       = iris[[rv]],
      species = iris$Species
    )
    idx <- idx + 1
  }
}
pairs_df <- bind_rows(pairs_list)

# Diagonal density curves. Each species' KDE is (1) estimated only over that
# variable's own data range (`from`/`to`), so the shared free x-scale for the
# column is never pulled wider than the real min/max, and (2) normalized to
# its OWN peak (not a global max across species) before being rescaled into
# the row's data-value range, so every species curve reaches the same
# relative height regardless of how much taller one species' peak density is
# than another's (e.g. Petal.Width: setosa's peak is ~6x virginica's).
diag_list <- list()
idx <- 1
for (v in vars) {
  var_data  <- iris[[v]]
  var_range <- range(var_data)
  dens_df <- bind_rows(lapply(levels(iris$Species), function(sp) {
    d <- density(var_data[iris$Species == sp], from = var_range[1], to = var_range[2])
    tibble::tibble(x = d$x, dens = d$y / max(d$y), species = sp)
  }))
  diag_list[[idx]] <- dens_df %>%
    mutate(
      row_var = factor(v, levels = vars),
      col_var = factor(v, levels = vars),
      ymin    = var_range[1],
      ymax    = var_range[1] + dens * diff(var_range) * 0.9
    )
  idx <- idx + 1
}
diag_df <- bind_rows(diag_list)

# --- Plot -----------------------------------------------------------------
p <- ggplot() +
  geom_point(
    data  = pairs_df,
    aes(x = x, y = y, color = species),
    size = 1.3, alpha = 0.6
  ) +
  geom_ribbon(
    data  = diag_df,
    aes(x = x, ymin = ymin, ymax = ymax, fill = species, color = species, group = species),
    alpha = 0.35, linewidth = 0.5
  ) +
  facet_grid(
    row_var ~ col_var,
    scales   = "free",
    switch   = "both",
    labeller = labeller(row_var = as_labeller(var_labels), col_var = as_labeller(var_labels))
  ) +
  scale_color_manual(values = IMPRINT_PALETTE, name = "Species") +
  scale_fill_manual(values = IMPRINT_PALETTE, name = "Species") +
  labs(
    title = "scatter-matrix · r · ggplot2 · anyplot.ai",
    x = NULL, y = NULL
  ) +
  theme_minimal(base_size = 7) +
  theme(
    plot.background    = element_rect(fill = PAGE_BG, color = PAGE_BG),
    panel.background   = element_rect(fill = PAGE_BG, color = NA),
    panel.grid.major   = element_line(color = INK, linewidth = 0.15),
    panel.grid.minor   = element_blank(),
    panel.spacing      = unit(0.4, "lines"),
    axis.title         = element_blank(),
    axis.text          = element_text(color = INK_SOFT, size = 6.5),
    axis.ticks         = element_line(color = INK_SOFT, linewidth = 0.2),
    strip.placement    = "outside",
    strip.background   = element_rect(fill = ELEVATED_BG, color = NA),
    strip.text         = element_text(color = INK, size = 8, face = "plain"),
    plot.title         = element_text(color = INK, size = 12, face = "bold", hjust = 0.5),
    legend.position    = "bottom",
    legend.background  = element_rect(fill = ELEVATED_BG, color = NA),
    legend.text        = element_text(color = INK_SOFT, size = 8),
    legend.title       = element_text(color = INK, size = 9)
  )

# --- Save -------------------------------------------------------------------
ggsave(
  filename = sprintf("plot-%s.png", THEME),
  plot     = p,
  device   = ragg::agg_png,
  width    = 6,
  height   = 6,
  units    = "in",
  dpi      = 400
)
Runnable source as JSON, for any HTTP client: https://api.anyplot.ai/specs/scatter-matrix/ggplot2/code. Any spec id and library id listed in llms-full.txt fit the same URL shape; every URL below is complete and callable.
{
  "spec_id": "scatter-matrix",
  "language": "r",
  "library": "ggplot2",
  "page": "https://anyplot.ai/scatter-matrix/r/ggplot2",
  "hub": "https://anyplot.ai/scatter-matrix",
  "code_json": "https://api.anyplot.ai/specs/scatter-matrix/ggplot2/code",
  "spec_json": "https://api.anyplot.ai/specs/scatter-matrix",
  "render_light_png": "https://storage.googleapis.com/anyplot-images/plots/scatter-matrix/r/ggplot2/plot-light.png",
  "render_dark_png": "https://storage.googleapis.com/anyplot-images/plots/scatter-matrix/r/ggplot2/plot-dark.png",
  "quality_score": 88.0,
  "license": "MIT",
  "guide": "https://anyplot.ai/llms.txt"
}
Part of Scatter Plot Matrix on anyplot.ai.