The same plot in 14 other libraries — JavaScript: Chart.js, D3.js, Highcharts, MUI X Charts; Python: Altair, Bokeh, lets-plot, Matplotlib, Plotly, plotnine, Pygal, Seaborn; R: ggplot2; Julia: Makie.jl. Compare all 15 side by side: Scatter Plot Matrix in Python, R, Julia and JavaScript.
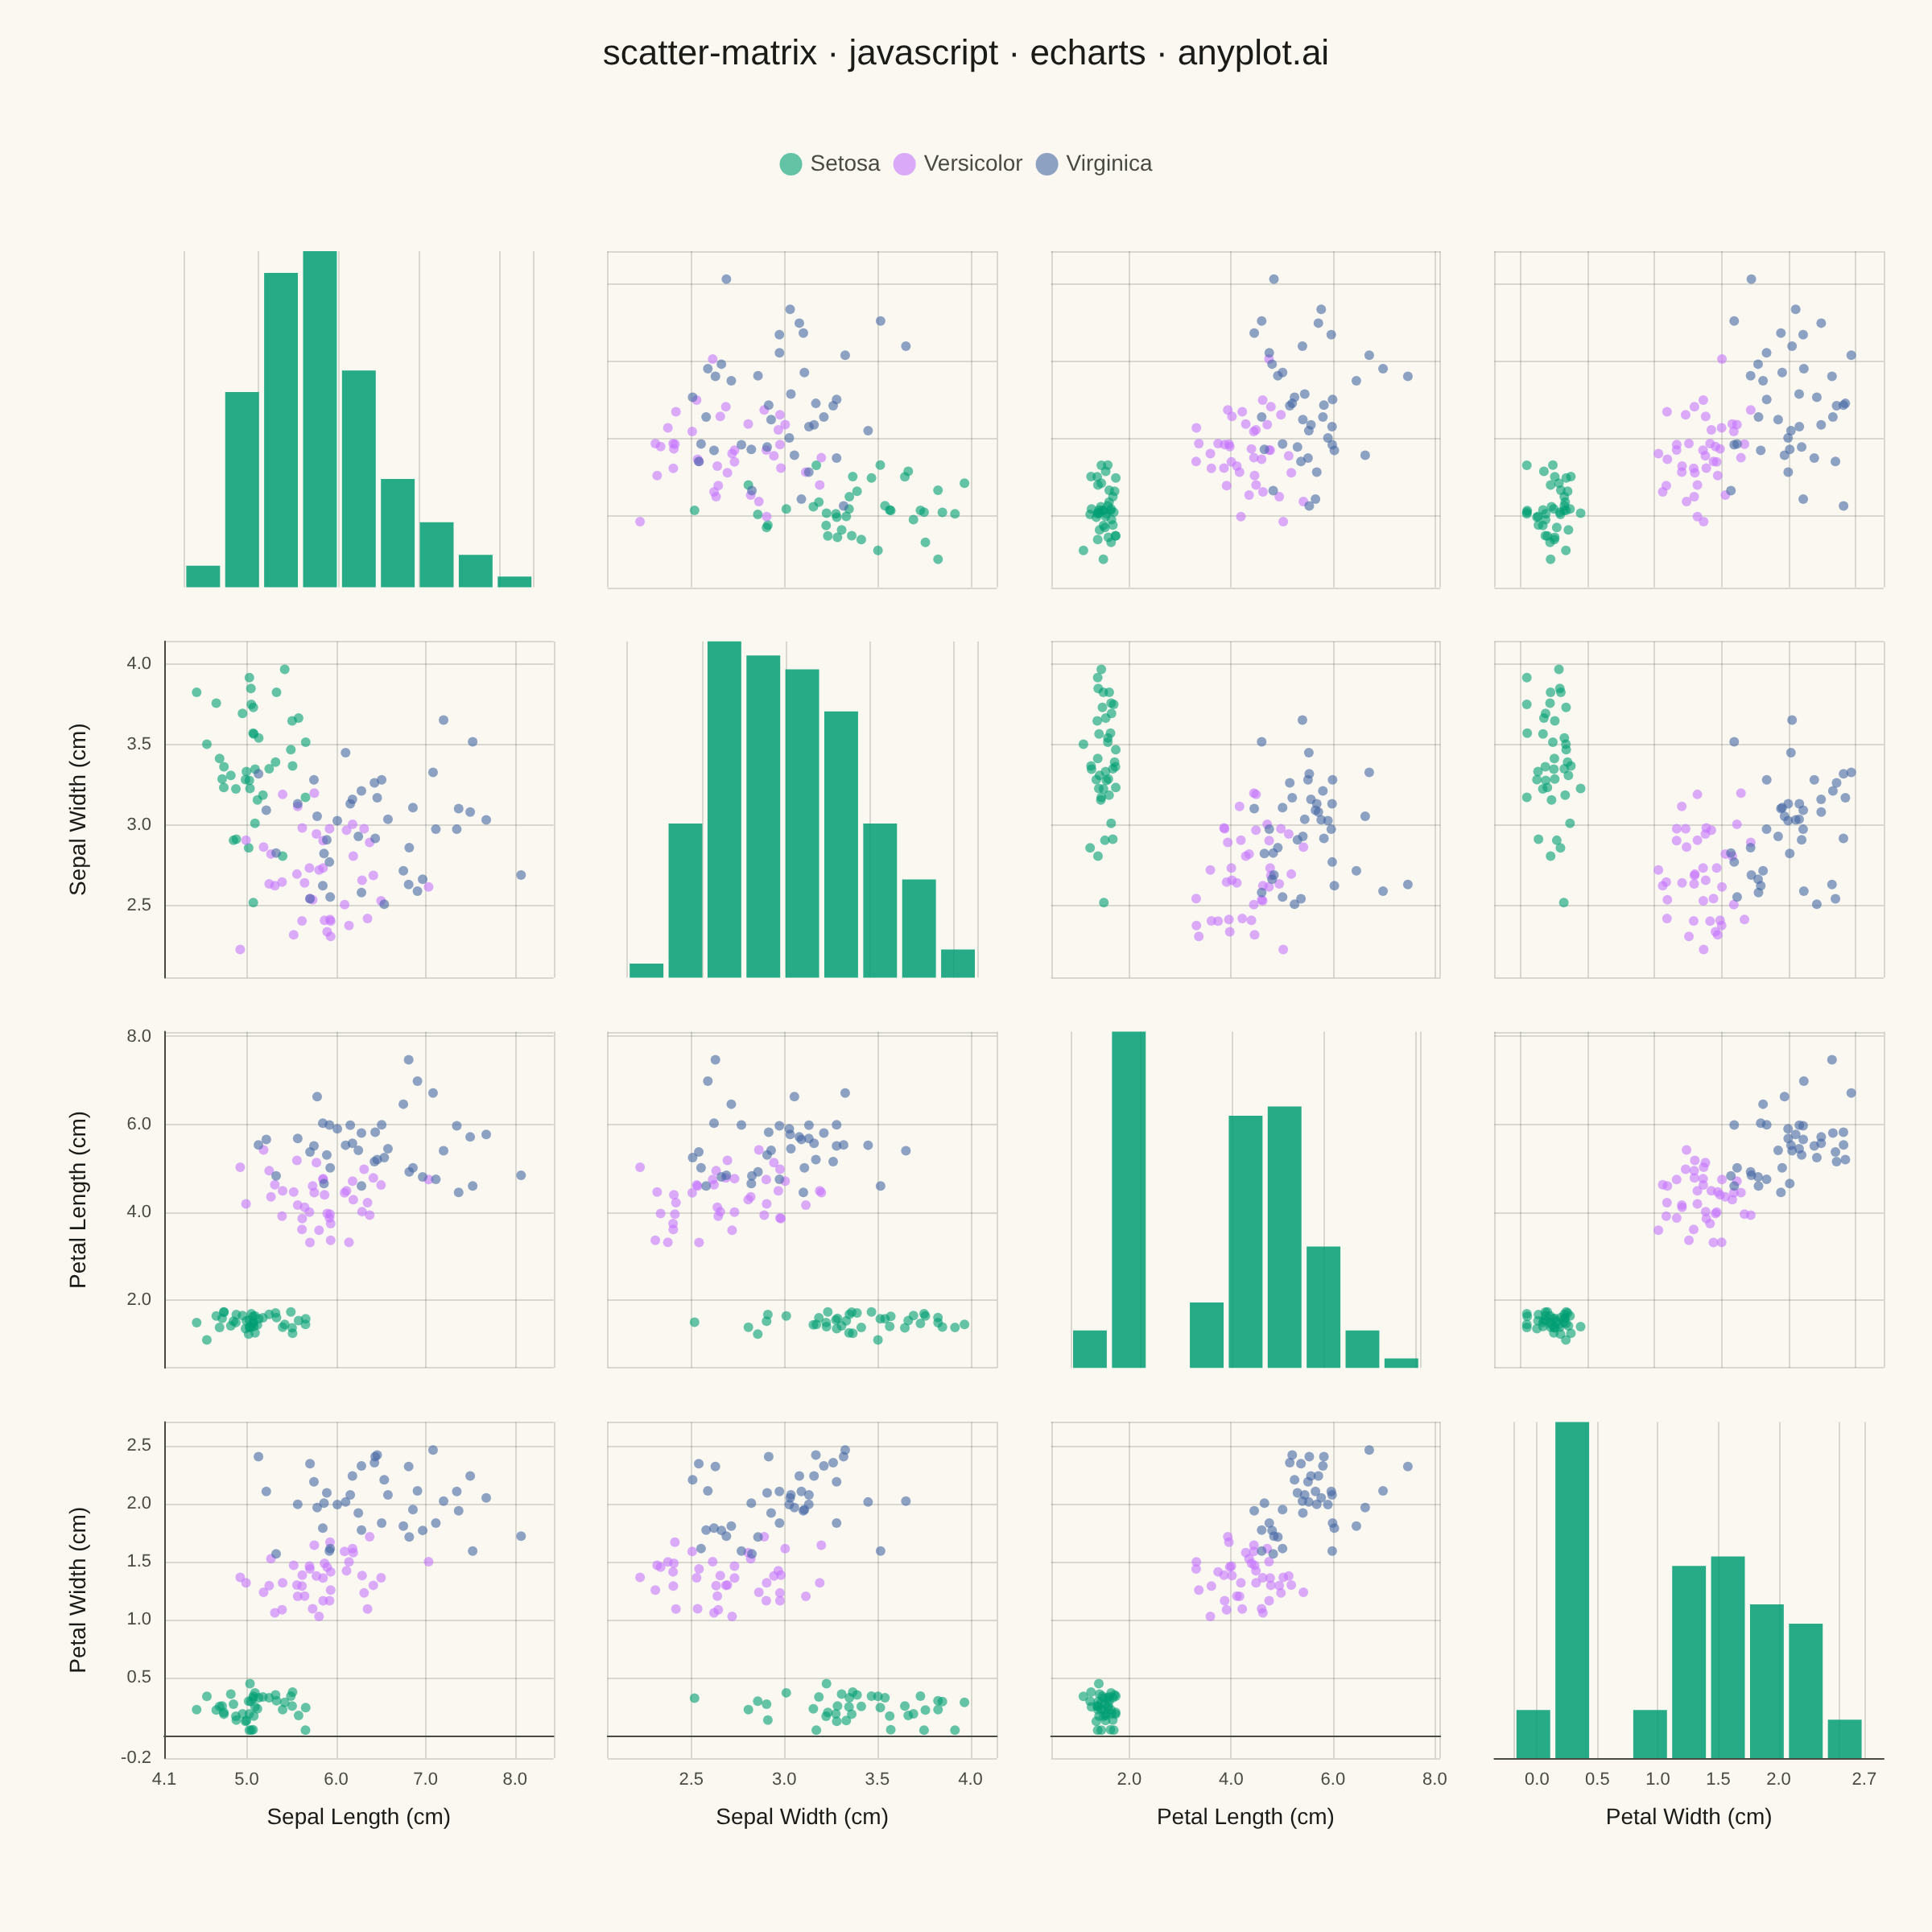
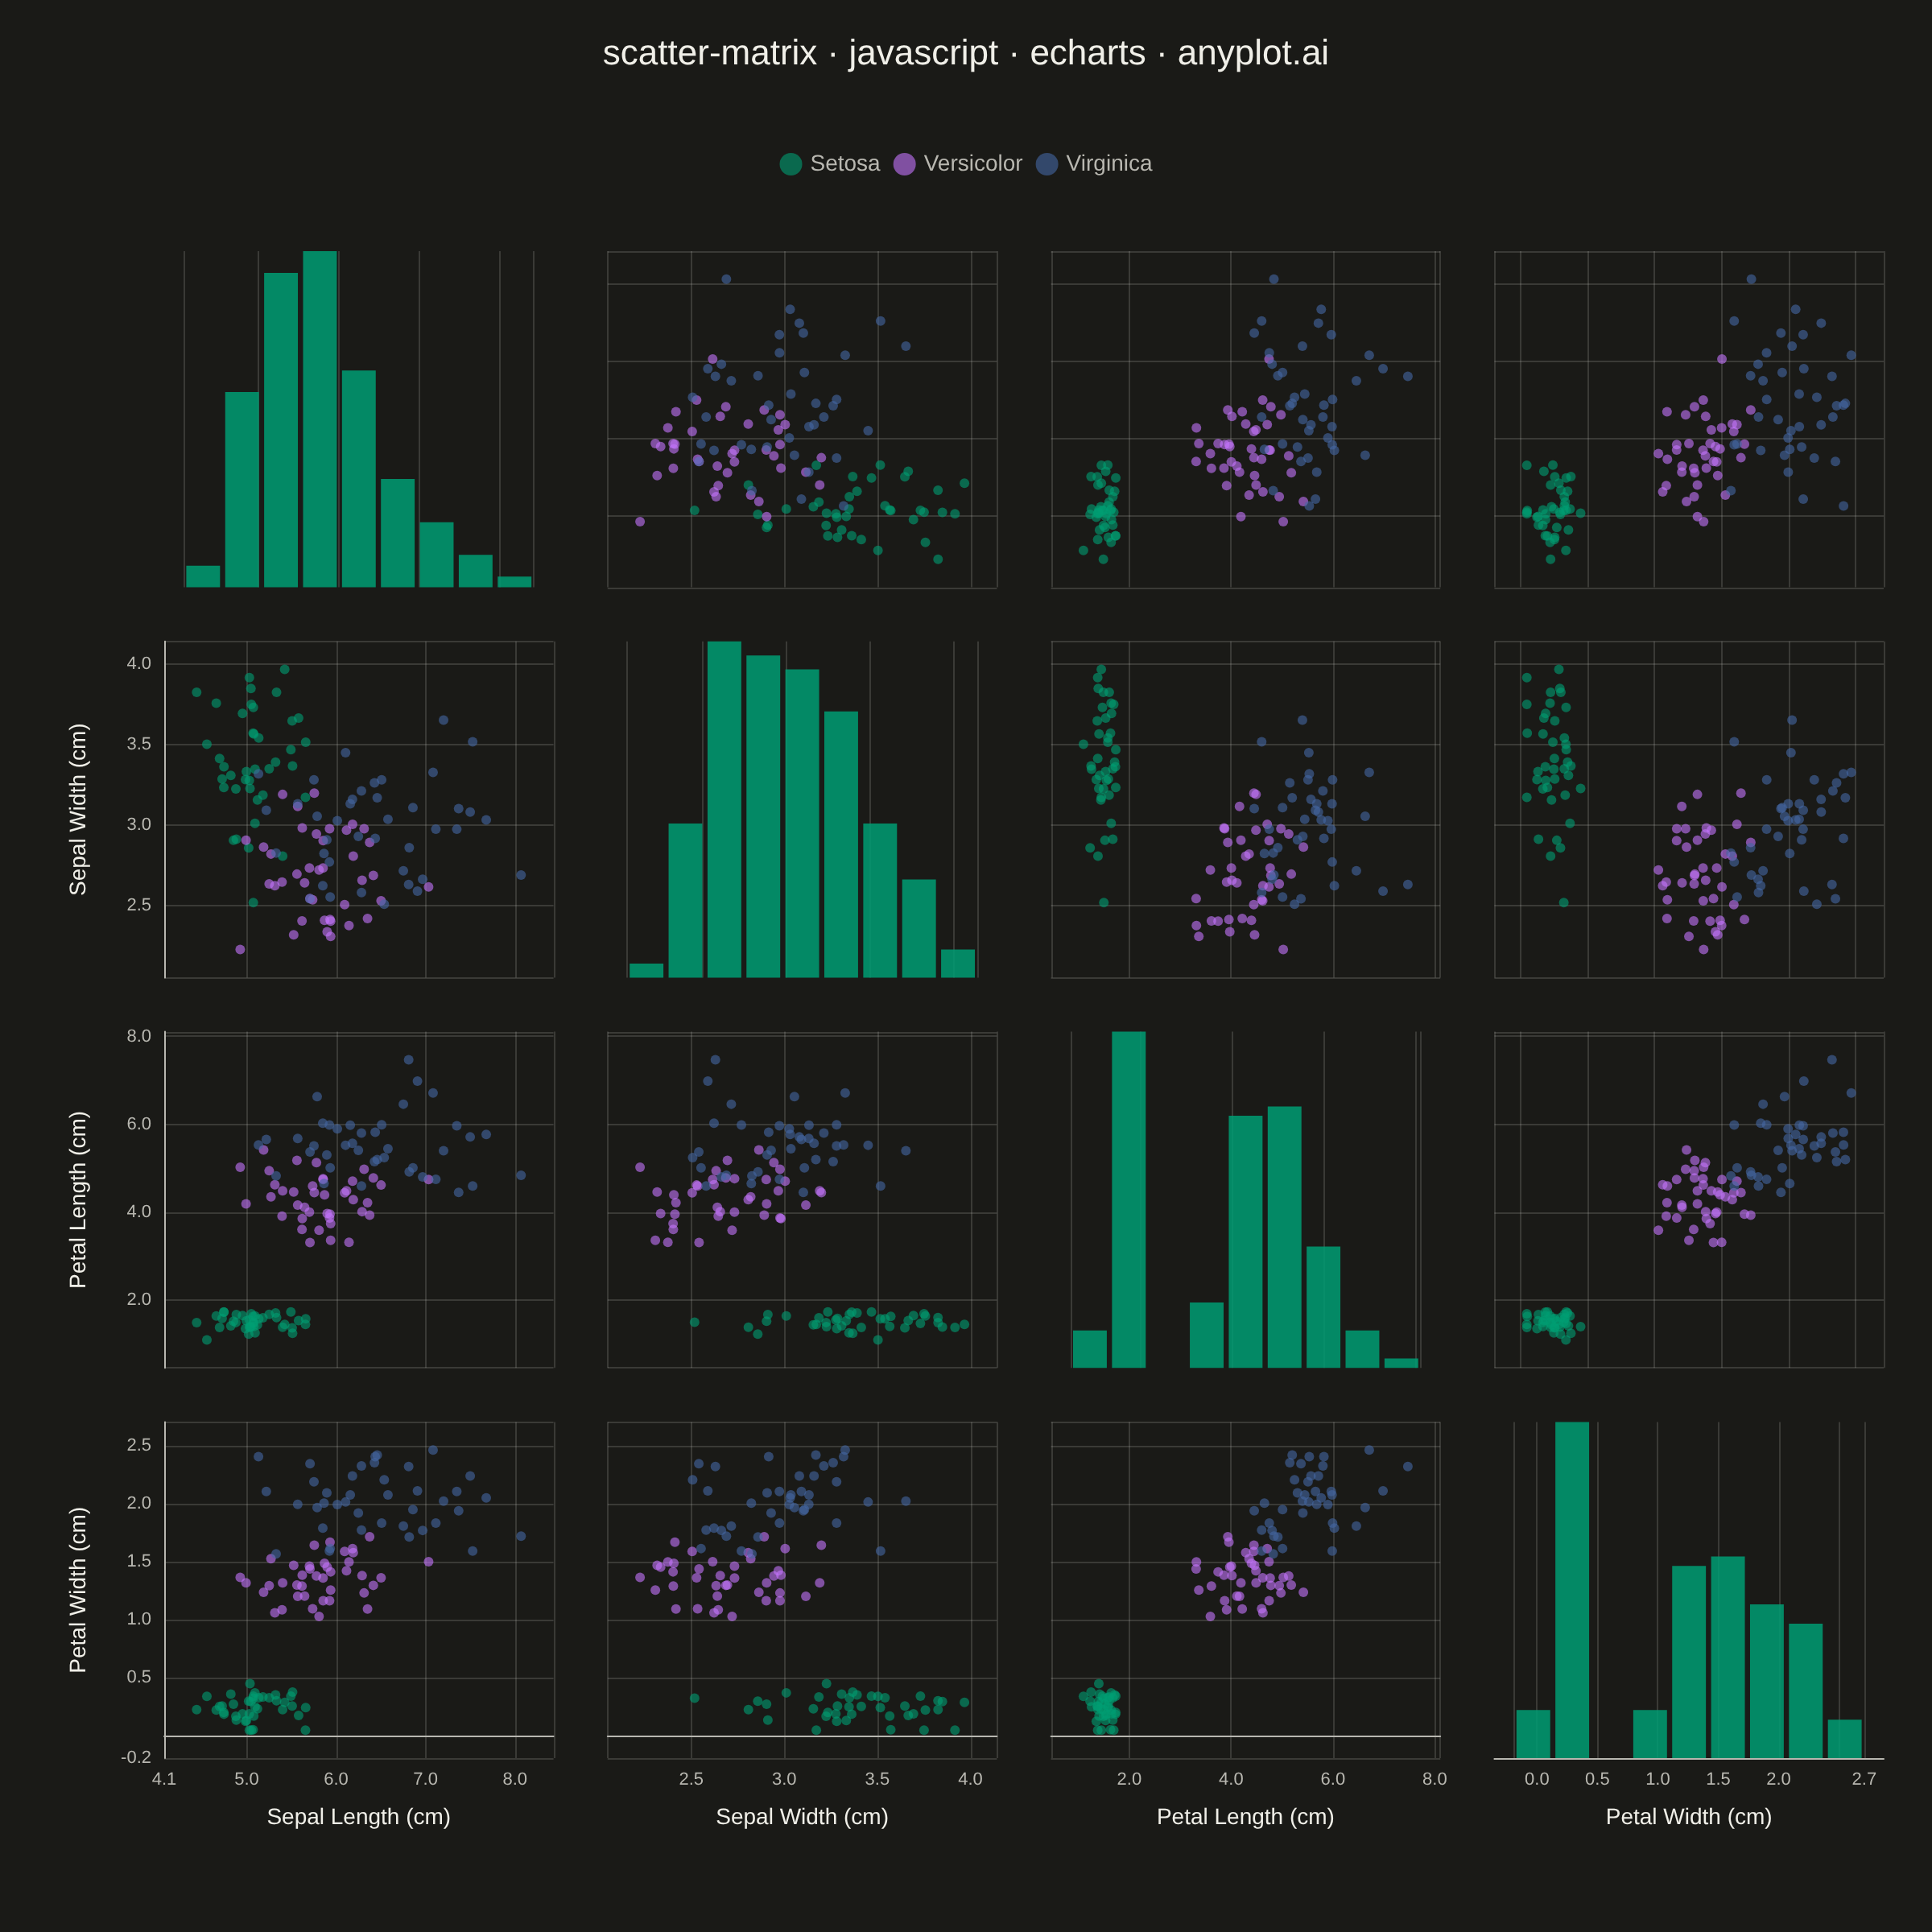
A grid of scatter plots showing all pairwise relationships between multiple variables, with histograms or kernel density estimates on the diagonal. This comprehensive visualization enables simultaneous exploration of correlations and distributions across an entire dataset, making it invaluable for understanding multivariate data structure at a glance. Also known as a pairplot or SPLOM (Scatter Plot Matrix).
// anyplot.ai
// scatter-matrix: Scatter Plot Matrix
// Library: echarts 6.1.0 | JavaScript 22.23.2
// Quality: 88/100 | Created: 2026-09-09
//# anyplot-orientation: square

const t = window.ANYPLOT_TOKENS;
const size = window.ANYPLOT_SIZE;

// --- Data (in-memory, deterministic) ----------------------------------------
// Iris-like flower measurements: 3 species x 40 points x 4 variables.
function makeLcg(seed) {
  let state = seed >>> 0;
  return function () {
    state = (state * 1664525 + 1013904223) >>> 0;
    return state / 4294967296;
  };
}
const rng = makeLcg(42);
function randNormal(mean, std) {
  const u1 = Math.max(rng(), 1e-9);
  const u2 = rng();
  const z = Math.sqrt(-2 * Math.log(u1)) * Math.cos(2 * Math.PI * u2);
  return mean + z * std;
}

const variables = ["Sepal Length", "Sepal Width", "Petal Length", "Petal Width"];
const axisNames = variables.map((v) => `${v} (cm)`);
const species = [
  { name: "Setosa", means: [5.0, 3.4, 1.5, 0.25], stds: [0.35, 0.38, 0.17, 0.1] },
  { name: "Versicolor", means: [5.9, 2.77, 4.26, 1.33], stds: [0.51, 0.31, 0.47, 0.2] },
  { name: "Virginica", means: [6.59, 2.97, 5.55, 2.03], stds: [0.64, 0.32, 0.55, 0.27] },
];
const pointsPerSpecies = 40;

const points = [];
species.forEach((sp, speciesIndex) => {
  for (let i = 0; i < pointsPerSpecies; i++) {
    const values = sp.means.map((mean, v) => Math.max(0.05, randNormal(mean, sp.stds[v])));
    points.push({ values, speciesIndex });
  }
});

// Shared axis ranges per variable, padded, so columns/rows align across cells.
const varMin = variables.map((_, v) => Math.min(...points.map((p) => p.values[v])));
const varMax = variables.map((_, v) => Math.max(...points.map((p) => p.values[v])));
const varRange = variables.map((_, v) => {
  const pad = (varMax[v] - varMin[v]) * 0.1;
  return [varMin[v] - pad, varMax[v] + pad];
});

// --- Layout: N x N grid of value-axis cartesians -----------------------------
const N = variables.length;
const outerLeft = 8.5;
const outerRight = 2.5;
const outerTop = 13;
const outerBottom = 9;
const gap = 2.8;
const cellW = (100 - outerLeft - outerRight - gap * (N - 1)) / N;
const cellH = (100 - outerTop - outerBottom - gap * (N - 1)) / N;
const cellWpx = (size.width * cellW) / 100;

const grids = [];
const xAxes = [];
const yAxes = [];
const series = [];

const histBins = 9;
const barWidth = Math.max(2, (cellWpx / histBins) * 0.78);

// Regular split-line ticks near a forced min/max label collide with it
// (e.g. "2.5" running into "2.7"); hide any regular tick that lands within
// 8% of the range from the forced edge, keeping the forced edge label itself.
function edgeSafeFormatter([lo, hi], showMin, showMax) {
  const thresh = (hi - lo) * 0.08;
  return (val) => {
    if (showMax && val !== hi && Math.abs(val - hi) < thresh) return "";
    if (showMin && val !== lo && Math.abs(val - lo) < thresh) return "";
    return val.toFixed(1);
  };
}

for (let row = 0; row < N; row++) {
  for (let col = 0; col < N; col++) {
    const idx = row * N + col;
    const left = outerLeft + col * (cellW + gap);
    const top = outerTop + row * (cellH + gap);
    grids.push({ left: `${left}%`, top: `${top}%`, width: `${cellW}%`, height: `${cellH}%` });

    const isBottomRow = row === N - 1;
    const isLeftCol = col === 0;

    xAxes.push({
      gridIndex: idx,
      type: "value",
      min: varRange[col][0],
      max: varRange[col][1],
      name: isBottomRow ? axisNames[col] : "",
      nameLocation: "middle",
      nameGap: 30,
      nameTextStyle: { color: t.ink, fontSize: 14 },
      axisLabel: {
        show: isBottomRow,
        color: t.inkSoft,
        fontSize: 11,
        formatter: edgeSafeFormatter(varRange[col], col === 0, col === N - 1),
        showMinLabel: col === 0,
        showMaxLabel: col === N - 1,
      },
      axisTick: { show: false },
      axisLine: { show: isBottomRow, lineStyle: { color: t.inkSoft } },
      splitLine: { show: true, lineStyle: { color: t.grid } },
    });

    if (row === col) {
      // Diagonal: histogram of this variable across all species.
      const [lo, hi] = varRange[col];
      const binWidth = (hi - lo) / histBins;
      const counts = new Array(histBins).fill(0);
      points.forEach((p) => {
        const bin = Math.min(histBins - 1, Math.floor((p.values[col] - lo) / binWidth));
        counts[bin] += 1;
      });
      const maxCount = Math.max(...counts);
      const barData = counts.map((c, b) => [lo + (b + 0.5) * binWidth, c]);

      yAxes.push({
        gridIndex: idx,
        type: "value",
        min: 0,
        max: maxCount,
        name: "",
        axisLabel: { show: false },
        axisTick: { show: false },
        axisLine: { show: false },
        splitLine: { show: false },
      });

      series.push({
        type: "bar",
        xAxisIndex: idx,
        yAxisIndex: idx,
        data: barData,
        barWidth,
        itemStyle: { color: t.palette[0], opacity: 0.85 },
        silent: true,
      });
    } else {
      yAxes.push({
        gridIndex: idx,
        type: "value",
        min: varRange[row][0],
        max: varRange[row][1],
        name: isLeftCol ? axisNames[row] : "",
        nameLocation: "middle",
        nameGap: 46,
        nameTextStyle: { color: t.ink, fontSize: 14 },
        axisLabel: {
          show: isLeftCol,
          color: t.inkSoft,
          fontSize: 11,
          formatter: edgeSafeFormatter(varRange[row], row === N - 1, row === 0),
          showMinLabel: row === N - 1,
          showMaxLabel: row === 0,
        },
        axisTick: { show: false },
        axisLine: { show: isLeftCol, lineStyle: { color: t.inkSoft } },
        splitLine: { show: true, lineStyle: { color: t.grid } },
      });

      species.forEach((sp, speciesIndex) => {
        const cellPoints = points
          .filter((p) => p.speciesIndex === speciesIndex)
          .map((p) => [p.values[col], p.values[row]]);
        series.push({
          name: sp.name,
          type: "scatter",
          xAxisIndex: idx,
          yAxisIndex: idx,
          data: cellPoints,
          symbolSize: 6,
          itemStyle: { color: t.palette[speciesIndex], opacity: 0.6 },
        });
      });
    }
  }
}

// --- Init + Option ------------------------------------------------------------
const chart = echarts.init(document.getElementById("container"));

chart.setOption({
  animation: false,
  backgroundColor: "transparent",
  title: {
    text: "scatter-matrix · javascript · echarts · anyplot.ai",
    left: "center",
    top: "1.5%",
    textStyle: { color: t.ink, fontSize: 22, fontWeight: 500 },
  },
  legend: {
    data: species.map((sp) => sp.name),
    top: "7.5%",
    left: "center",
    itemWidth: 14,
    itemHeight: 14,
    textStyle: { color: t.inkSoft, fontSize: 14 },
  },
  grid: grids,
  xAxis: xAxes,
  yAxis: yAxes,
  series,
});
Runnable source as JSON, for any HTTP client: https://api.anyplot.ai/specs/scatter-matrix/echarts/code. Any spec id and library id listed in llms-full.txt fit the same URL shape; every URL below is complete and callable.
{
  "spec_id": "scatter-matrix",
  "language": "javascript",
  "library": "echarts",
  "page": "https://anyplot.ai/scatter-matrix/javascript/echarts",
  "hub": "https://anyplot.ai/scatter-matrix",
  "code_json": "https://api.anyplot.ai/specs/scatter-matrix/echarts/code",
  "spec_json": "https://api.anyplot.ai/specs/scatter-matrix",
  "render_light_png": "https://storage.googleapis.com/anyplot-images/plots/scatter-matrix/javascript/echarts/plot-light.png",
  "render_dark_png": "https://storage.googleapis.com/anyplot-images/plots/scatter-matrix/javascript/echarts/plot-dark.png",
  "interactive_light_html": "https://storage.googleapis.com/anyplot-images/plots/scatter-matrix/javascript/echarts/plot-light.html",
  "interactive_dark_html": "https://storage.googleapis.com/anyplot-images/plots/scatter-matrix/javascript/echarts/plot-dark.html",
  "quality_score": 88.0,
  "license": "MIT",
  "guide": "https://anyplot.ai/llms.txt"
}
Part of Scatter Plot Matrix on anyplot.ai.