The same plot in 14 other libraries — JavaScript: D3.js, Apache ECharts, Highcharts, MUI X Charts; Python: Altair, Bokeh, lets-plot, Matplotlib, Plotly, plotnine, Pygal, Seaborn; R: ggplot2; Julia: Makie.jl. Compare all 15 side by side: Scatter Plot Matrix in Python, R, Julia and JavaScript.
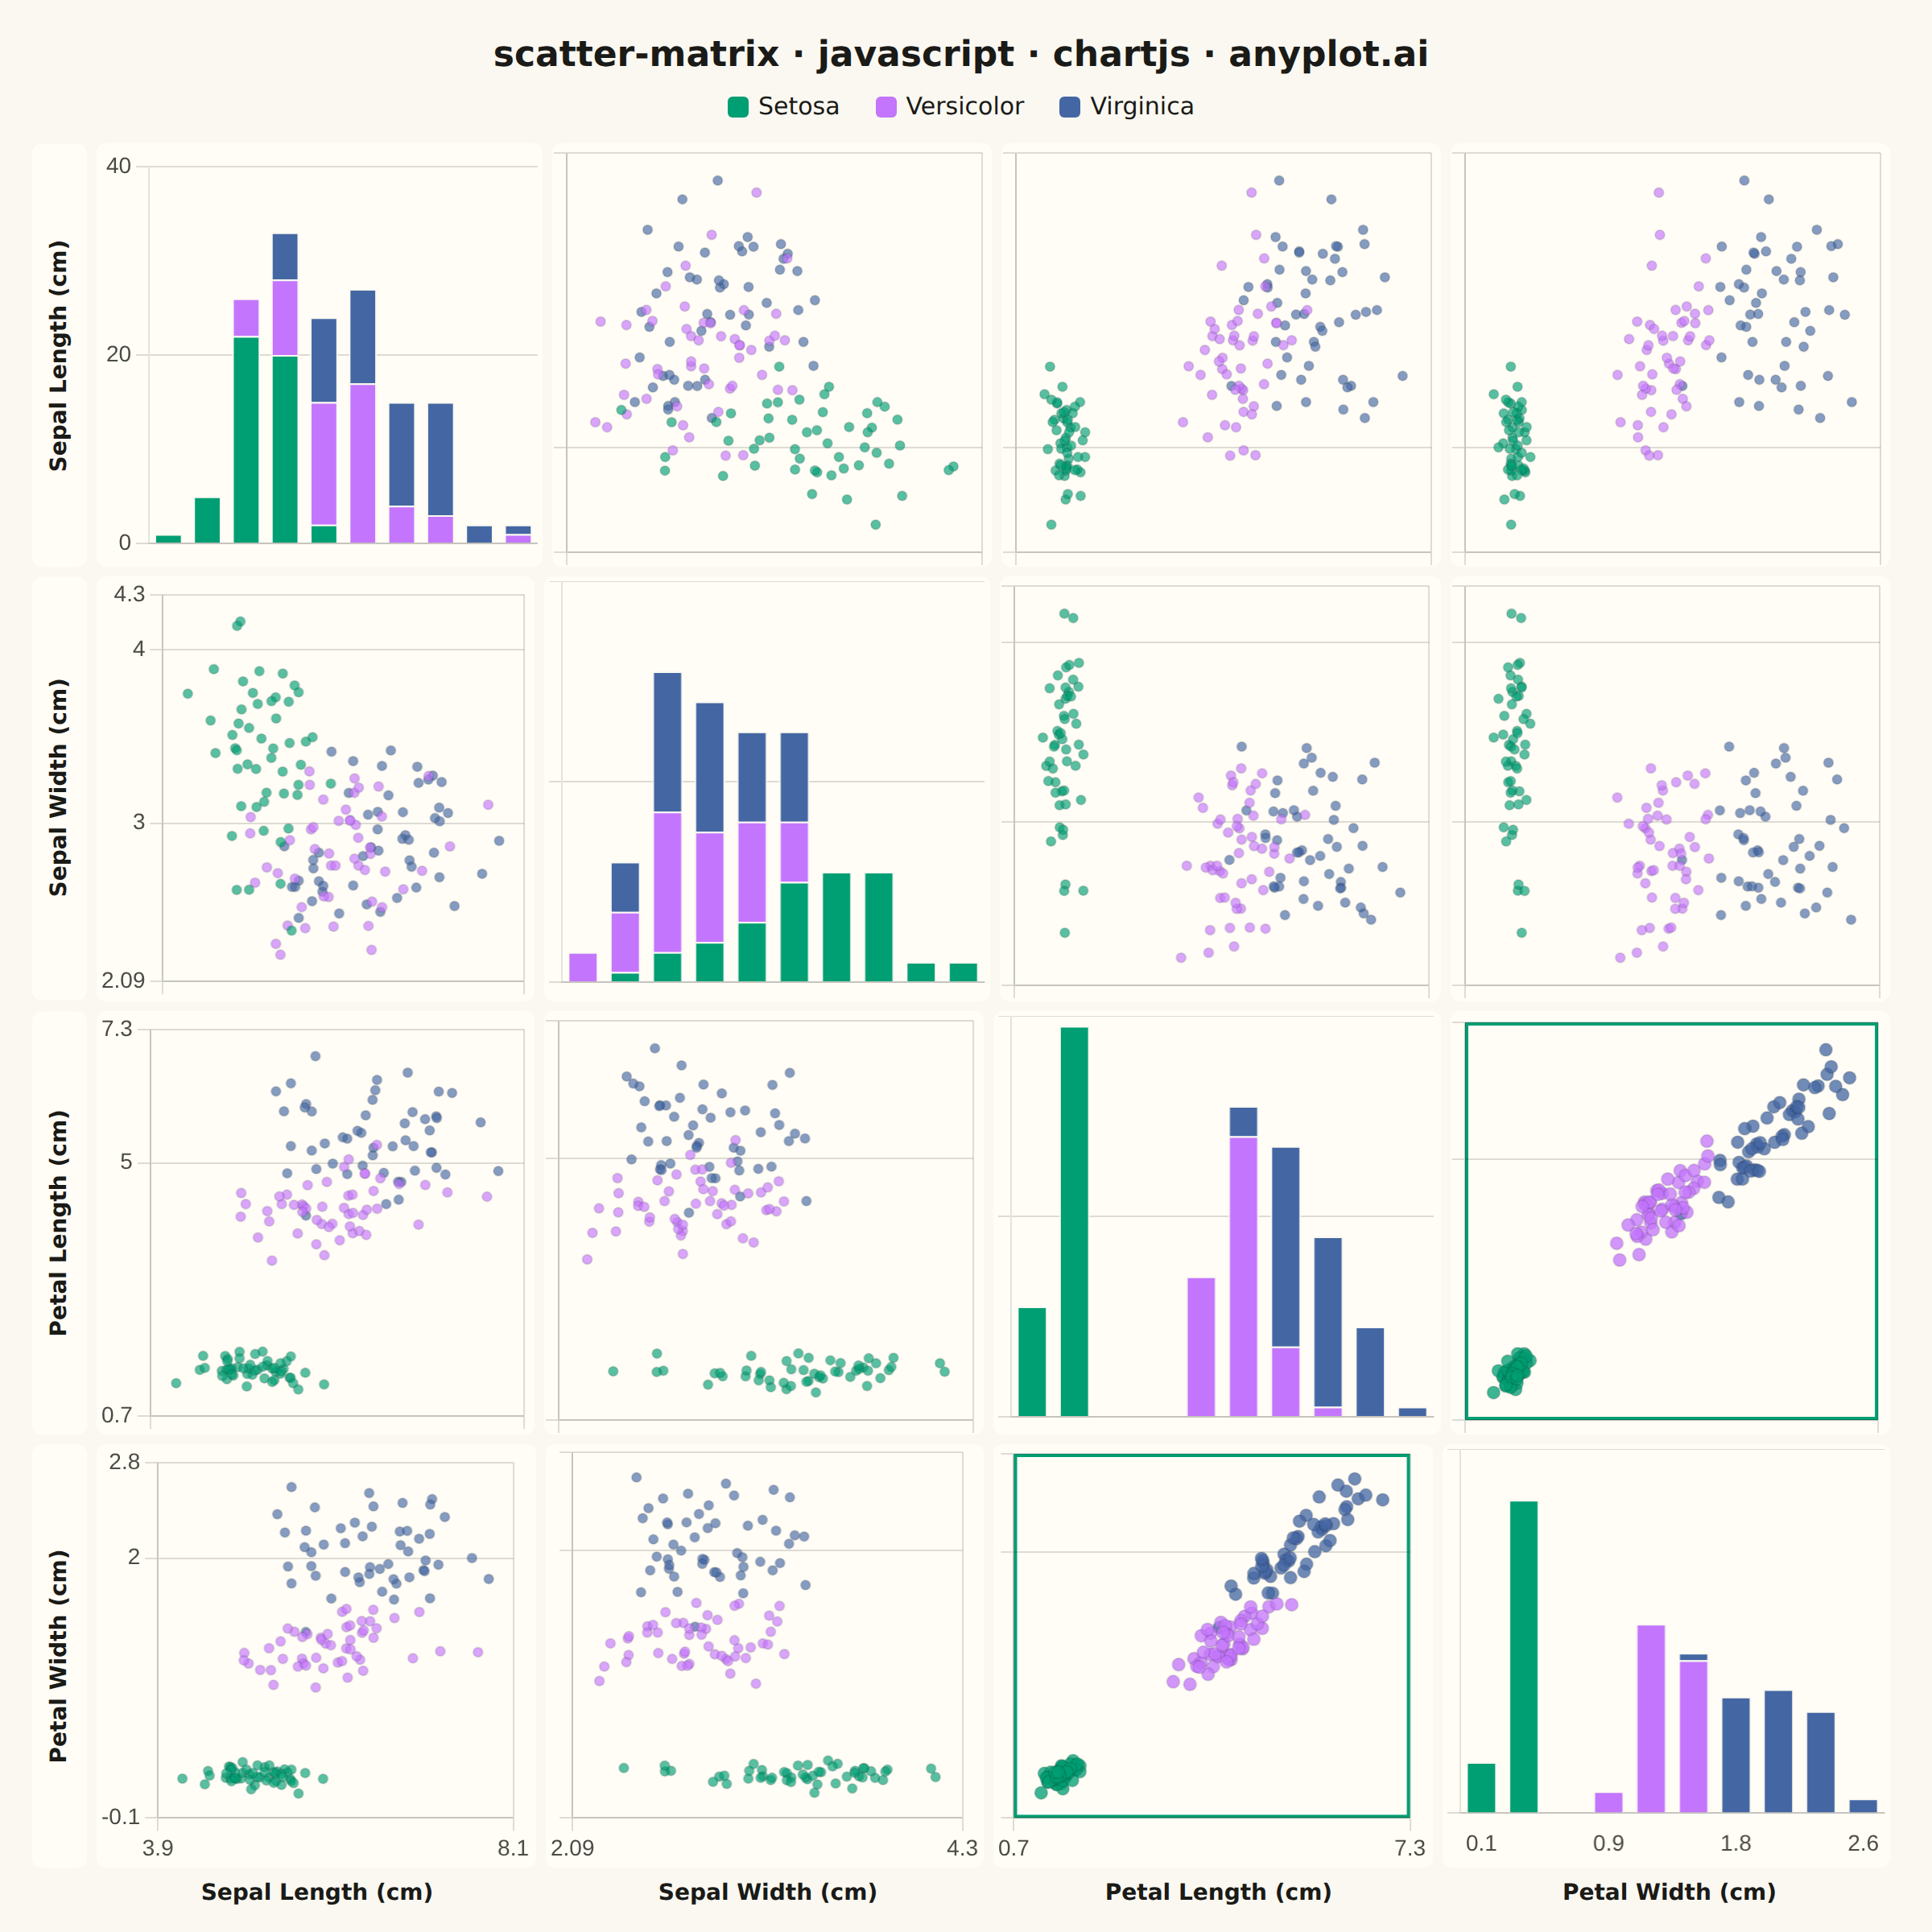
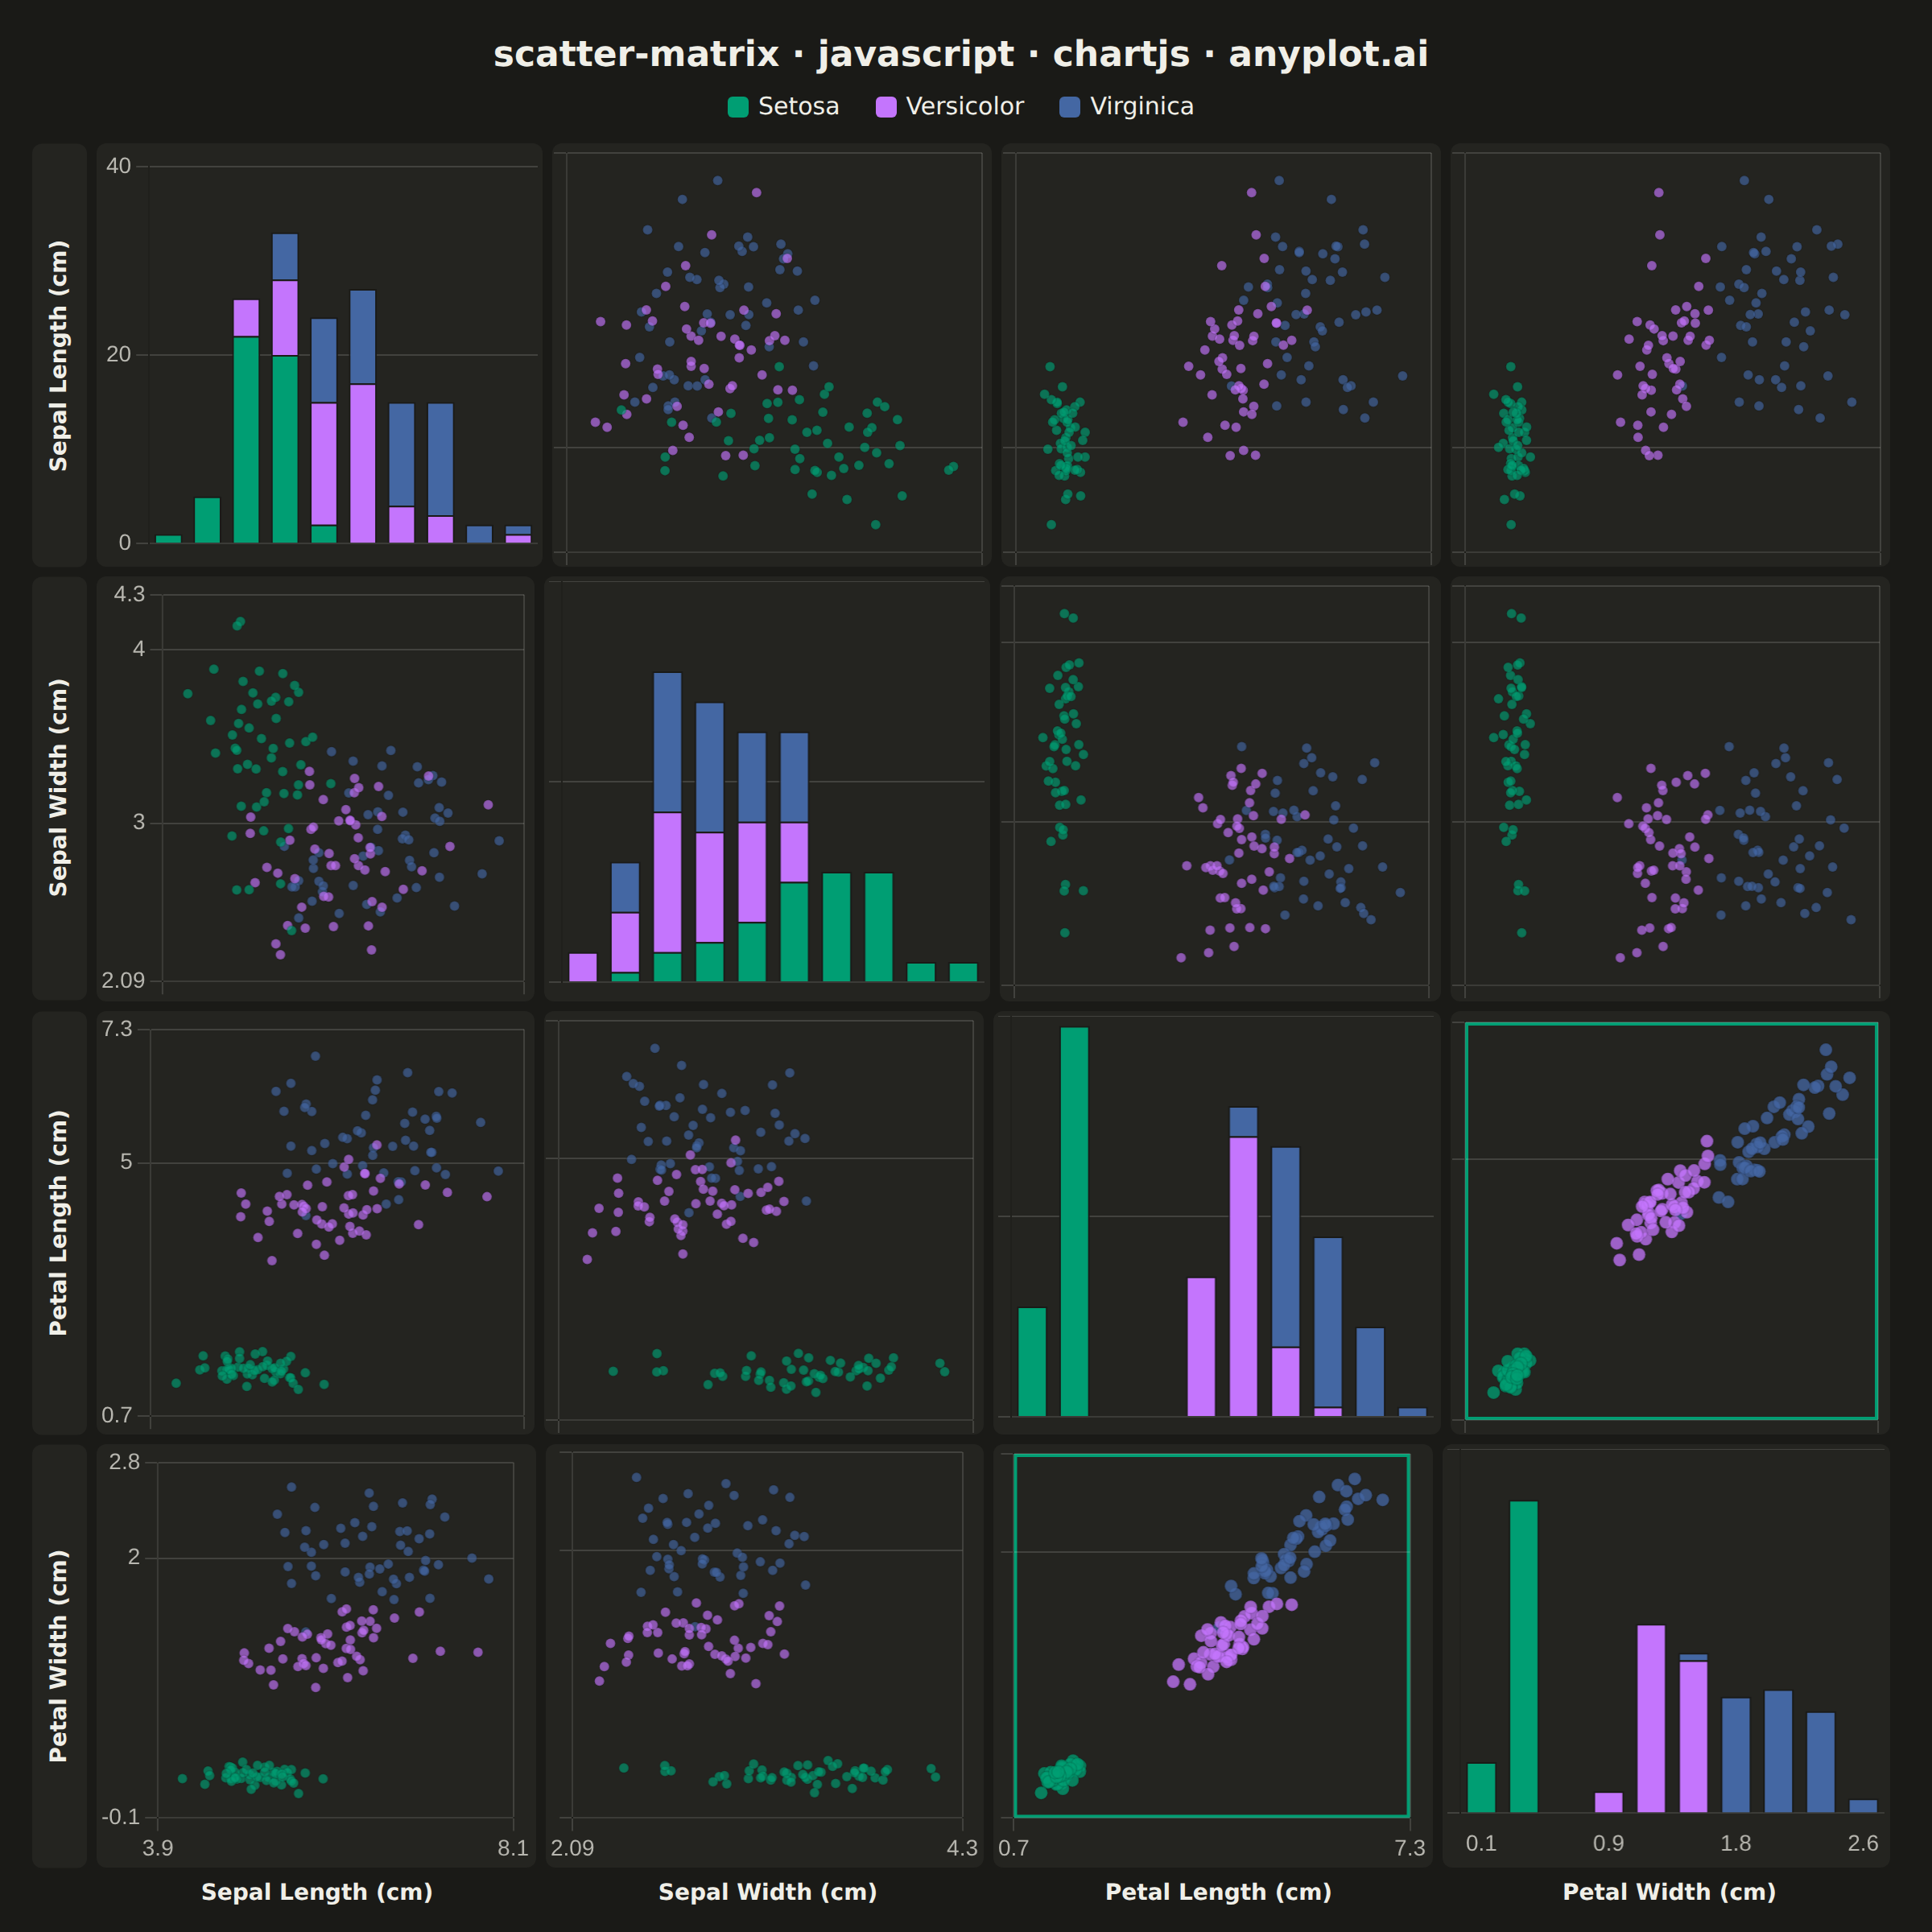
A grid of scatter plots showing all pairwise relationships between multiple variables, with histograms or kernel density estimates on the diagonal. This comprehensive visualization enables simultaneous exploration of correlations and distributions across an entire dataset, making it invaluable for understanding multivariate data structure at a glance. Also known as a pairplot or SPLOM (Scatter Plot Matrix).
// anyplot.ai
// scatter-matrix: Scatter Plot Matrix
// Library: chartjs 4.4.7 | JavaScript 22.23.2
// Quality: 93/100 | Created: 2026-09-09
//# anyplot-orientation: square

const t = window.ANYPLOT_TOKENS;

// --- Data (in-memory, deterministic LCG) ------------------------------------
function makeLcg(seed) {
  let state = seed;
  return () => {
    state = (state * 1664525 + 1013904223) % 4294967296;
    return state / 4294967296;
  };
}
const rand = makeLcg(42);
function randNormal(mean, std) {
  const u1 = Math.max(rand(), 1e-9);
  const u2 = rand();
  const z = Math.sqrt(-2 * Math.log(u1)) * Math.cos(2 * Math.PI * u2);
  return mean + z * std;
}

// Iris-like flower measurements across three species — real cross-variable
// correlation emerges both from between-species clustering and from a
// petal-length -> petal-width relationship within each species.
const POINTS_PER_SPECIES = 50;
const speciesSpecs = [
  {
    name: "Setosa",
    color: t.palette[0],
    sepalLength: { mean: 5.0, std: 0.35 },
    sepalWidth: { mean: 3.4, std: 0.38 },
    petalLength: { mean: 1.46, std: 0.17 },
    petalWidthRatio: 0.17,
    petalWidthNoiseStd: 0.05,
  },
  {
    name: "Versicolor",
    color: t.palette[1],
    sepalLength: { mean: 5.94, std: 0.51 },
    sepalWidth: { mean: 2.77, std: 0.31 },
    petalLength: { mean: 4.26, std: 0.47 },
    petalWidthRatio: 0.31,
    petalWidthNoiseStd: 0.12,
  },
  {
    name: "Virginica",
    color: t.palette[2],
    sepalLength: { mean: 6.59, std: 0.64 },
    sepalWidth: { mean: 2.97, std: 0.32 },
    petalLength: { mean: 5.55, std: 0.55 },
    petalWidthRatio: 0.37,
    petalWidthNoiseStd: 0.13,
  },
];

const records = [];
for (const spec of speciesSpecs) {
  for (let i = 0; i < POINTS_PER_SPECIES; i++) {
    const petalLength = Math.max(
      0.1,
      randNormal(spec.petalLength.mean, spec.petalLength.std),
    );
    const petalWidth = Math.max(
      0.05,
      petalLength * spec.petalWidthRatio +
        randNormal(0, spec.petalWidthNoiseStd),
    );
    records.push({
      species: spec.name,
      color: spec.color,
      sepal_length: Math.max(0.1, randNormal(spec.sepalLength.mean, spec.sepalLength.std)),
      sepal_width: Math.max(0.1, randNormal(spec.sepalWidth.mean, spec.sepalWidth.std)),
      petal_length: petalLength,
      petal_width: petalWidth,
    });
  }
}

const variables = [
  { key: "sepal_length", label: "Sepal Length (cm)" },
  { key: "sepal_width", label: "Sepal Width (cm)" },
  { key: "petal_length", label: "Petal Length (cm)" },
  { key: "petal_width", label: "Petal Width (cm)" },
];
const N = variables.length;
const NUM_BINS = 10;

// Shared per-variable domain — used as X range whenever the variable sits in
// a column, and as Y range whenever it sits in a row, so the matrix reads
// consistently down columns and across rows.
function getDomain(values) {
  const min = Math.min(...values);
  const max = Math.max(...values);
  const pad = (max - min) * 0.08 || 1;
  return { min: min - pad, max: max + pad };
}
const domainByKey = {};
for (const v of variables) {
  domainByKey[v.key] = getDomain(records.map((r) => r[v.key]));
}

// Chart.js-specific technique: a registered plugin (beforeDraw hook) that
// paints an accent stroke directly onto a chart's chartArea. Applied only to
// the petal-length/petal-width cells — the strongest pairwise relationship in
// the dataset — so the plugin system itself carries the focal-insight cue
// rather than a CSS wrapper.
const FOCUS_PAIR = new Set(["petal_length", "petal_width"]);
const focusAccentPlugin = {
  id: "focusAccent",
  beforeDraw(chart, _args, opts) {
    if (!opts?.active) return;
    const { ctx, chartArea } = chart;
    if (!chartArea) return;
    ctx.save();
    ctx.strokeStyle = opts.color;
    ctx.lineWidth = 2;
    ctx.strokeRect(
      chartArea.left + 1,
      chartArea.top + 1,
      chartArea.right - chartArea.left - 2,
      chartArea.bottom - chartArea.top - 2,
    );
    ctx.restore();
  },
};
Chart.register(focusAccentPlugin);

// Per-variable stacked histogram counts (diagonal cells)
function histogramBySpecies(key) {
  const { min, max } = domainByKey[key];
  const binWidth = (max - min) / NUM_BINS;
  const counts = {};
  for (const spec of speciesSpecs) counts[spec.name] = new Array(NUM_BINS).fill(0);
  for (const r of records) {
    const idx = Math.min(
      NUM_BINS - 1,
      Math.max(0, Math.floor((r[key] - min) / binWidth)),
    );
    counts[r.species][idx] += 1;
  }
  const binLabels = Array.from({ length: NUM_BINS }, (_, i) =>
    (min + binWidth * (i + 0.5)).toFixed(1),
  );
  return { binLabels, counts };
}

// --- Scaffolding -------------------------------------------------------------
const style = document.createElement("style");
style.textContent = "#container, #container * { box-sizing: border-box; }";
document.head.appendChild(style);

const container = document.getElementById("container");
container.style.display = "flex";
container.style.flexDirection = "column";
container.style.padding = "22px 26px 16px 20px";
container.style.background = t.pageBg;
container.style.fontFamily =
  "system-ui, -apple-system, Helvetica, Arial, sans-serif";

const title = document.createElement("div");
title.textContent = "scatter-matrix · javascript · chartjs · anyplot.ai";
title.style.color = t.ink;
title.style.fontSize = "22px";
title.style.fontWeight = "600";
title.style.textAlign = "center";
title.style.marginBottom = "10px";
container.appendChild(title);

const legendRow = document.createElement("div");
legendRow.style.display = "flex";
legendRow.style.justifyContent = "center";
legendRow.style.gap = "22px";
legendRow.style.marginBottom = "14px";
for (const spec of speciesSpecs) {
  const item = document.createElement("div");
  item.style.display = "flex";
  item.style.alignItems = "center";
  item.style.gap = "6px";
  const swatch = document.createElement("span");
  swatch.style.width = "13px";
  swatch.style.height = "13px";
  swatch.style.borderRadius = "3px";
  swatch.style.background = spec.color;
  swatch.style.display = "inline-block";
  const label = document.createElement("span");
  label.textContent = spec.name;
  label.style.color = t.ink;
  label.style.fontSize = "15px";
  item.appendChild(swatch);
  item.appendChild(label);
  legendRow.appendChild(item);
}
container.appendChild(legendRow);

const gridArea = document.createElement("div");
gridArea.style.display = "flex";
gridArea.style.flexDirection = "column";
gridArea.style.flex = "1";
gridArea.style.minHeight = "0";
container.appendChild(gridArea);

const rowsWrap = document.createElement("div");
rowsWrap.style.display = "flex";
rowsWrap.style.flexDirection = "column";
rowsWrap.style.flex = "1";
rowsWrap.style.minHeight = "0";
rowsWrap.style.gap = "6px";
gridArea.appendChild(rowsWrap);

const ROW_LABEL_WIDTH = "34px";

variables.forEach((rowVar, rowIdx) => {
  const rowDiv = document.createElement("div");
  rowDiv.style.display = "flex";
  rowDiv.style.flex = "1";
  rowDiv.style.minHeight = "0";
  rowDiv.style.gap = "6px";

  const rowLabel = document.createElement("div");
  rowLabel.textContent = rowVar.label;
  rowLabel.style.width = ROW_LABEL_WIDTH;
  rowLabel.style.flexShrink = "0";
  rowLabel.style.display = "flex";
  rowLabel.style.alignItems = "center";
  rowLabel.style.justifyContent = "center";
  rowLabel.style.writingMode = "vertical-rl";
  rowLabel.style.transform = "rotate(180deg)";
  rowLabel.style.color = t.ink;
  rowLabel.style.fontSize = "14px";
  rowLabel.style.fontWeight = "600";
  rowLabel.style.background = t.elevatedBg;
  rowLabel.style.borderRadius = "6px";
  rowDiv.appendChild(rowLabel);

  variables.forEach((colVar, colIdx) => {
    const isLeftCol = colIdx === 0;
    const isBottomRow = rowIdx === N - 1;
    const isDiagonal = rowVar.key === colVar.key;

    const cellWrap = document.createElement("div");
    cellWrap.style.position = "relative";
    cellWrap.style.flex = "1";
    cellWrap.style.minWidth = "0";
    cellWrap.style.background = t.elevatedBg;
    // Only edge cells (which anchor the row/column labels) and diagonal
    // histograms keep a visible border; interior scatter cells stay
    // borderless so the grid reads as one panel instead of 16 boxed tiles.
    cellWrap.style.border =
      isDiagonal || isLeftCol || isBottomRow
        ? `1px solid ${t.grid}80`
        : "1px solid transparent";
    cellWrap.style.borderRadius = "6px";
    cellWrap.style.overflow = "hidden";
    if (isDiagonal) {
      // A touch of breathing room around each diagonal histogram.
      cellWrap.style.padding = "3px";
    }

    const canvas = document.createElement("canvas");
    cellWrap.appendChild(canvas);
    rowDiv.appendChild(cellWrap);

    if (isDiagonal) {
      // Diagonal: stacked histogram showing the univariate distribution
      const { binLabels, counts } = histogramBySpecies(rowVar.key);
      new Chart(canvas, {
        type: "bar",
        data: {
          labels: binLabels,
          datasets: speciesSpecs.map((spec) => ({
            label: spec.name,
            data: counts[spec.name],
            backgroundColor: spec.color,
            borderColor: t.pageBg,
            borderWidth: 1,
            stack: "dist",
          })),
        },
        options: {
          responsive: true,
          maintainAspectRatio: false,
          animation: false,
          plugins: {
            legend: { display: false },
            title: { display: false },
            tooltip: {
              callbacks: {
                title: (items) => `${rowVar.label} ≈ ${items[0].label}`,
              },
            },
          },
          scales: {
            x: {
              stacked: true,
              ticks: {
                display: isBottomRow,
                color: t.inkSoft,
                font: { size: 14 },
                maxTicksLimit: 4,
              },
              grid: { display: false },
            },
            y: {
              stacked: true,
              ticks: {
                display: isLeftCol,
                color: t.inkSoft,
                font: { size: 14 },
                maxTicksLimit: 3,
              },
              grid: { color: t.grid },
            },
          },
        },
      });
    } else {
      // Off-diagonal: pairwise scatter, colored by species. The
      // petal-length/petal-width cells (the dataset's strongest pairwise
      // correlation) get a touch more marker weight plus the focusAccent
      // plugin outline to sharpen that focal relationship.
      const isFocalPair =
        FOCUS_PAIR.has(rowVar.key) && FOCUS_PAIR.has(colVar.key);
      new Chart(canvas, {
        type: "scatter",
        data: {
          datasets: speciesSpecs.map((spec) => ({
            label: spec.name,
            data: records
              .filter((r) => r.species === spec.name)
              .map((r) => ({ x: r[colVar.key], y: r[rowVar.key] })),
            backgroundColor: `${spec.color}${isFocalPair ? "C2" : "A6"}`,
            pointRadius: isFocalPair ? 4 : 3,
            pointHoverRadius: isFocalPair ? 5 : 4,
          })),
        },
        options: {
          responsive: true,
          maintainAspectRatio: false,
          animation: false,
          plugins: {
            legend: { display: false },
            title: { display: false },
            focusAccent: { active: isFocalPair, color: t.palette[0] },
            tooltip: {
              callbacks: {
                label: (ctx) =>
                  `${ctx.dataset.label}: ${colVar.label} ${ctx.parsed.x.toFixed(2)}, ${rowVar.label} ${ctx.parsed.y.toFixed(2)}`,
              },
            },
          },
          scales: {
            x: {
              min: domainByKey[colVar.key].min,
              max: domainByKey[colVar.key].max,
              ticks: {
                display: isBottomRow,
                color: t.inkSoft,
                font: { size: 14 },
                maxTicksLimit: 4,
              },
              grid: { color: t.grid },
            },
            y: {
              min: domainByKey[rowVar.key].min,
              max: domainByKey[rowVar.key].max,
              ticks: {
                display: isLeftCol,
                color: t.inkSoft,
                font: { size: 14 },
                maxTicksLimit: 4,
              },
              grid: { color: t.grid },
            },
          },
        },
      });
    }
  });

  rowsWrap.appendChild(rowDiv);
});

// Column variable names along the bottom edge only
const colLabelsRow = document.createElement("div");
colLabelsRow.style.display = "flex";
colLabelsRow.style.gap = "6px";
colLabelsRow.style.marginTop = "8px";
const colLabelsSpacer = document.createElement("div");
colLabelsSpacer.style.width = ROW_LABEL_WIDTH;
colLabelsSpacer.style.flexShrink = "0";
colLabelsRow.appendChild(colLabelsSpacer);
for (const colVar of variables) {
  const cell = document.createElement("div");
  cell.textContent = colVar.label;
  cell.style.flex = "1";
  cell.style.textAlign = "center";
  cell.style.color = t.ink;
  cell.style.fontSize = "14px";
  cell.style.fontWeight = "600";
  colLabelsRow.appendChild(cell);
}
gridArea.appendChild(colLabelsRow);
Runnable source as JSON, for any HTTP client: https://api.anyplot.ai/specs/scatter-matrix/chartjs/code. Any spec id and library id listed in llms-full.txt fit the same URL shape; every URL below is complete and callable.
{
  "spec_id": "scatter-matrix",
  "language": "javascript",
  "library": "chartjs",
  "page": "https://anyplot.ai/scatter-matrix/javascript/chartjs",
  "hub": "https://anyplot.ai/scatter-matrix",
  "code_json": "https://api.anyplot.ai/specs/scatter-matrix/chartjs/code",
  "spec_json": "https://api.anyplot.ai/specs/scatter-matrix",
  "render_light_png": "https://storage.googleapis.com/anyplot-images/plots/scatter-matrix/javascript/chartjs/plot-light.png",
  "render_dark_png": "https://storage.googleapis.com/anyplot-images/plots/scatter-matrix/javascript/chartjs/plot-dark.png",
  "interactive_light_html": "https://storage.googleapis.com/anyplot-images/plots/scatter-matrix/javascript/chartjs/plot-light.html",
  "interactive_dark_html": "https://storage.googleapis.com/anyplot-images/plots/scatter-matrix/javascript/chartjs/plot-dark.html",
  "quality_score": 93.0,
  "license": "MIT",
  "guide": "https://anyplot.ai/llms.txt"
}
Part of Scatter Plot Matrix on anyplot.ai.