The same plot in 14 other libraries — JavaScript: Chart.js, Apache ECharts, Highcharts, MUI X Charts; Python: Altair, Bokeh, lets-plot, Matplotlib, Plotly, plotnine, Pygal, Seaborn; R: ggplot2; Julia: Makie.jl. Compare all 15 side by side: Scatter Plot Matrix in Python, R, Julia and JavaScript.
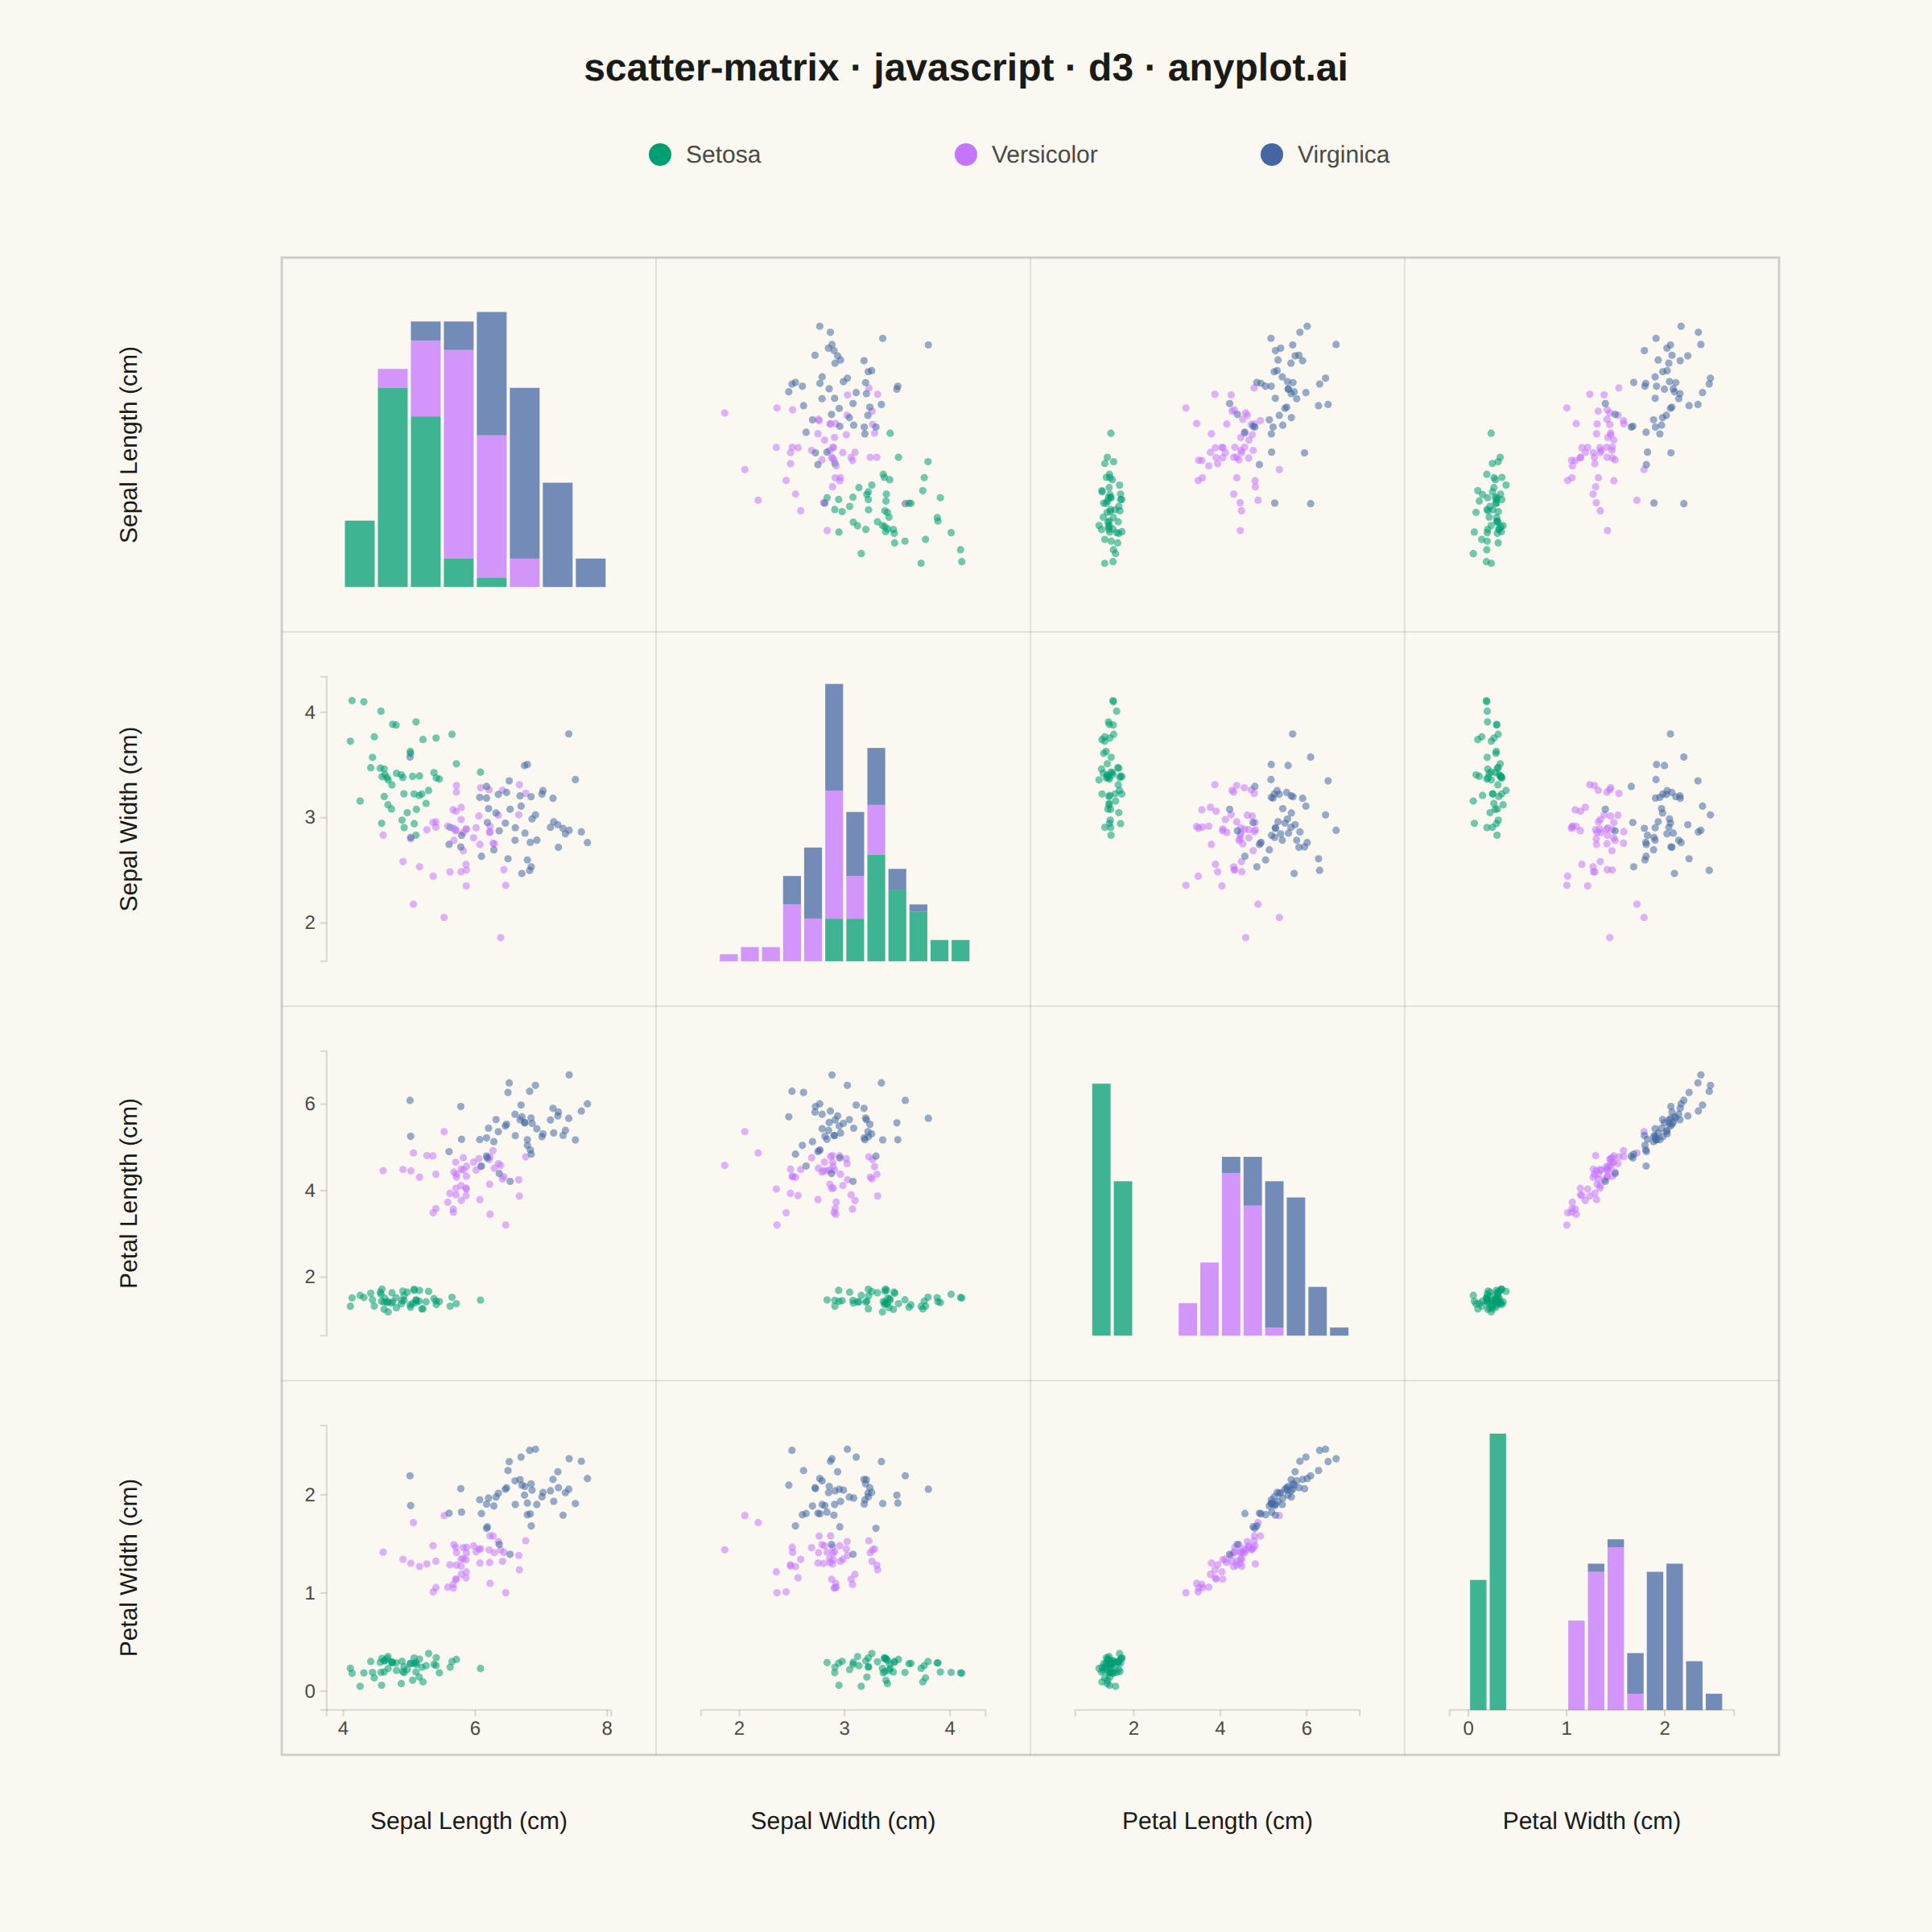
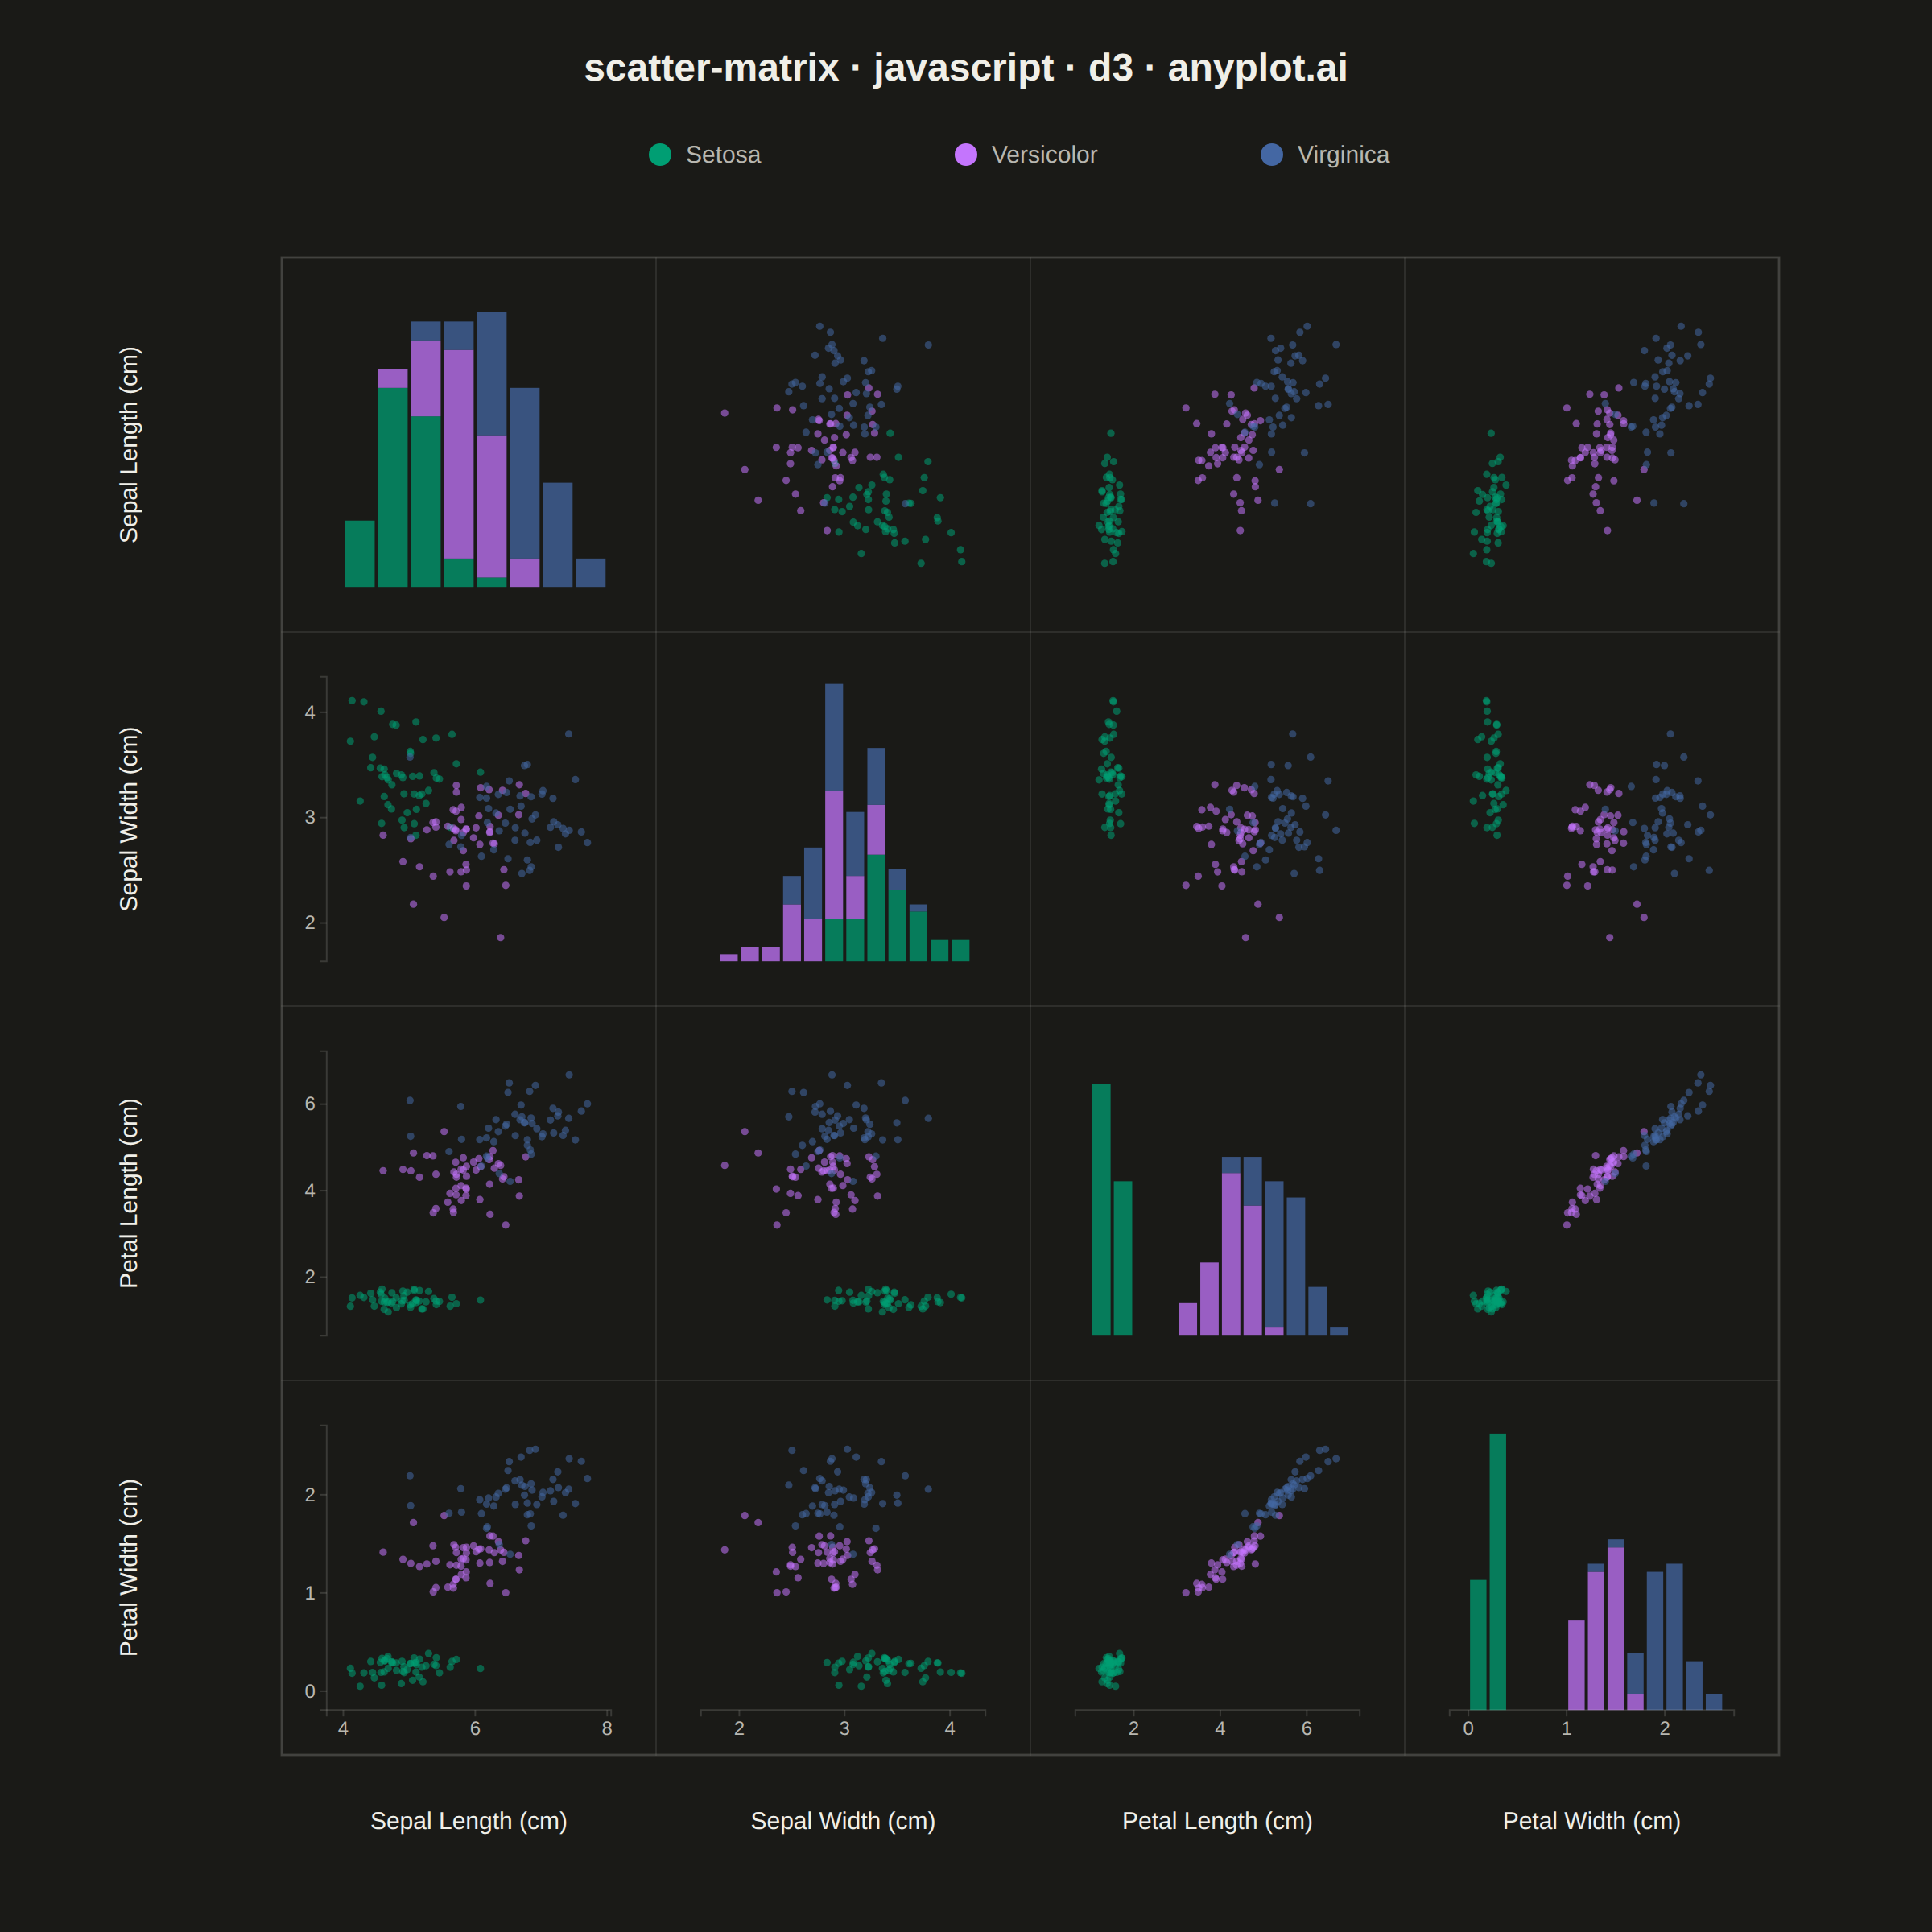
A grid of scatter plots showing all pairwise relationships between multiple variables, with histograms or kernel density estimates on the diagonal. This comprehensive visualization enables simultaneous exploration of correlations and distributions across an entire dataset, making it invaluable for understanding multivariate data structure at a glance. Also known as a pairplot or SPLOM (Scatter Plot Matrix).
// anyplot.ai
// scatter-matrix: Scatter Plot Matrix
// Library: d3 7.9.0 | JavaScript 22.23.2
// Quality: 93/100 | Created: 2026-09-09
//# anyplot-orientation: square

const t = window.ANYPLOT_TOKENS;
const { width, height } = window.ANYPLOT_SIZE;

// --- Data (in-memory, deterministic Iris-like flower measurements) ---------
function lcg(seed) {
  let s = seed >>> 0;
  return () => {
    s = (Math.imul(s, 1103515245) + 12345) >>> 0;
    return s / 4294967296;
  };
}
const rand = lcg(42);
function gaussian() {
  const u1 = Math.max(rand(), 1e-9);
  const u2 = rand();
  return Math.sqrt(-2 * Math.log(u1)) * Math.cos(2 * Math.PI * u2);
}

const species = [
  { name: "Setosa", n: 50, sepalLength: [5.0, 0.35], sepalWidth: [3.4, 0.38], petalLength: [1.5, 0.17], widthRatio: 0.168 },
  { name: "Versicolor", n: 50, sepalLength: [5.9, 0.52], sepalWidth: [2.77, 0.31], petalLength: [4.26, 0.47], widthRatio: 0.312 },
  { name: "Virginica", n: 50, sepalLength: [6.59, 0.64], sepalWidth: [2.97, 0.32], petalLength: [5.55, 0.55], widthRatio: 0.366 },
];

const data = [];
species.forEach((sp) => {
  for (let i = 0; i < sp.n; i++) {
    const sepalLength = sp.sepalLength[0] + sp.sepalLength[1] * gaussian();
    const sepalWidth = sp.sepalWidth[0] + sp.sepalWidth[1] * gaussian();
    const petalLength = Math.max(sp.petalLength[0] + sp.petalLength[1] * gaussian(), 0.1);
    const petalWidth = Math.max(petalLength * sp.widthRatio + 0.08 * gaussian(), 0.05);
    data.push({ species: sp.name, sepalLength, sepalWidth, petalLength, petalWidth });
  }
});

const variables = [
  { key: "sepalLength", label: "Sepal Length (cm)" },
  { key: "sepalWidth", label: "Sepal Width (cm)" },
  { key: "petalLength", label: "Petal Length (cm)" },
  { key: "petalWidth", label: "Petal Width (cm)" },
];
const n = variables.length;

// --- Layout (square grid, centered, room for title/legend/axis labels) -----
const margin = { top: 160, right: 60, bottom: 110, left: 140 };
const gridBoxW = width - margin.left - margin.right;
const gridBoxH = height - margin.top - margin.bottom;
const cell = Math.min(gridBoxW, gridBoxH) / n;
const offsetX = margin.left + (gridBoxW - cell * n) / 2;
const offsetY = margin.top + (gridBoxH - cell * n) / 2;
const inset = cell * 0.12;

// --- Scales: shared per-column (x) and per-row (y) so points align --------
function paddedExtent(values) {
  const [lo, hi] = d3.extent(values);
  const pad = (hi - lo) * 0.1 || 1;
  return [lo - pad, hi + pad];
}
const colScales = variables.map((v) =>
  d3.scaleLinear().domain(paddedExtent(data.map((d) => d[v.key]))).range([inset, cell - inset])
);
const rowScales = variables.map((v) =>
  d3.scaleLinear().domain(paddedExtent(data.map((d) => d[v.key]))).range([cell - inset, inset])
);
const color = d3.scaleOrdinal().domain(species.map((s) => s.name)).range(t.palette);

// --- SVG mount ---------------------------------------------------------------
const svg = d3.select("#container").append("svg").attr("width", width).attr("height", height);

// --- Matrix cells: scatter off-diagonal, pooled histogram on the diagonal ---
for (let r = 0; r < n; r++) {
  for (let c = 0; c < n; c++) {
    const g = svg
      .append("g")
      .attr("transform", `translate(${offsetX + c * cell},${offsetY + r * cell})`);
    g.append("rect")
      .attr("width", cell)
      .attr("height", cell)
      .attr("fill", "none")
      .attr("stroke", t.grid)
      .attr("stroke-width", 1)
      .attr("stroke-opacity", 0.35);

    if (r === c) {
      // Stacked per-species histogram: shared bin boundaries across species so
      // the diagonal carries the same categorical story as the off-diagonal scatters.
      const domain = colScales[c].domain();
      const overallBins = d3.bin().domain(domain).thresholds(10)(data.map((d) => d[variables[c].key]));
      const thresholds = overallBins.slice(1).map((b) => b.x0);
      const perSpeciesBins = species.map((sp) => {
        const values = data.filter((d) => d.species === sp.name).map((d) => d[variables[c].key]);
        return d3.bin().domain(domain).thresholds(thresholds)(values);
      });
      const segments = [];
      overallBins.forEach((b, i) => {
        let cum = 0;
        species.forEach((sp, si) => {
          const count = perSpeciesBins[si][i].length;
          if (count > 0) {
            segments.push({ x0: b.x0, x1: b.x1, y0: cum, y1: cum + count, name: sp.name });
          }
          cum += count;
        });
      });
      const yCount = d3
        .scaleLinear()
        .domain([0, d3.max(segments, (s) => s.y1) || 1])
        .nice()
        .range([cell - inset, inset]);
      g.selectAll("rect.bar")
        .data(segments)
        .join("rect")
        .attr("class", "bar")
        .attr("x", (s) => colScales[c](s.x0) + 1)
        .attr("y", (s) => yCount(s.y1))
        .attr("width", (s) => Math.max(colScales[c](s.x1) - colScales[c](s.x0) - 2, 0))
        .attr("height", (s) => yCount(s.y0) - yCount(s.y1))
        .attr("fill", (s) => color(s.name))
        .attr("fill-opacity", 0.75);
    } else {
      g.selectAll("circle")
        .data(data)
        .join("circle")
        .attr("cx", (d) => colScales[c](d[variables[c].key]))
        .attr("cy", (d) => rowScales[r](d[variables[r].key]))
        .attr("r", 2.3)
        .attr("fill", (d) => color(d.species))
        .attr("fill-opacity", 0.55);
    }

    if (r === n - 1) {
      const axis = g
        .append("g")
        .attr("transform", `translate(0,${cell - inset})`)
        .call(d3.axisBottom(colScales[c]).ticks(3).tickSize(4));
      axis.selectAll("text").attr("fill", t.inkSoft).style("font-size", "12px");
      axis.selectAll("line").attr("stroke", t.grid);
      axis.select(".domain").attr("stroke", t.grid);
    }
    if (c === 0 && r !== 0) {
      const axis = g
        .append("g")
        .attr("transform", `translate(${inset},0)`)
        .call(d3.axisLeft(rowScales[r]).ticks(3).tickSize(4));
      axis.selectAll("text").attr("fill", t.inkSoft).style("font-size", "12px");
      axis.selectAll("line").attr("stroke", t.grid);
      axis.select(".domain").attr("stroke", t.grid);
    }
  }
}

// --- Outer boundary: single crisp frame around the whole matrix ------------
svg
  .append("rect")
  .attr("x", offsetX)
  .attr("y", offsetY)
  .attr("width", cell * n)
  .attr("height", cell * n)
  .attr("fill", "none")
  .attr("stroke", t.grid)
  .attr("stroke-width", 1.5);

// --- Edge labels: variable names along the bottom row and left column ------
variables.forEach((v, c) => {
  svg
    .append("text")
    .attr("x", offsetX + c * cell + cell / 2)
    .attr("y", offsetY + n * cell + 46)
    .attr("text-anchor", "middle")
    .attr("fill", t.ink)
    .style("font-size", "15px")
    .text(v.label);
});
variables.forEach((v, r) => {
  svg
    .append("text")
    .attr("transform", `translate(${offsetX - 90},${offsetY + r * cell + cell / 2}) rotate(-90)`)
    .attr("text-anchor", "middle")
    .attr("fill", t.ink)
    .style("font-size", "15px")
    .text(v.label);
});

// --- Legend (species groupings) ---------------------------------------------
const legendY = 96;
const itemWidth = 190;
const legendStartX = width / 2 - (species.length * itemWidth) / 2 + itemWidth / 2;
species.forEach((sp, i) => {
  const lx = legendStartX + i * itemWidth;
  svg.append("circle").attr("cx", lx).attr("cy", legendY).attr("r", 7).attr("fill", color(sp.name));
  svg
    .append("text")
    .attr("x", lx + 16)
    .attr("y", legendY + 5)
    .attr("fill", t.inkSoft)
    .style("font-size", "15px")
    .text(sp.name);
});

// --- Title -------------------------------------------------------------------
svg
  .append("text")
  .attr("x", width / 2)
  .attr("y", 50)
  .attr("text-anchor", "middle")
  .attr("fill", t.ink)
  .style("font-size", "24px")
  .style("font-weight", "600")
  .text("scatter-matrix · javascript · d3 · anyplot.ai");
Runnable source as JSON, for any HTTP client: https://api.anyplot.ai/specs/scatter-matrix/d3/code. Any spec id and library id listed in llms-full.txt fit the same URL shape; every URL below is complete and callable.
{
  "spec_id": "scatter-matrix",
  "language": "javascript",
  "library": "d3",
  "page": "https://anyplot.ai/scatter-matrix/javascript/d3",
  "hub": "https://anyplot.ai/scatter-matrix",
  "code_json": "https://api.anyplot.ai/specs/scatter-matrix/d3/code",
  "spec_json": "https://api.anyplot.ai/specs/scatter-matrix",
  "render_light_png": "https://storage.googleapis.com/anyplot-images/plots/scatter-matrix/javascript/d3/plot-light.png",
  "render_dark_png": "https://storage.googleapis.com/anyplot-images/plots/scatter-matrix/javascript/d3/plot-dark.png",
  "interactive_light_html": "https://storage.googleapis.com/anyplot-images/plots/scatter-matrix/javascript/d3/plot-light.html",
  "interactive_dark_html": "https://storage.googleapis.com/anyplot-images/plots/scatter-matrix/javascript/d3/plot-dark.html",
  "quality_score": 93.0,
  "license": "MIT",
  "guide": "https://anyplot.ai/llms.txt"
}
Part of Scatter Plot Matrix on anyplot.ai.