The same plot in 14 other libraries — JavaScript: Chart.js, D3.js, Apache ECharts, Highcharts; Python: Altair, Bokeh, lets-plot, Matplotlib, Plotly, plotnine, Pygal, Seaborn; R: ggplot2; Julia: Makie.jl. Compare all 15 side by side: Scatter Plot Matrix in Python, R, Julia and JavaScript.
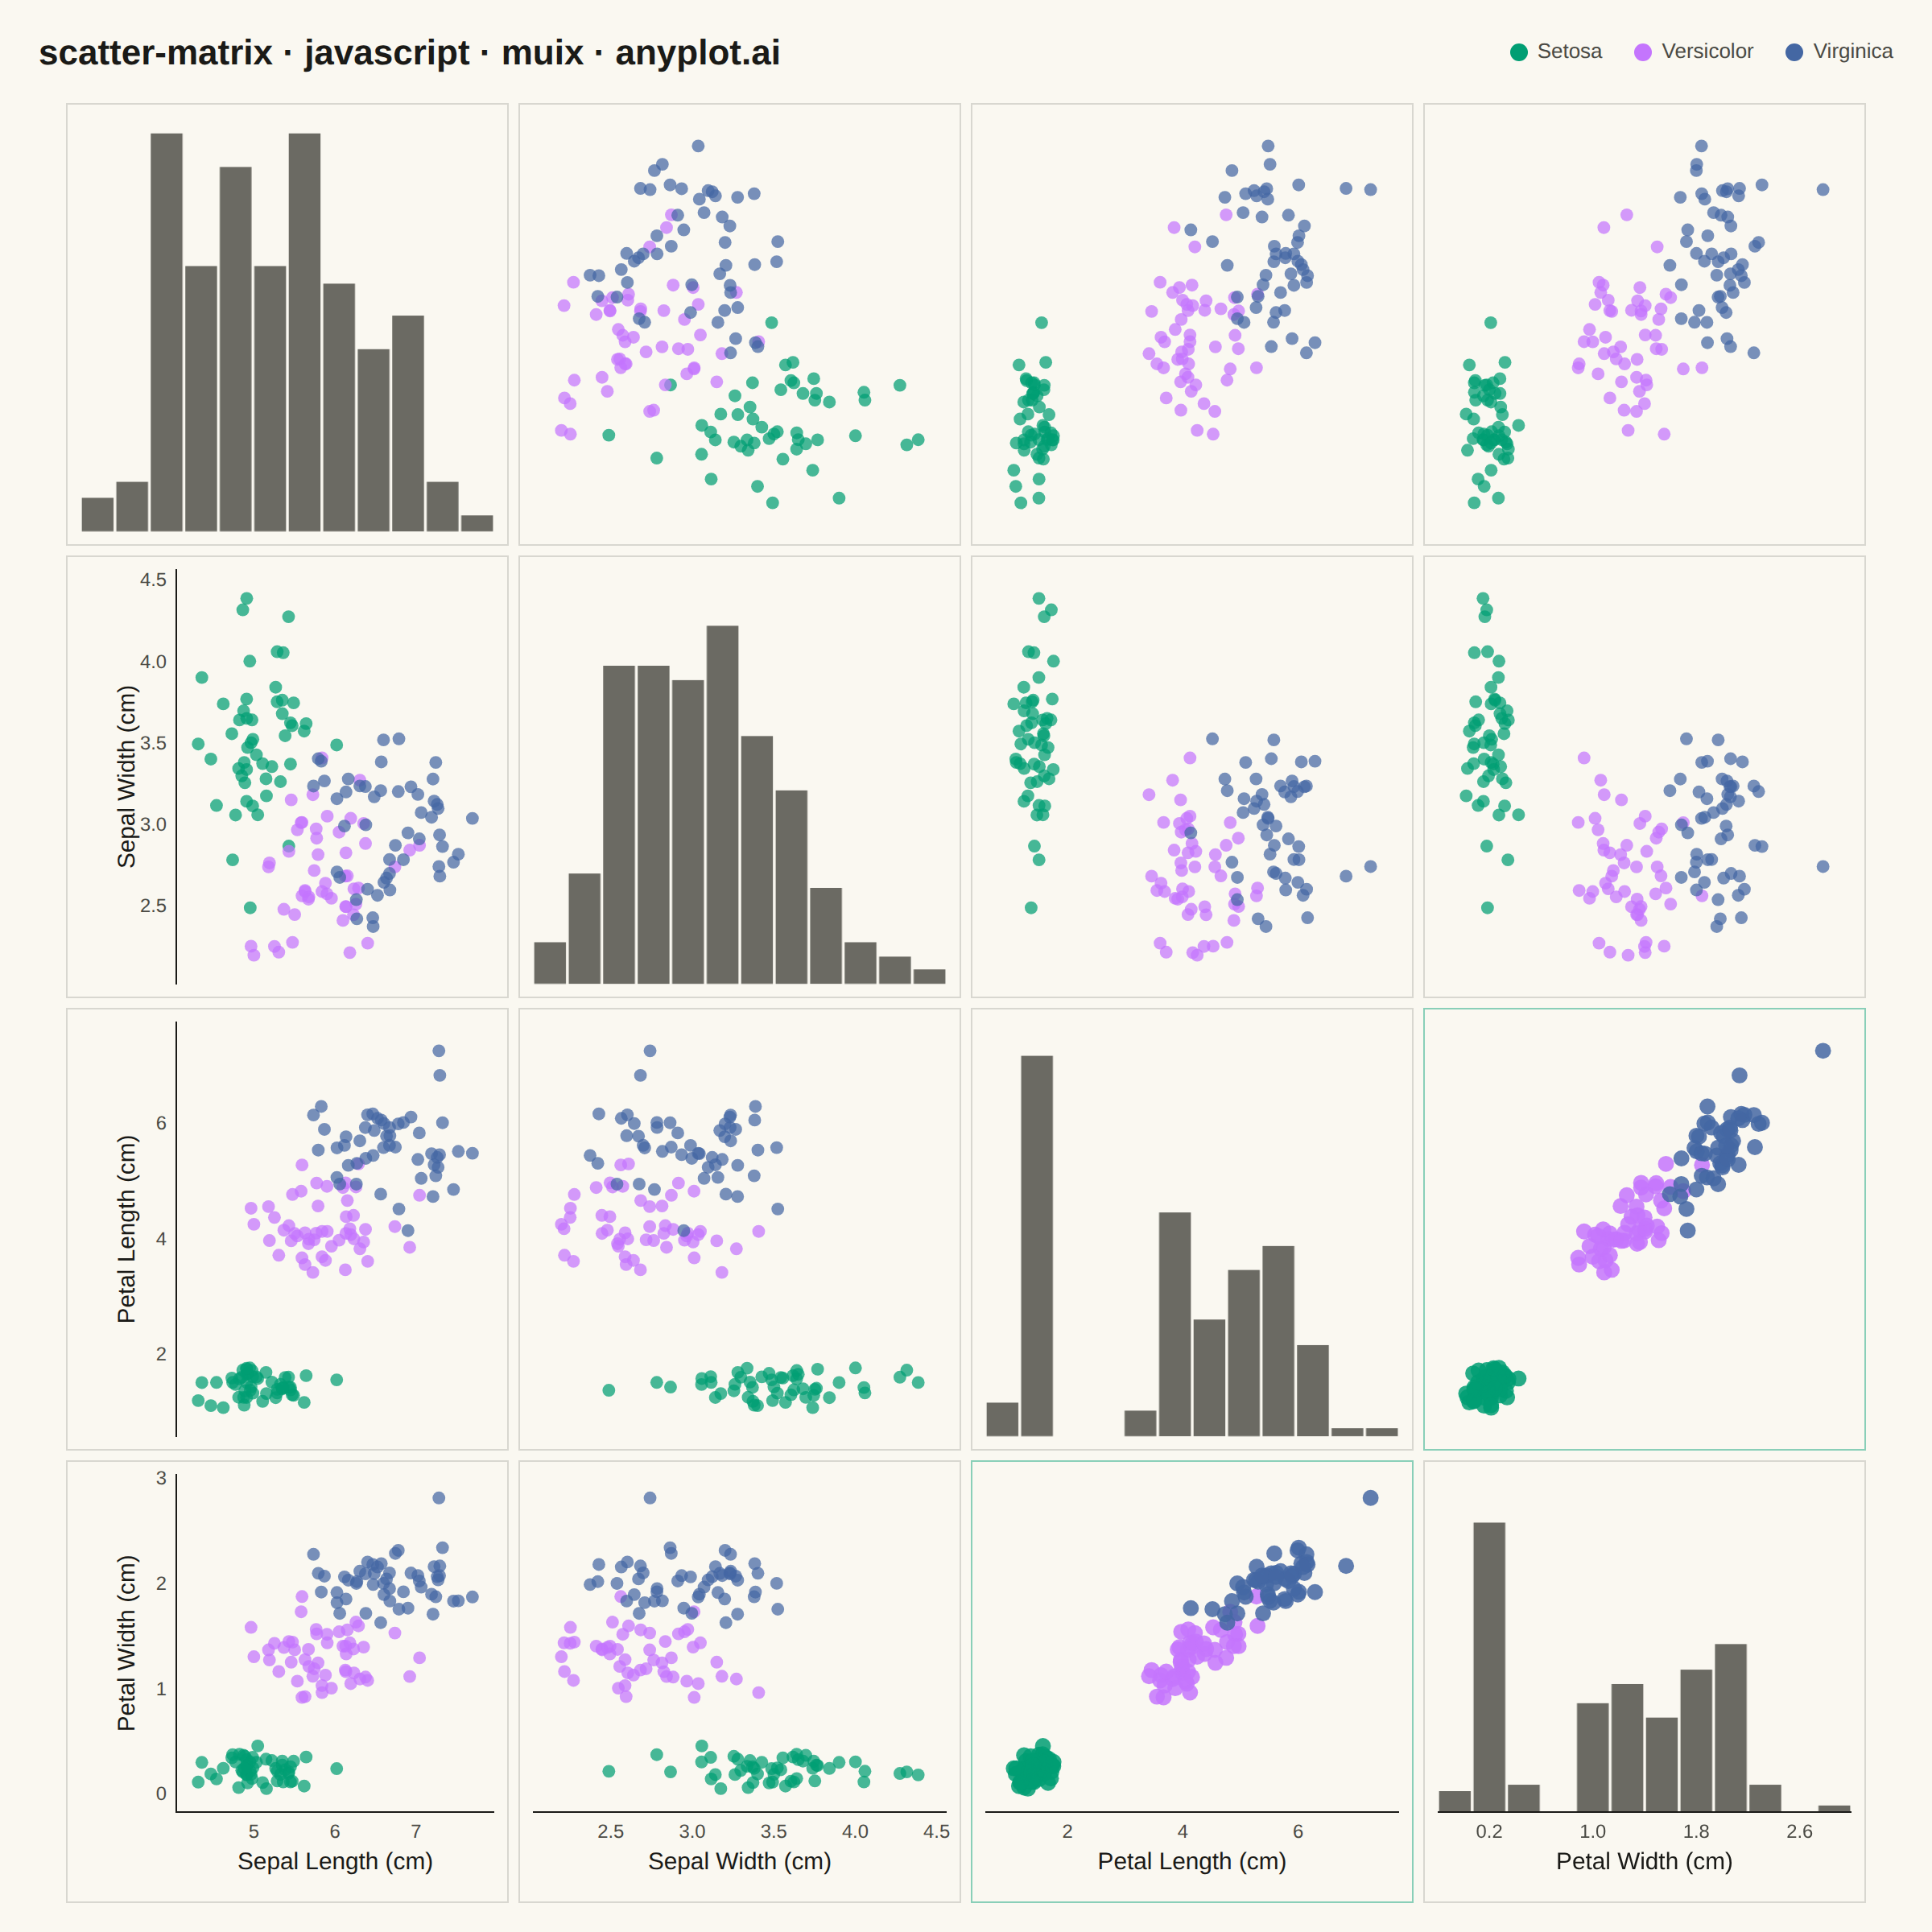
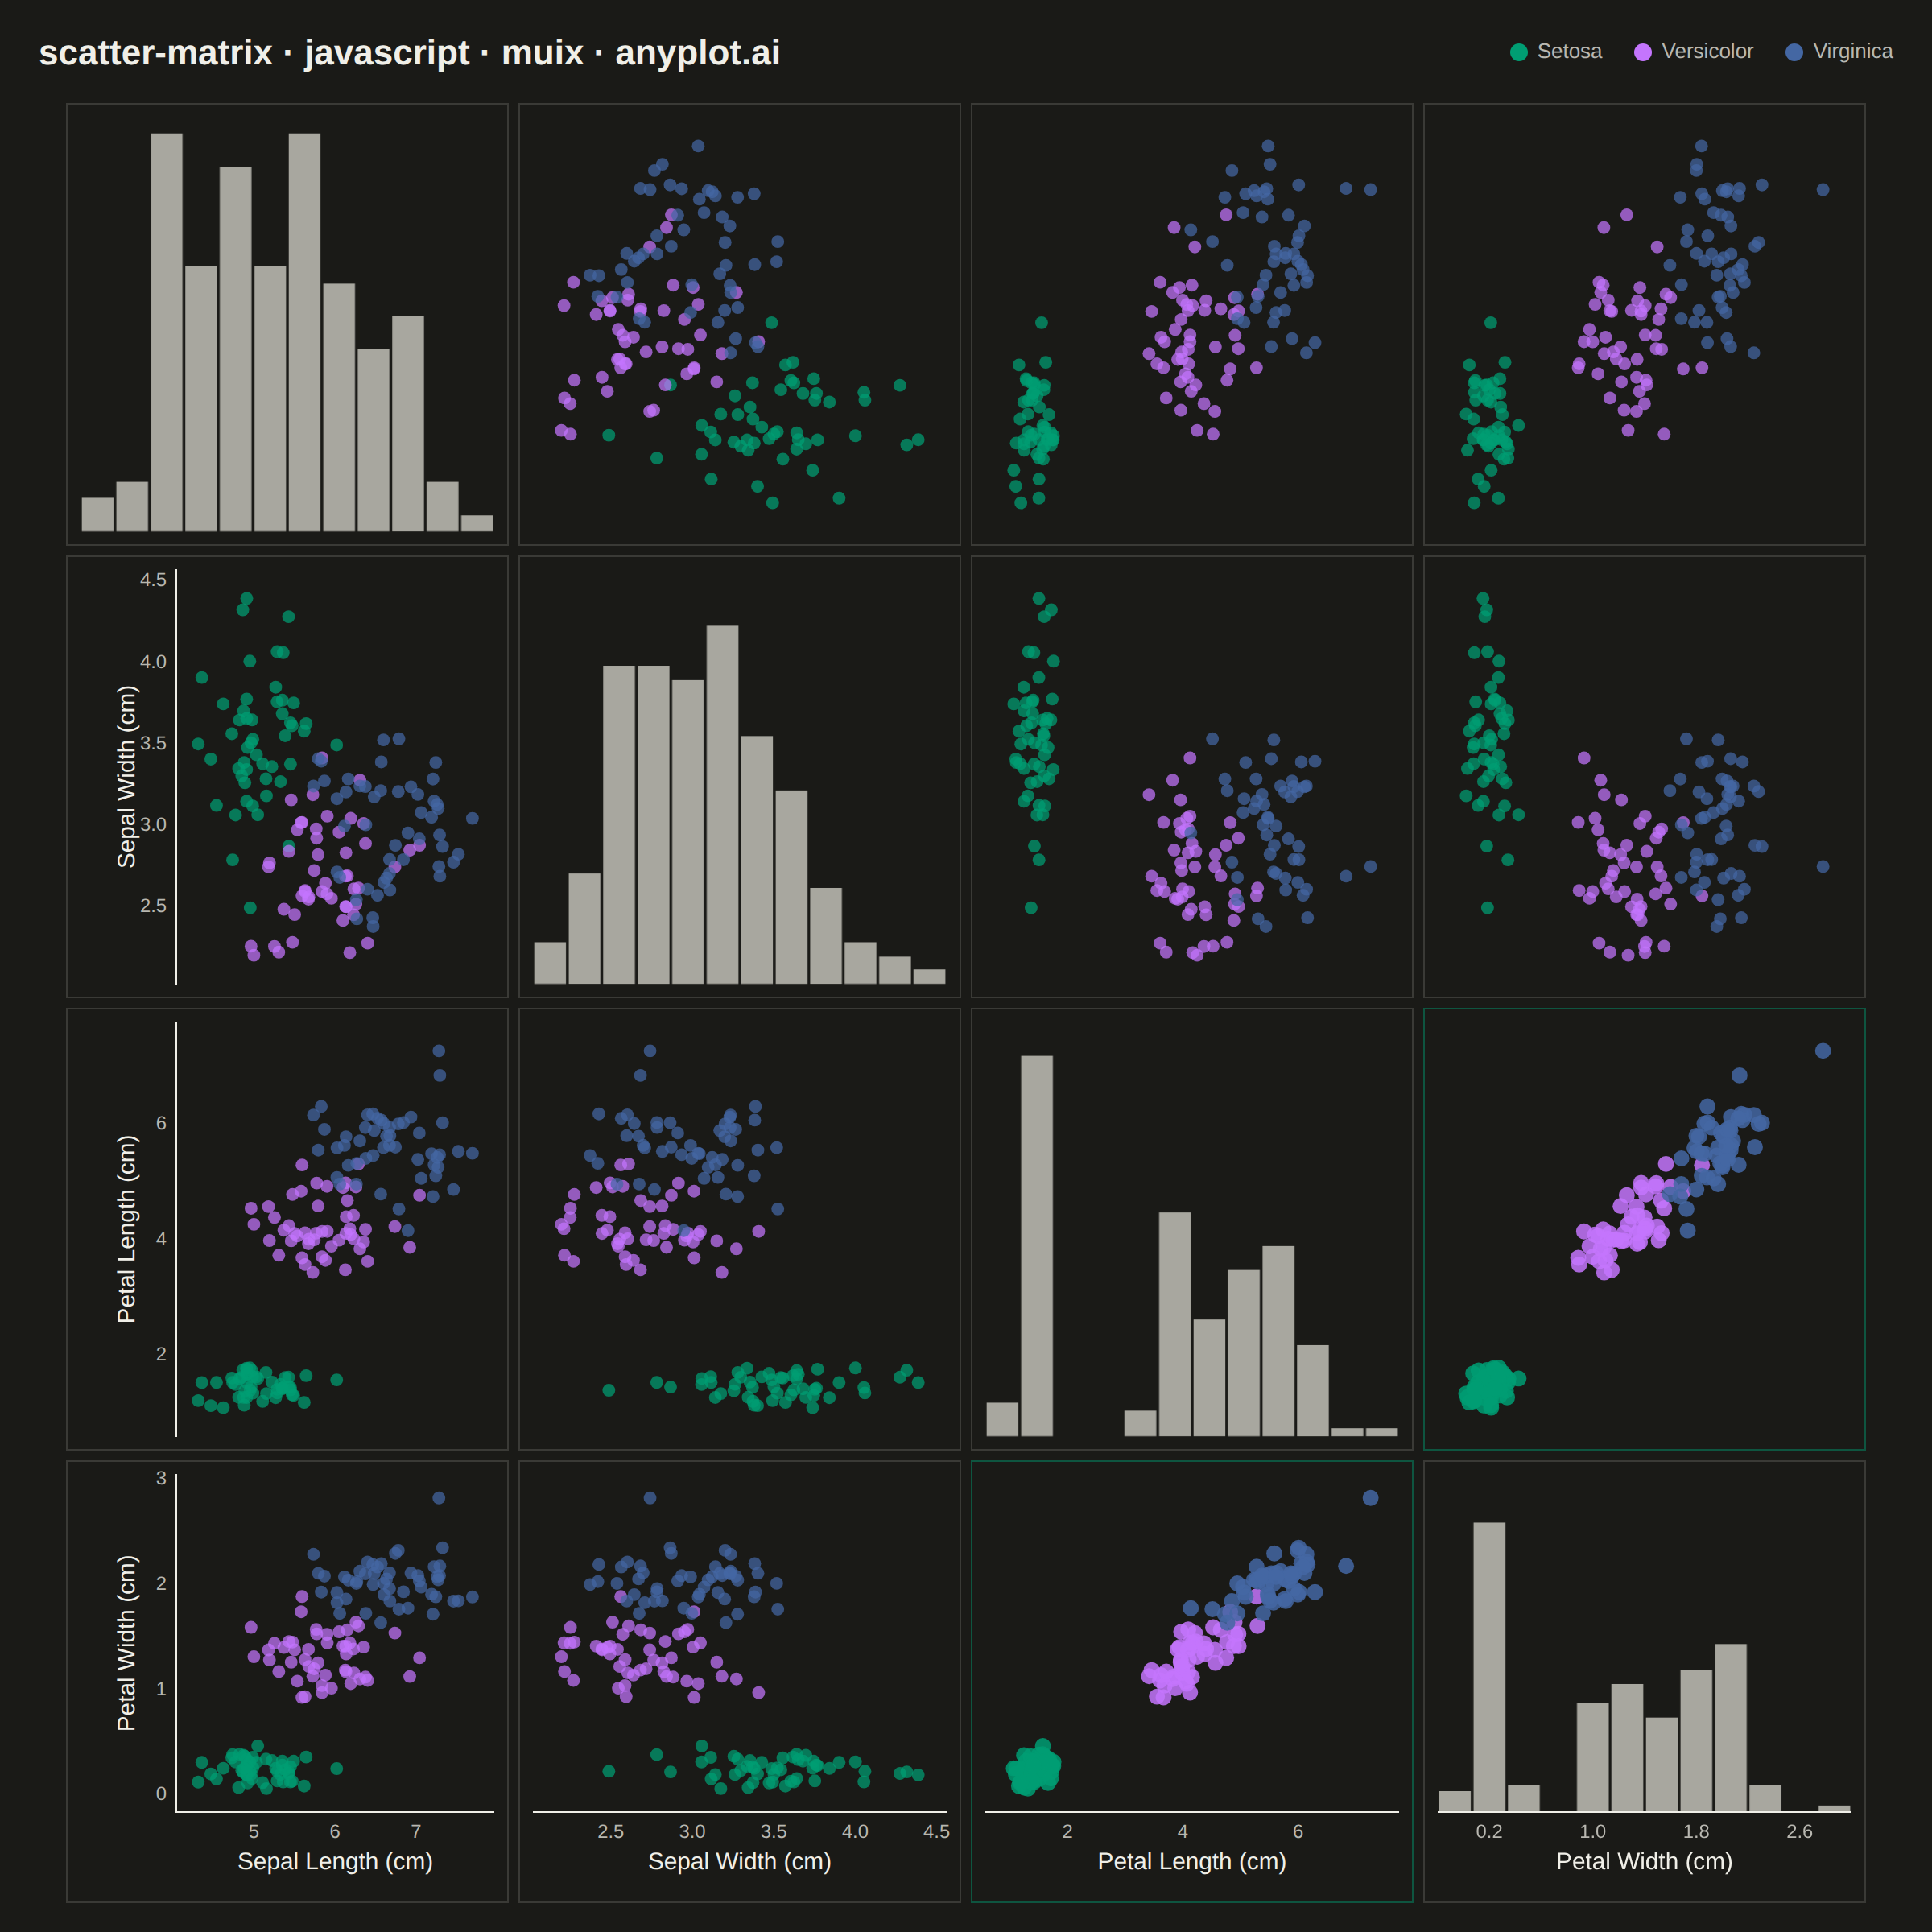
A grid of scatter plots showing all pairwise relationships between multiple variables, with histograms or kernel density estimates on the diagonal. This comprehensive visualization enables simultaneous exploration of correlations and distributions across an entire dataset, making it invaluable for understanding multivariate data structure at a glance. Also known as a pairplot or SPLOM (Scatter Plot Matrix).
// anyplot.ai
// scatter-matrix: Scatter Plot Matrix
// Library: muix 7.29.1 | JavaScript 22.23.2
// Quality: 91/100 | Created: 2026-09-09
//# anyplot-orientation: square
import { ScatterChart } from "@mui/x-charts/ScatterChart";
import { BarChart } from "@mui/x-charts/BarChart";
import Box from "@mui/material/Box";
import Typography from "@mui/material/Typography";

const t = window.ANYPLOT_TOKENS;
const size = window.ANYPLOT_SIZE;

// Theme-adaptive chrome the harness's ThemeProvider doesn't expose directly —
// the "muted" semantic anchor from default-style-guide.md (other/rest role,
// used here for the diagonal's univariate distribution).
const INK = t.ink;
const INK_SOFT = t.inkSoft;
const MUTED = t.theme === "dark" ? "#A8A79F" : "#6B6A63";

function hexToRgba(hex, alpha) {
  const r = parseInt(hex.slice(1, 3), 16);
  const g = parseInt(hex.slice(3, 5), 16);
  const b = parseInt(hex.slice(5, 7), 16);
  return `rgba(${r},${g},${b},${alpha})`;
}

// --- Deterministic PRNG (Box-Muller over a tiny LCG) ------------------------
function makeLcg(seed) {
  let state = seed;
  return () => {
    state = (state * 1664525 + 1013904223) % 4294967296;
    return state / 4294967296;
  };
}
const rand = makeLcg(20260909);

function normal(mean, std) {
  const u1 = Math.max(rand(), 1e-9);
  const u2 = rand();
  const z = Math.sqrt(-2 * Math.log(u1)) * Math.cos(2 * Math.PI * u2);
  return mean + std * z;
}

// --- Data (in-memory, deterministic) ----------------------------------------
// Iris-shaped multivariate data: 4 continuous flower measurements across 3
// species, generated from each species' approximate real-world summary
// statistics. Petal length/width are correlated within species so the matrix
// has a genuine relationship to reveal, not just cluster separation.
const VARS = [
  { key: "sepalLength", label: "Sepal Length (cm)" },
  { key: "sepalWidth", label: "Sepal Width (cm)" },
  { key: "petalLength", label: "Petal Length (cm)" },
  { key: "petalWidth", label: "Petal Width (cm)" },
];
const N = VARS.length;

const SPECIES = [
  {
    name: "Setosa",
    color: t.palette[0],
    sepalLength: { mean: 5.0, std: 0.35 },
    sepalWidth: { mean: 3.42, std: 0.38 },
    petalLength: { mean: 1.46, std: 0.17 },
    petalWidthMean: 0.24,
    petalWidthSlope: 0.15,
    petalWidthNoise: 0.08,
  },
  {
    name: "Versicolor",
    color: t.palette[1],
    sepalLength: { mean: 5.94, std: 0.52 },
    sepalWidth: { mean: 2.77, std: 0.31 },
    petalLength: { mean: 4.26, std: 0.47 },
    petalWidthMean: 1.33,
    petalWidthSlope: 0.36,
    petalWidthNoise: 0.14,
  },
  {
    name: "Virginica",
    color: t.palette[2],
    sepalLength: { mean: 6.59, std: 0.64 },
    sepalWidth: { mean: 2.97, std: 0.32 },
    petalLength: { mean: 5.55, std: 0.55 },
    petalWidthMean: 2.03,
    petalWidthSlope: 0.28,
    petalWidthNoise: 0.16,
  },
];
const POINTS_PER_SPECIES = 50;

const points = SPECIES.flatMap((species, speciesIndex) =>
  Array.from({ length: POINTS_PER_SPECIES }, (_, i) => {
    const sepalLength = normal(
      species.sepalLength.mean,
      species.sepalLength.std,
    );
    const sepalWidth = normal(species.sepalWidth.mean, species.sepalWidth.std);
    const petalLength = Math.max(
      0.1,
      normal(species.petalLength.mean, species.petalLength.std),
    );
    const petalWidth = Math.max(
      0.05,
      species.petalWidthMean +
        species.petalWidthSlope * (petalLength - species.petalLength.mean) +
        normal(0, species.petalWidthNoise),
    );
    return {
      id: `${speciesIndex}-${i}`,
      speciesIndex,
      sepalLength,
      sepalWidth,
      petalLength,
      petalWidth,
    };
  }),
);

// Shared per-variable domain (padded) so every row/column lines up across the
// matrix, and a matching histogram for the diagonal cells.
const domains = {};
const histograms = {};
const HIST_BINS = 12;
VARS.forEach(({ key }) => {
  const values = points.map((p) => p[key]);
  const min = Math.min(...values);
  const max = Math.max(...values);
  const pad = (max - min) * 0.08;
  const domain = [min - pad, max + pad];
  domains[key] = domain;

  const binWidth = (domain[1] - domain[0]) / HIST_BINS;
  const counts = new Array(HIST_BINS).fill(0);
  values.forEach((v) => {
    const idx = Math.min(
      HIST_BINS - 1,
      Math.max(0, Math.floor((v - domain[0]) / binWidth)),
    );
    counts[idx] += 1;
  });
  const labels = counts.map((_, i) =>
    (domain[0] + binWidth * (i + 0.5)).toFixed(1),
  );
  histograms[key] = { counts, labels };
});

// --- Layout ------------------------------------------------------------------
const HEADER_H = 64;
const SIDE_PAD = 16;
const CELL_GAP = 6;
const cell = Math.floor(
  Math.min(
    size.width - 2 * SIDE_PAD - (N - 1) * CELL_GAP,
    size.height - HEADER_H - SIDE_PAD - (N - 1) * CELL_GAP,
  ) / N,
);
const EDGE_LABEL = 15;
const EDGE_TICK = 12;

// Petal length vs. petal width is the pair with the clearest species
// separation (per the AI review's data-storytelling feedback) — a subtle
// marker emphasis on those cells helps the reader find the strongest story
// without scanning all 16 panels.
const HIGHLIGHT_VARS = new Set(["petalLength", "petalWidth"]);

function axisTextStyle(fontSize, fill) {
  return { fontSize, fill, fontFamily: "inherit" };
}

// --- Chart (default-exported component — the harness mounts it) -------------
export default function Chart() {
  const cells = [];
  for (let row = 0; row < N; row += 1) {
    for (let col = 0; col < N; col += 1) {
      const isDiagonal = row === col;
      const rowVar = VARS[row];
      const colVar = VARS[col];
      const isHighlight =
        !isDiagonal &&
        HIGHLIGHT_VARS.has(rowVar.key) &&
        HIGHLIGHT_VARS.has(colVar.key);
      const showXEdge = row === N - 1;
      const showYEdge = !isDiagonal && col === 0;
      const margin = {
        top: 8,
        right: 8,
        bottom: showXEdge ? 56 : 8,
        left: showYEdge ? 68 : 8,
      };

      let content;
      if (isDiagonal) {
        const { counts, labels } = histograms[colVar.key];
        content = (
          <BarChart
            width={cell}
            height={cell}
            margin={margin}
            skipAnimation
            series={[{ data: counts, color: MUTED }]}
            xAxis={[
              {
                scaleType: "band",
                data: labels,
                categoryGapRatio: 0.08,
                barGapRatio: 0,
                disableLine: !showXEdge,
                disableTicks: true,
                tickLabelInterval: showXEdge
                  ? (_v, i) => i % 3 === 1
                  : () => false,
                label: showXEdge ? colVar.label : undefined,
                labelStyle: axisTextStyle(EDGE_LABEL, INK),
                tickLabelStyle: axisTextStyle(EDGE_TICK, INK_SOFT),
              },
            ]}
            yAxis={[
              {
                disableLine: true,
                disableTicks: true,
                tickLabelInterval: () => false,
              },
            ]}
            slotProps={{ legend: { hidden: true } }}
            tooltip={{ trigger: "none" }}
          />
        );
      } else {
        const series = SPECIES.map((species, speciesIndex) => ({
          id: species.name,
          label: species.name,
          color: hexToRgba(species.color, isHighlight ? 0.85 : 0.72),
          markerSize: isHighlight ? 5 : 4,
          data: points
            .filter((p) => p.speciesIndex === speciesIndex)
            .map((p) => ({ id: p.id, x: p[colVar.key], y: p[rowVar.key] })),
        }));
        content = (
          <ScatterChart
            width={cell}
            height={cell}
            margin={margin}
            skipAnimation
            disableVoronoi
            series={series}
            xAxis={[
              {
                min: domains[colVar.key][0],
                max: domains[colVar.key][1],
                disableLine: !showXEdge,
                disableTicks: true,
                tickLabelInterval: showXEdge ? "auto" : () => false,
                label: showXEdge ? colVar.label : undefined,
                labelStyle: axisTextStyle(EDGE_LABEL, INK),
                tickLabelStyle: axisTextStyle(EDGE_TICK, INK_SOFT),
              },
            ]}
            yAxis={[
              {
                min: domains[rowVar.key][0],
                max: domains[rowVar.key][1],
                disableLine: !showYEdge,
                disableTicks: true,
                tickLabelInterval: showYEdge ? "auto" : () => false,
                label: showYEdge ? rowVar.label : undefined,
                labelStyle: axisTextStyle(EDGE_LABEL, INK),
                tickLabelStyle: axisTextStyle(EDGE_TICK, INK_SOFT),
              },
            ]}
            slotProps={{ legend: { hidden: true } }}
            tooltip={{ trigger: "none" }}
          />
        );
      }

      cells.push(
        <Box
          key={`${row}-${col}`}
          sx={{
            width: cell,
            height: cell,
            border: isHighlight
              ? `1px solid ${hexToRgba(t.palette[0], 0.45)}`
              : `1px solid ${t.grid}`,
            boxSizing: "border-box",
            display: "flex",
            alignItems: "center",
            justifyContent: "center",
          }}
        >
          {content}
        </Box>,
      );
    }
  }

  return (
    <Box
      sx={{
        width: size.width,
        height: size.height,
        display: "flex",
        flexDirection: "column",
      }}
    >
      <Box
        sx={{
          height: HEADER_H,
          display: "flex",
          alignItems: "center",
          justifyContent: "space-between",
          px: 3,
        }}
      >
        <Typography sx={{ fontSize: 22, fontWeight: 600, color: INK }}>
          scatter-matrix · javascript · muix · anyplot.ai
        </Typography>
        <Box sx={{ display: "flex", gap: 2.5 }}>
          {SPECIES.map((species) => (
            <Box
              key={species.name}
              sx={{ display: "flex", alignItems: "center", gap: 0.75 }}
            >
              <Box
                sx={{
                  width: 11,
                  height: 11,
                  borderRadius: "50%",
                  backgroundColor: species.color,
                  flexShrink: 0,
                }}
              />
              <Typography sx={{ fontSize: 13, color: INK_SOFT }}>
                {species.name}
              </Typography>
            </Box>
          ))}
        </Box>
      </Box>
      <Box
        sx={{
          display: "grid",
          gridTemplateColumns: `repeat(${N}, ${cell}px)`,
          gridTemplateRows: `repeat(${N}, ${cell}px)`,
          gap: `${CELL_GAP}px`,
          margin: "0 auto",
        }}
      >
        {cells}
      </Box>
    </Box>
  );
}
Runnable source as JSON, for any HTTP client: https://api.anyplot.ai/specs/scatter-matrix/muix/code. Any spec id and library id listed in llms-full.txt fit the same URL shape; every URL below is complete and callable.
{
  "spec_id": "scatter-matrix",
  "language": "javascript",
  "library": "muix",
  "page": "https://anyplot.ai/scatter-matrix/javascript/muix",
  "hub": "https://anyplot.ai/scatter-matrix",
  "code_json": "https://api.anyplot.ai/specs/scatter-matrix/muix/code",
  "spec_json": "https://api.anyplot.ai/specs/scatter-matrix",
  "render_light_png": "https://storage.googleapis.com/anyplot-images/plots/scatter-matrix/javascript/muix/plot-light.png",
  "render_dark_png": "https://storage.googleapis.com/anyplot-images/plots/scatter-matrix/javascript/muix/plot-dark.png",
  "interactive_light_html": "https://storage.googleapis.com/anyplot-images/plots/scatter-matrix/javascript/muix/plot-light.html",
  "interactive_dark_html": "https://storage.googleapis.com/anyplot-images/plots/scatter-matrix/javascript/muix/plot-dark.html",
  "quality_score": 91.0,
  "license": "MIT",
  "guide": "https://anyplot.ai/llms.txt"
}
Part of Scatter Plot Matrix on anyplot.ai.