The same plot in 14 other libraries — JavaScript: D3.js, Apache ECharts, Highcharts, MUI X Charts; Python: Altair, Bokeh, lets-plot, Matplotlib, Plotly, plotnine, Pygal, Seaborn; R: ggplot2; Julia: Makie.jl. Compare all 15 side by side: Smith Chart for RF/Impedance in Python, R, Julia and JavaScript.
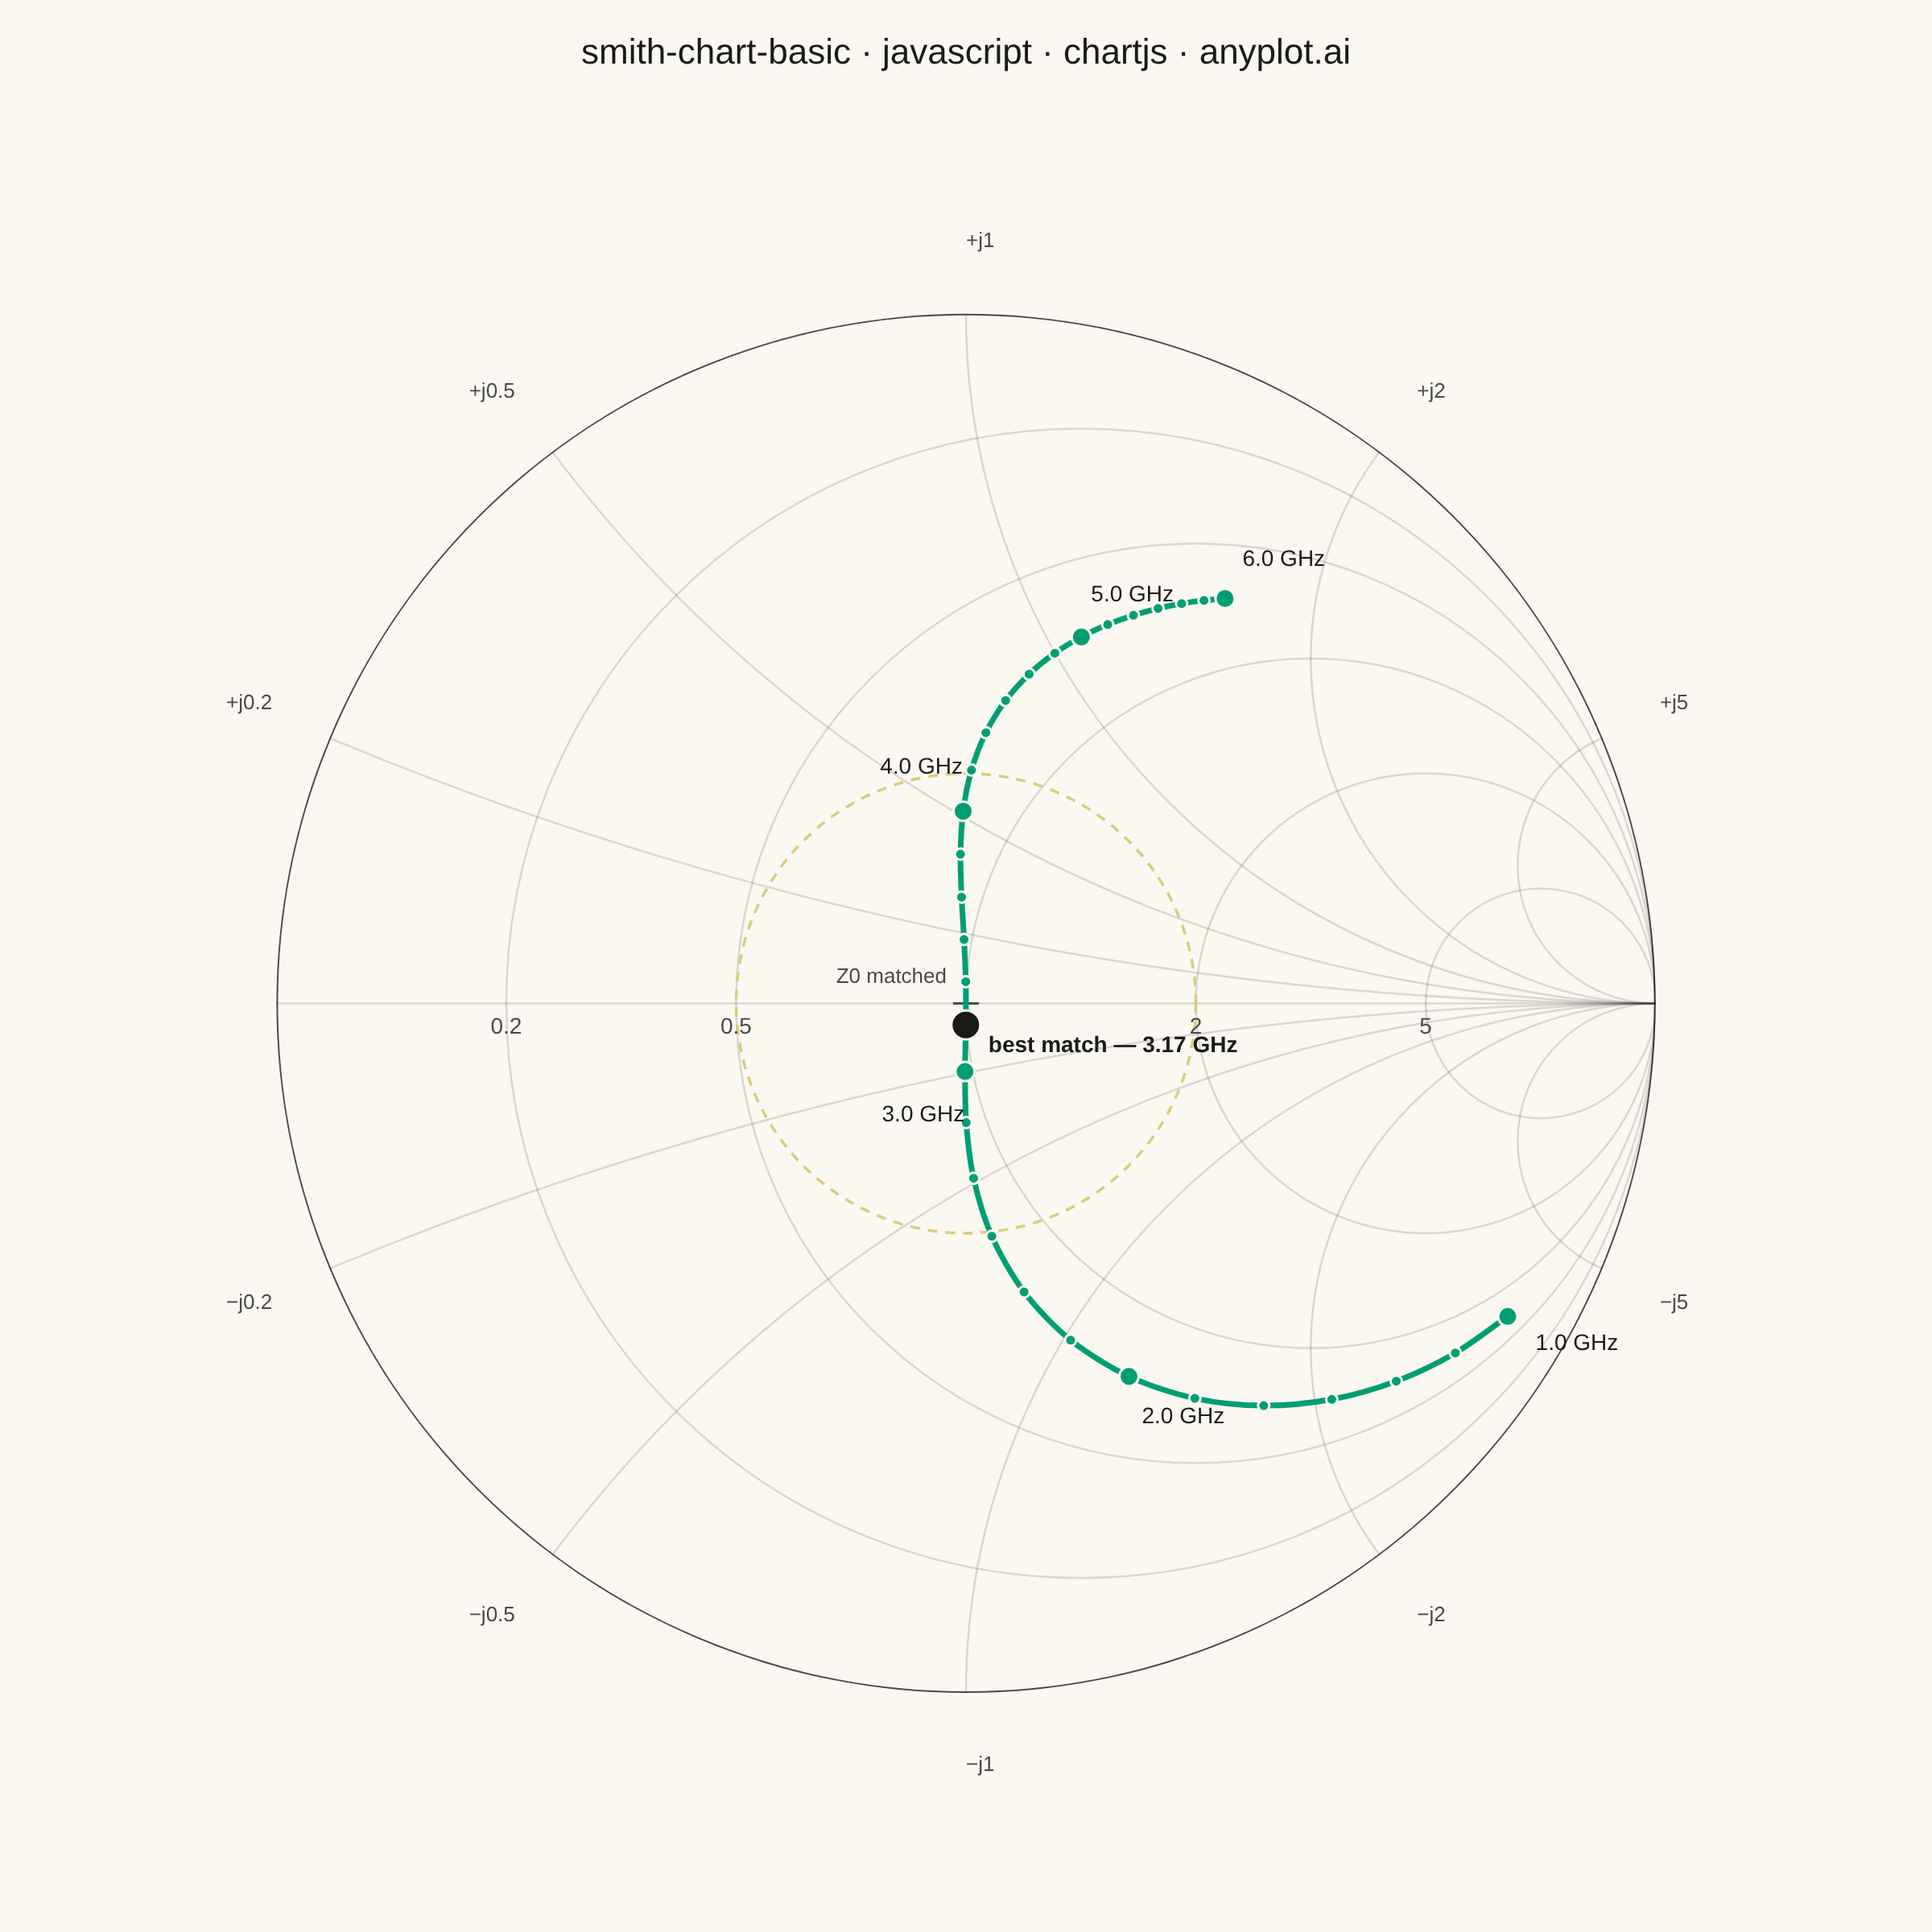
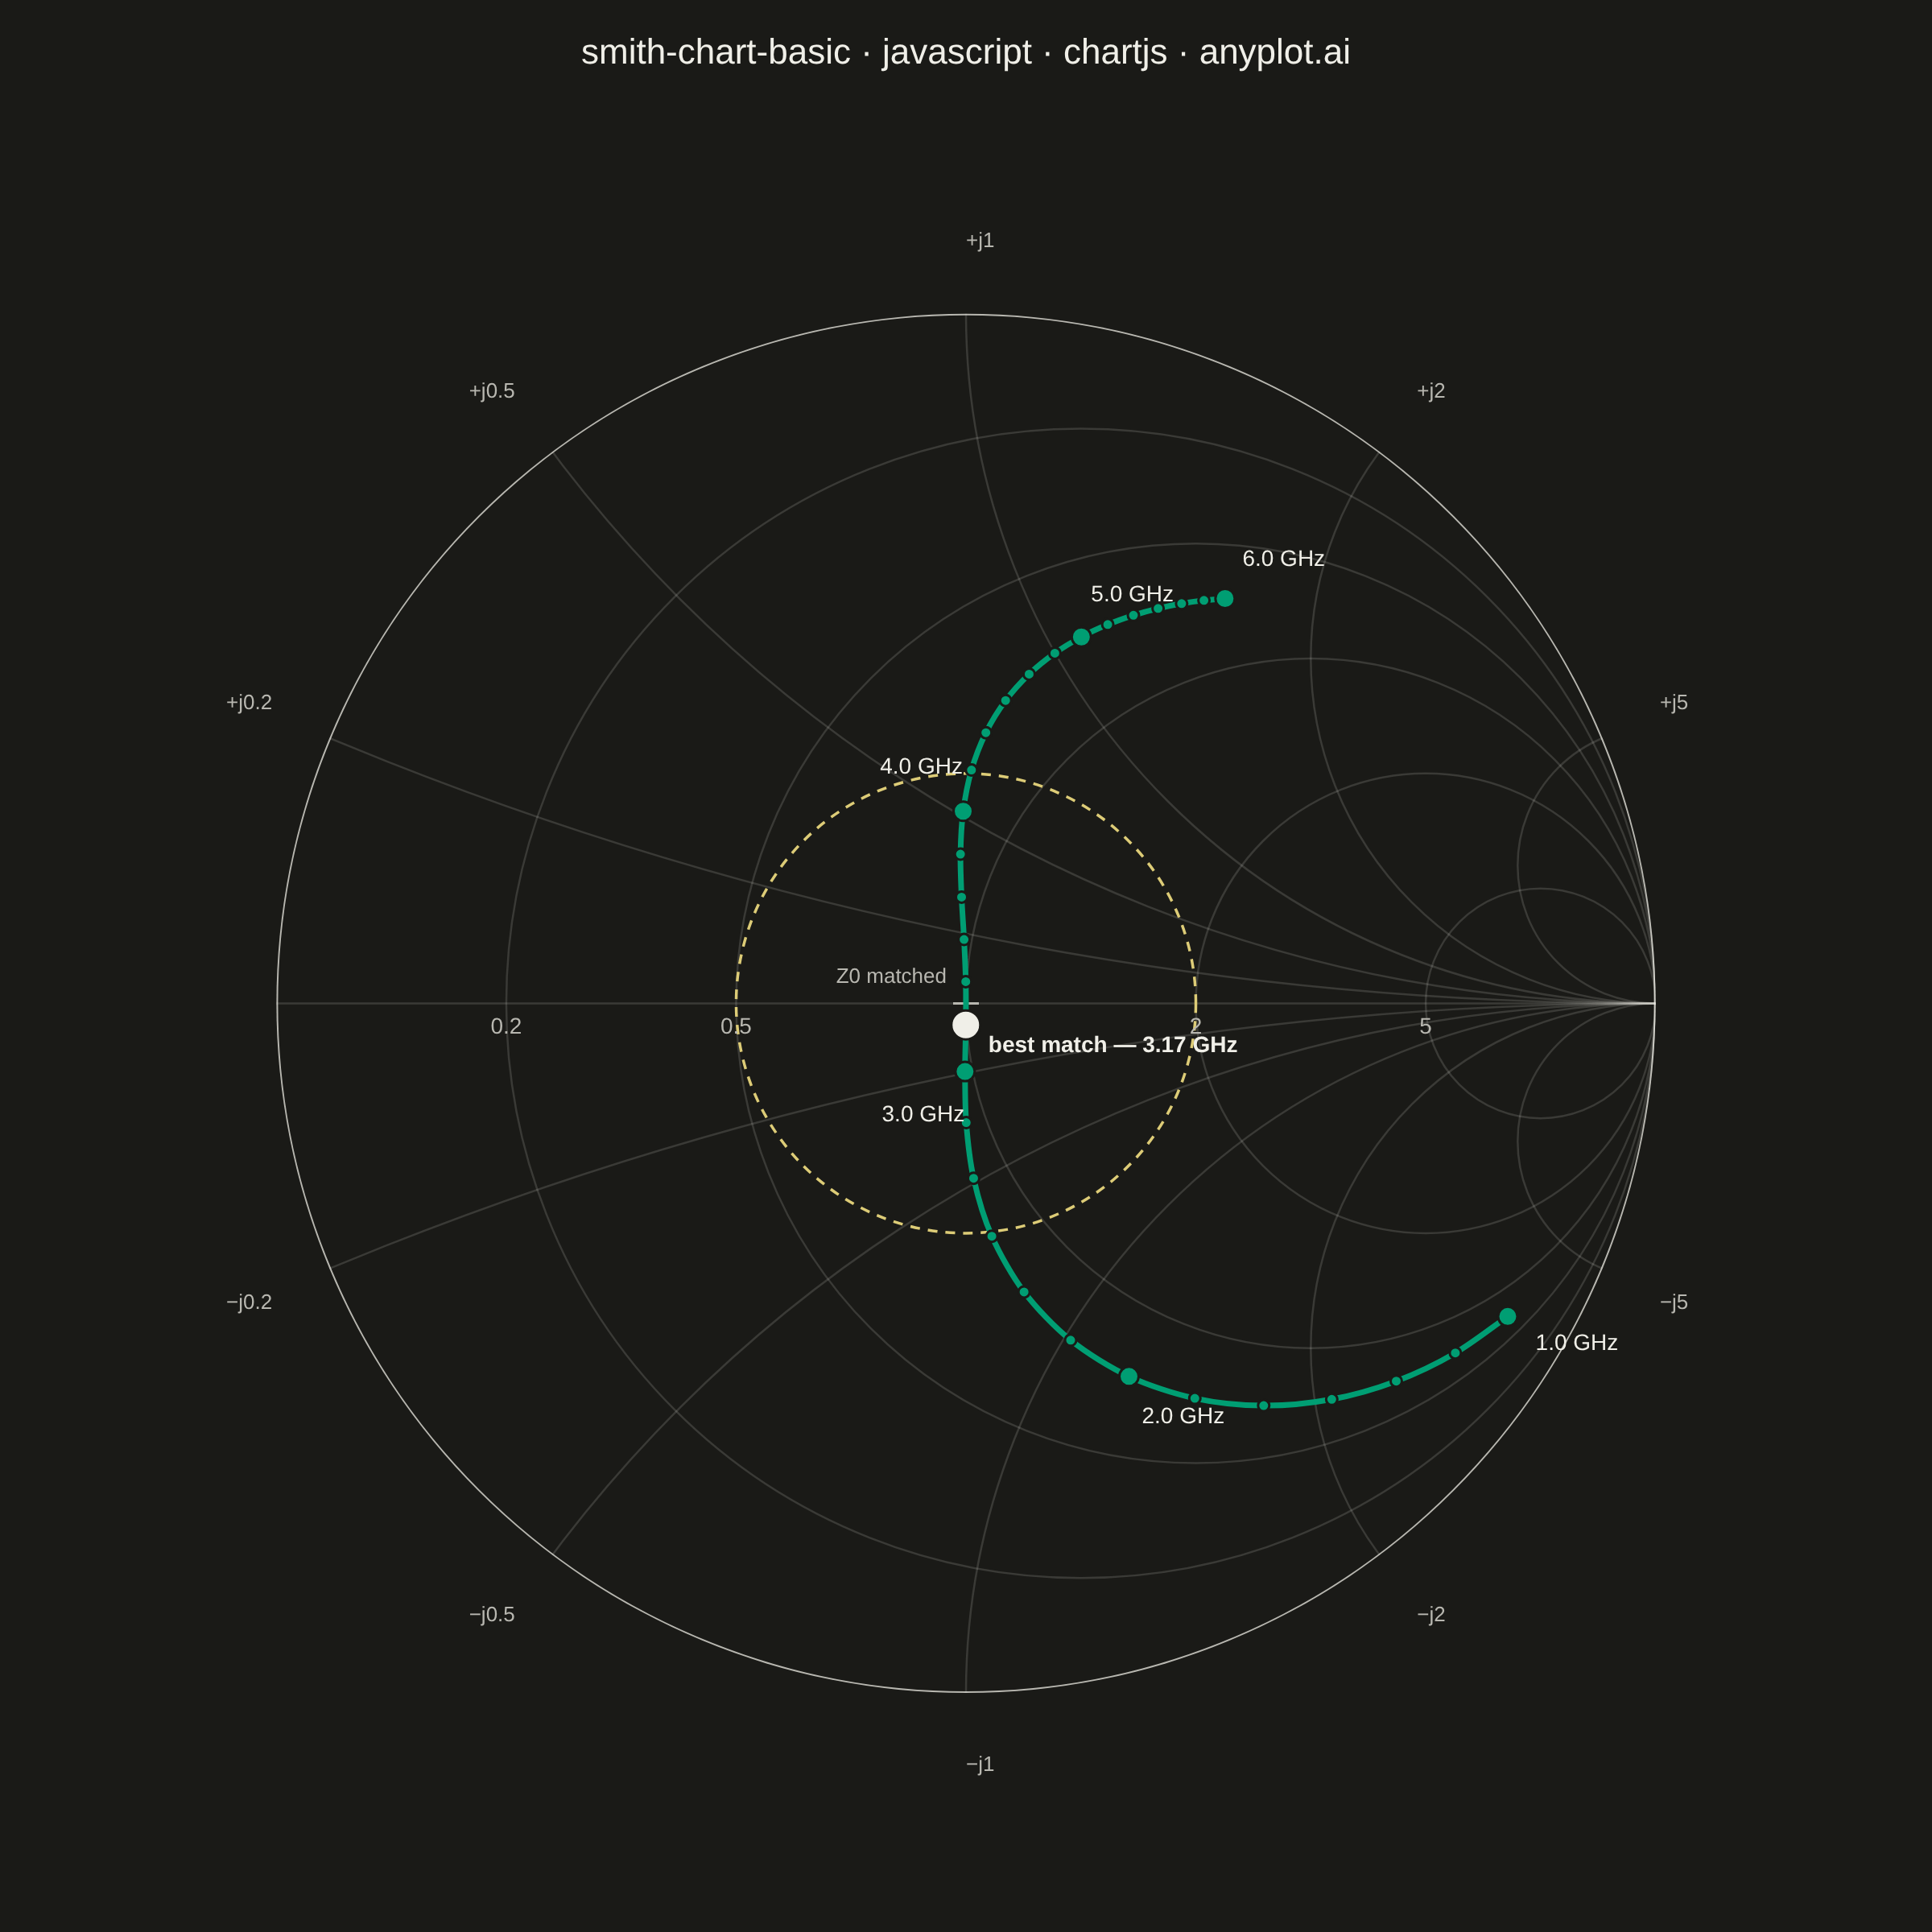
A Smith chart is a specialized circular diagram used in RF engineering to display complex impedance and reflection coefficients on a normalized polar grid. The chart features constant resistance circles (centered along the horizontal axis) and constant reactance arcs (curving from the right edge), enabling engineers to visualize impedance matching, transmission line behavior, and antenna characteristics. It reveals relationships between impedance, admittance, and reflection coefficient that would be difficult to interpret in Cartesian coordinates.
// anyplot.ai
// smith-chart-basic: Smith Chart for RF/Impedance
// Library: chartjs 4.4.7 | JavaScript 22.23.2
// Quality: 92/100 | Created: 2026-09-02

//# anyplot-orientation: square
const t = window.ANYPLOT_TOKENS;

// --- Data: S11 sweep of an antenna feed impedance across 1-6 GHz -----------
// A short series inductor plus a parasitic capacitance models the feed
// reactance; resistance is a Gaussian bump that peaks at Z0 exactly at the
// self-resonant frequency, the way a real antenna's radiation resistance
// approaches a matched condition near resonance.
const referenceImpedance = 50; // Z0, ohms
const seriesInductanceH = 3e-9; // 3 nH feed inductance
const parasiticCapacitanceF = 0.8e-12; // 0.8 pF parasitic capacitance
const selfResonantFreqHz = 1 / (2 * Math.PI * Math.sqrt(seriesInductanceH * parasiticCapacitanceF));

const sweepStartHz = 1e9;
const sweepEndHz = 6e9;
const sweepPointCount = 31;

// Standard reflection-coefficient closed form: Gamma = (z - 1) / (z + 1),
// z the impedance normalized to the reference impedance z0.
function toReflectionCoefficient(resistance, reactance, z0) {
  const zReal = resistance / z0;
  const zImag = reactance / z0;
  const denominator = (zReal + 1) ** 2 + zImag ** 2;
  return {
    x: (zReal ** 2 + zImag ** 2 - 1) / denominator,
    y: (2 * zImag) / denominator,
  };
}

const sweepPoints = Array.from({ length: sweepPointCount }, (_, i) => {
  const frequencyHz = sweepStartHz + ((sweepEndHz - sweepStartHz) * i) / (sweepPointCount - 1);
  const omega = 2 * Math.PI * frequencyHz;
  const reactance = omega * seriesInductanceH - 1 / (omega * parasiticCapacitanceF);
  const detuning = (frequencyHz - selfResonantFreqHz) / 0.9e9;
  const resistance = 35 + 15 * Math.exp(-(detuning * detuning));
  const gamma = toReflectionCoefficient(resistance, reactance, referenceImpedance);
  return { frequencyHz, resistance, reactance, x: gamma.x, y: gamma.y };
});

let bestMatchIndex = 0;
sweepPoints.forEach((point, i) => {
  const magnitude = Math.hypot(point.x, point.y);
  const bestMagnitude = Math.hypot(sweepPoints[bestMatchIndex].x, sweepPoints[bestMatchIndex].y);
  if (magnitude < bestMagnitude) bestMatchIndex = i;
});
const labeledIndices = [0, 6, 12, 18, 24, 30];

// --- Smith chart grid geometry (normalized Gamma-plane, |Gamma| <= 1) ------
// Constant-resistance circles: center (r/(1+r), 0), radius 1/(1+r) — r=0
// degenerates to the |Gamma|=1 boundary itself.
// Constant-reactance arcs: center (1, 1/x), radius 1/|x| — x=0 degenerates
// to the real axis, drawn separately as a straight line.
const resistanceCircleValues = [0, 0.2, 0.5, 1, 2, 5];
const reactanceArcValues = [0.2, 0.5, 1, 2, 5];
const vswrReferenceValue = 2;
const vswrReferenceRadius = (vswrReferenceValue - 1) / (vswrReferenceValue + 1);

// --- Mount -------------------------------------------------------------------
const canvas = document.createElement("canvas");
document.getElementById("container").appendChild(canvas);

// Chart.js has no per-axis "equal aspect" option; without one the Smith
// chart's circles render as ellipses whenever the title bar leaves the
// chart area taller or shorter than it is wide. This plugin measures
// pixels-per-unit on both axes after layout and expands the tighter axis's
// range to match, so the circles stay true circles. Guarded by $aspectDone
// so the single corrective chart.update() it triggers doesn't recurse.
const equalAspectPlugin = {
  id: "equalAspect",
  afterLayout(chart) {
    if (chart.$aspectDone) return;
    const { chartArea, scales } = chart;
    const xs = scales.x;
    const ys = scales.y;
    const pxPerUnitX = chartArea.width / (xs.max - xs.min);
    const pxPerUnitY = chartArea.height / (ys.max - ys.min);
    if (pxPerUnitX < pxPerUnitY) {
      const yCenter = (ys.min + ys.max) / 2;
      const halfRange = chartArea.height / pxPerUnitX / 2;
      ys.options.min = yCenter - halfRange;
      ys.options.max = yCenter + halfRange;
    } else {
      const xCenter = (xs.min + xs.max) / 2;
      const halfRange = chartArea.width / pxPerUnitY / 2;
      xs.options.min = xCenter - halfRange;
      xs.options.max = xCenter + halfRange;
    }
    chart.$aspectDone = true;
    chart.update("none");
  },
};

// Chart.js core ships no Smith-chart geometry, so the grid (resistance
// circles, reactance arcs, VSWR reference, value labels) is drawn directly
// on the canvas via the public plugin hooks — the documented way to extend
// core Chart.js rendering, same technique as the mohr-circle entry.
const smithChartPlugin = {
  id: "smithChart",
  beforeDatasetsDraw(chart) {
    const { ctx, scales } = chart;
    const px = (v) => scales.x.getPixelForValue(v);
    const py = (v) => scales.y.getPixelForValue(v);
    const originX = px(0);
    const originY = py(0);
    const unitPx = Math.abs(px(1) - originX);

    ctx.save();
    ctx.beginPath();
    ctx.arc(originX, originY, unitPx, 0, 2 * Math.PI);
    ctx.clip();

    resistanceCircleValues.forEach((r) => {
      const centerX = px(r / (1 + r));
      const radiusPx = unitPx / (1 + r);
      ctx.beginPath();
      ctx.arc(centerX, originY, radiusPx, 0, 2 * Math.PI);
      ctx.lineWidth = r === 0 ? 2 : 1.25;
      ctx.strokeStyle = r === 0 ? t.inkSoft : t.grid;
      ctx.stroke();
    });

    reactanceArcValues.forEach((xValue) => {
      [xValue, -xValue].forEach((signedX) => {
        const centerY = py(1 / signedX);
        const radiusPx = unitPx / Math.abs(signedX);
        ctx.beginPath();
        ctx.arc(px(1), centerY, radiusPx, 0, 2 * Math.PI);
        ctx.lineWidth = 1.25;
        ctx.strokeStyle = t.grid;
        ctx.stroke();
      });
    });

    // Zero-reactance line: the x=0 arc degenerates to the real axis.
    ctx.beginPath();
    ctx.moveTo(px(-1), originY);
    ctx.lineTo(px(1), originY);
    ctx.lineWidth = 1.25;
    ctx.strokeStyle = t.grid;
    ctx.stroke();

    // Optional VSWR reference circle (constant |Gamma| boundary, dashed).
    ctx.beginPath();
    ctx.setLineDash([6, 5]);
    ctx.lineWidth = 1.75;
    ctx.strokeStyle = t.amber;
    ctx.arc(originX, originY, vswrReferenceRadius * unitPx, 0, 2 * Math.PI);
    ctx.stroke();
    ctx.setLineDash([]);

    ctx.restore();

    // Resistance-value labels, anchored where each circle crosses the real
    // axis on its low-|Gamma| side (same closed-form used for the data curve).
    // r=1 is skipped: its anchor is the origin itself, already marked by the
    // matched-condition crosshair below.
    ctx.save();
    ctx.font = "500 14px -apple-system, sans-serif";
    ctx.fillStyle = t.inkSoft;
    ctx.textAlign = "center";
    ctx.textBaseline = "top";
    resistanceCircleValues
      .filter((r) => r > 0 && r !== 1)
      .forEach((r) => {
        const anchor = toReflectionCoefficient(r, 0, 1);
        ctx.fillText(String(r), px(anchor.x), originY + 8);
      });
    ctx.restore();

    // Reactance-value labels, anchored on the |Gamma|=1 boundary via the same
    // reflection formula with resistance=0 (a pure reactance always maps to
    // the boundary), nudged further out for legibility.
    ctx.save();
    ctx.font = "500 13px -apple-system, sans-serif";
    ctx.fillStyle = t.inkSoft;
    reactanceArcValues.forEach((xValue) => {
      [xValue, -xValue].forEach((signedX) => {
        const boundary = toReflectionCoefficient(0, signedX, 1);
        const labelX = px(boundary.x * 1.09);
        const labelY = py(boundary.y * 1.09);
        ctx.textAlign = boundary.x >= 0 ? "left" : "right";
        ctx.textBaseline = boundary.y >= 0 ? "bottom" : "top";
        ctx.fillText(`${signedX > 0 ? "+" : "−"}j${Math.abs(signedX)}`, labelX, labelY);
      });
    });
    ctx.restore();

    // Matched-condition crosshair (Gamma = 0, Z = Z0) at the chart's center.
    ctx.save();
    ctx.strokeStyle = t.inkSoft;
    ctx.lineWidth = 1.5;
    ctx.beginPath();
    ctx.moveTo(originX - 8, originY);
    ctx.lineTo(originX + 8, originY);
    ctx.moveTo(originX, originY - 8);
    ctx.lineTo(originX, originY + 8);
    ctx.stroke();
    ctx.font = "500 13px -apple-system, sans-serif";
    ctx.fillStyle = t.inkSoft;
    ctx.textAlign = "right";
    ctx.textBaseline = "bottom";
    ctx.fillText("Z0 matched", originX - 12, originY - 10);
    ctx.restore();
  },
  afterDatasetsDraw(chart) {
    const { ctx, scales } = chart;
    const px = (v) => scales.x.getPixelForValue(v);
    const py = (v) => scales.y.getPixelForValue(v);

    ctx.save();
    ctx.font = "500 14px -apple-system, sans-serif";
    ctx.fillStyle = t.ink;
    labeledIndices.forEach((index) => {
      const point = sweepPoints[index];
      const cx = px(point.x);
      const cy = py(point.y);
      const magnitude = Math.hypot(point.x, point.y) || 1;
      const ux = point.x / magnitude;
      const uy = point.y / magnitude;
      const labelX = cx + ux * 20;
      const labelY = cy - uy * 20;
      ctx.textAlign = ux >= 0 ? "left" : "right";
      ctx.textBaseline = uy >= 0 ? "bottom" : "top";
      ctx.fillText(`${(point.frequencyHz / 1e9).toFixed(1)} GHz`, labelX, labelY);
    });

    const bestPoint = sweepPoints[bestMatchIndex];
    ctx.font = "600 14px -apple-system, sans-serif";
    ctx.textAlign = "left";
    ctx.textBaseline = "top";
    ctx.fillText(`best match — ${(bestPoint.frequencyHz / 1e9).toFixed(2)} GHz`, px(bestPoint.x) + 14, py(bestPoint.y) + 6);
    ctx.restore();
  },
};

// --- Chart -------------------------------------------------------------------
new Chart(canvas, {
  type: "scatter",
  data: {
    datasets: [
      {
        label: "Impedance locus (Gamma)",
        data: sweepPoints,
        showLine: true,
        fill: false,
        tension: 0.3,
        borderColor: t.palette[0],
        borderWidth: 3.5,
        pointBackgroundColor: (context) => (context.dataIndex === bestMatchIndex ? t.ink : t.palette[0]),
        pointBorderColor: t.pageBg,
        pointBorderWidth: 1.5,
        pointRadius: (context) =>
          context.dataIndex === bestMatchIndex ? 9 : labeledIndices.includes(context.dataIndex) ? 6 : 3.5,
        pointHoverRadius: 9,
      },
    ],
  },
  options: {
    responsive: true,
    maintainAspectRatio: false,
    animation: false,
    layout: { padding: { top: 20, right: 30, bottom: 20, left: 30 } },
    plugins: {
      title: {
        display: true,
        text: "smith-chart-basic · javascript · chartjs · anyplot.ai",
        color: t.ink,
        font: { size: 22, weight: "500" },
        padding: { bottom: 20 },
      },
      legend: { display: false },
      tooltip: {
        callbacks: {
          label(context) {
            const point = sweepPoints[context.dataIndex];
            const freqGHz = (point.frequencyHz / 1e9).toFixed(2);
            const reactanceSign = point.reactance >= 0 ? "+" : "−";
            const gammaMagnitude = Math.hypot(point.x, point.y).toFixed(2);
            return `${freqGHz} GHz — Z = ${point.resistance.toFixed(1)} ${reactanceSign} j${Math.abs(point.reactance).toFixed(1)} Ω, |Gamma| = ${gammaMagnitude}`;
          },
        },
      },
    },
    scales: {
      x: { type: "linear", min: -1.3, max: 1.3, display: false },
      y: { type: "linear", min: -1.3, max: 1.3, display: false },
    },
  },
  plugins: [equalAspectPlugin, smithChartPlugin],
});
Runnable source as JSON, for any HTTP client: https://api.anyplot.ai/specs/smith-chart-basic/chartjs/code. Any spec id and library id listed in llms-full.txt fit the same URL shape; every URL below is complete and callable.
{
  "spec_id": "smith-chart-basic",
  "language": "javascript",
  "library": "chartjs",
  "page": "https://anyplot.ai/smith-chart-basic/javascript/chartjs",
  "hub": "https://anyplot.ai/smith-chart-basic",
  "code_json": "https://api.anyplot.ai/specs/smith-chart-basic/chartjs/code",
  "spec_json": "https://api.anyplot.ai/specs/smith-chart-basic",
  "render_light_png": "https://storage.googleapis.com/anyplot-images/plots/smith-chart-basic/javascript/chartjs/plot-light.png",
  "render_dark_png": "https://storage.googleapis.com/anyplot-images/plots/smith-chart-basic/javascript/chartjs/plot-dark.png",
  "interactive_light_html": "https://storage.googleapis.com/anyplot-images/plots/smith-chart-basic/javascript/chartjs/plot-light.html",
  "interactive_dark_html": "https://storage.googleapis.com/anyplot-images/plots/smith-chart-basic/javascript/chartjs/plot-dark.html",
  "quality_score": 92.0,
  "license": "MIT",
  "guide": "https://anyplot.ai/llms.txt"
}
Part of Smith Chart for RF/Impedance on anyplot.ai.