The same plot in 14 other libraries — JavaScript: Chart.js, D3.js, Highcharts, MUI X Charts; Python: Altair, Bokeh, lets-plot, Matplotlib, Plotly, plotnine, Pygal, Seaborn; R: ggplot2; Julia: Makie.jl. Compare all 15 side by side: Smith Chart for RF/Impedance in Python, R, Julia and JavaScript.
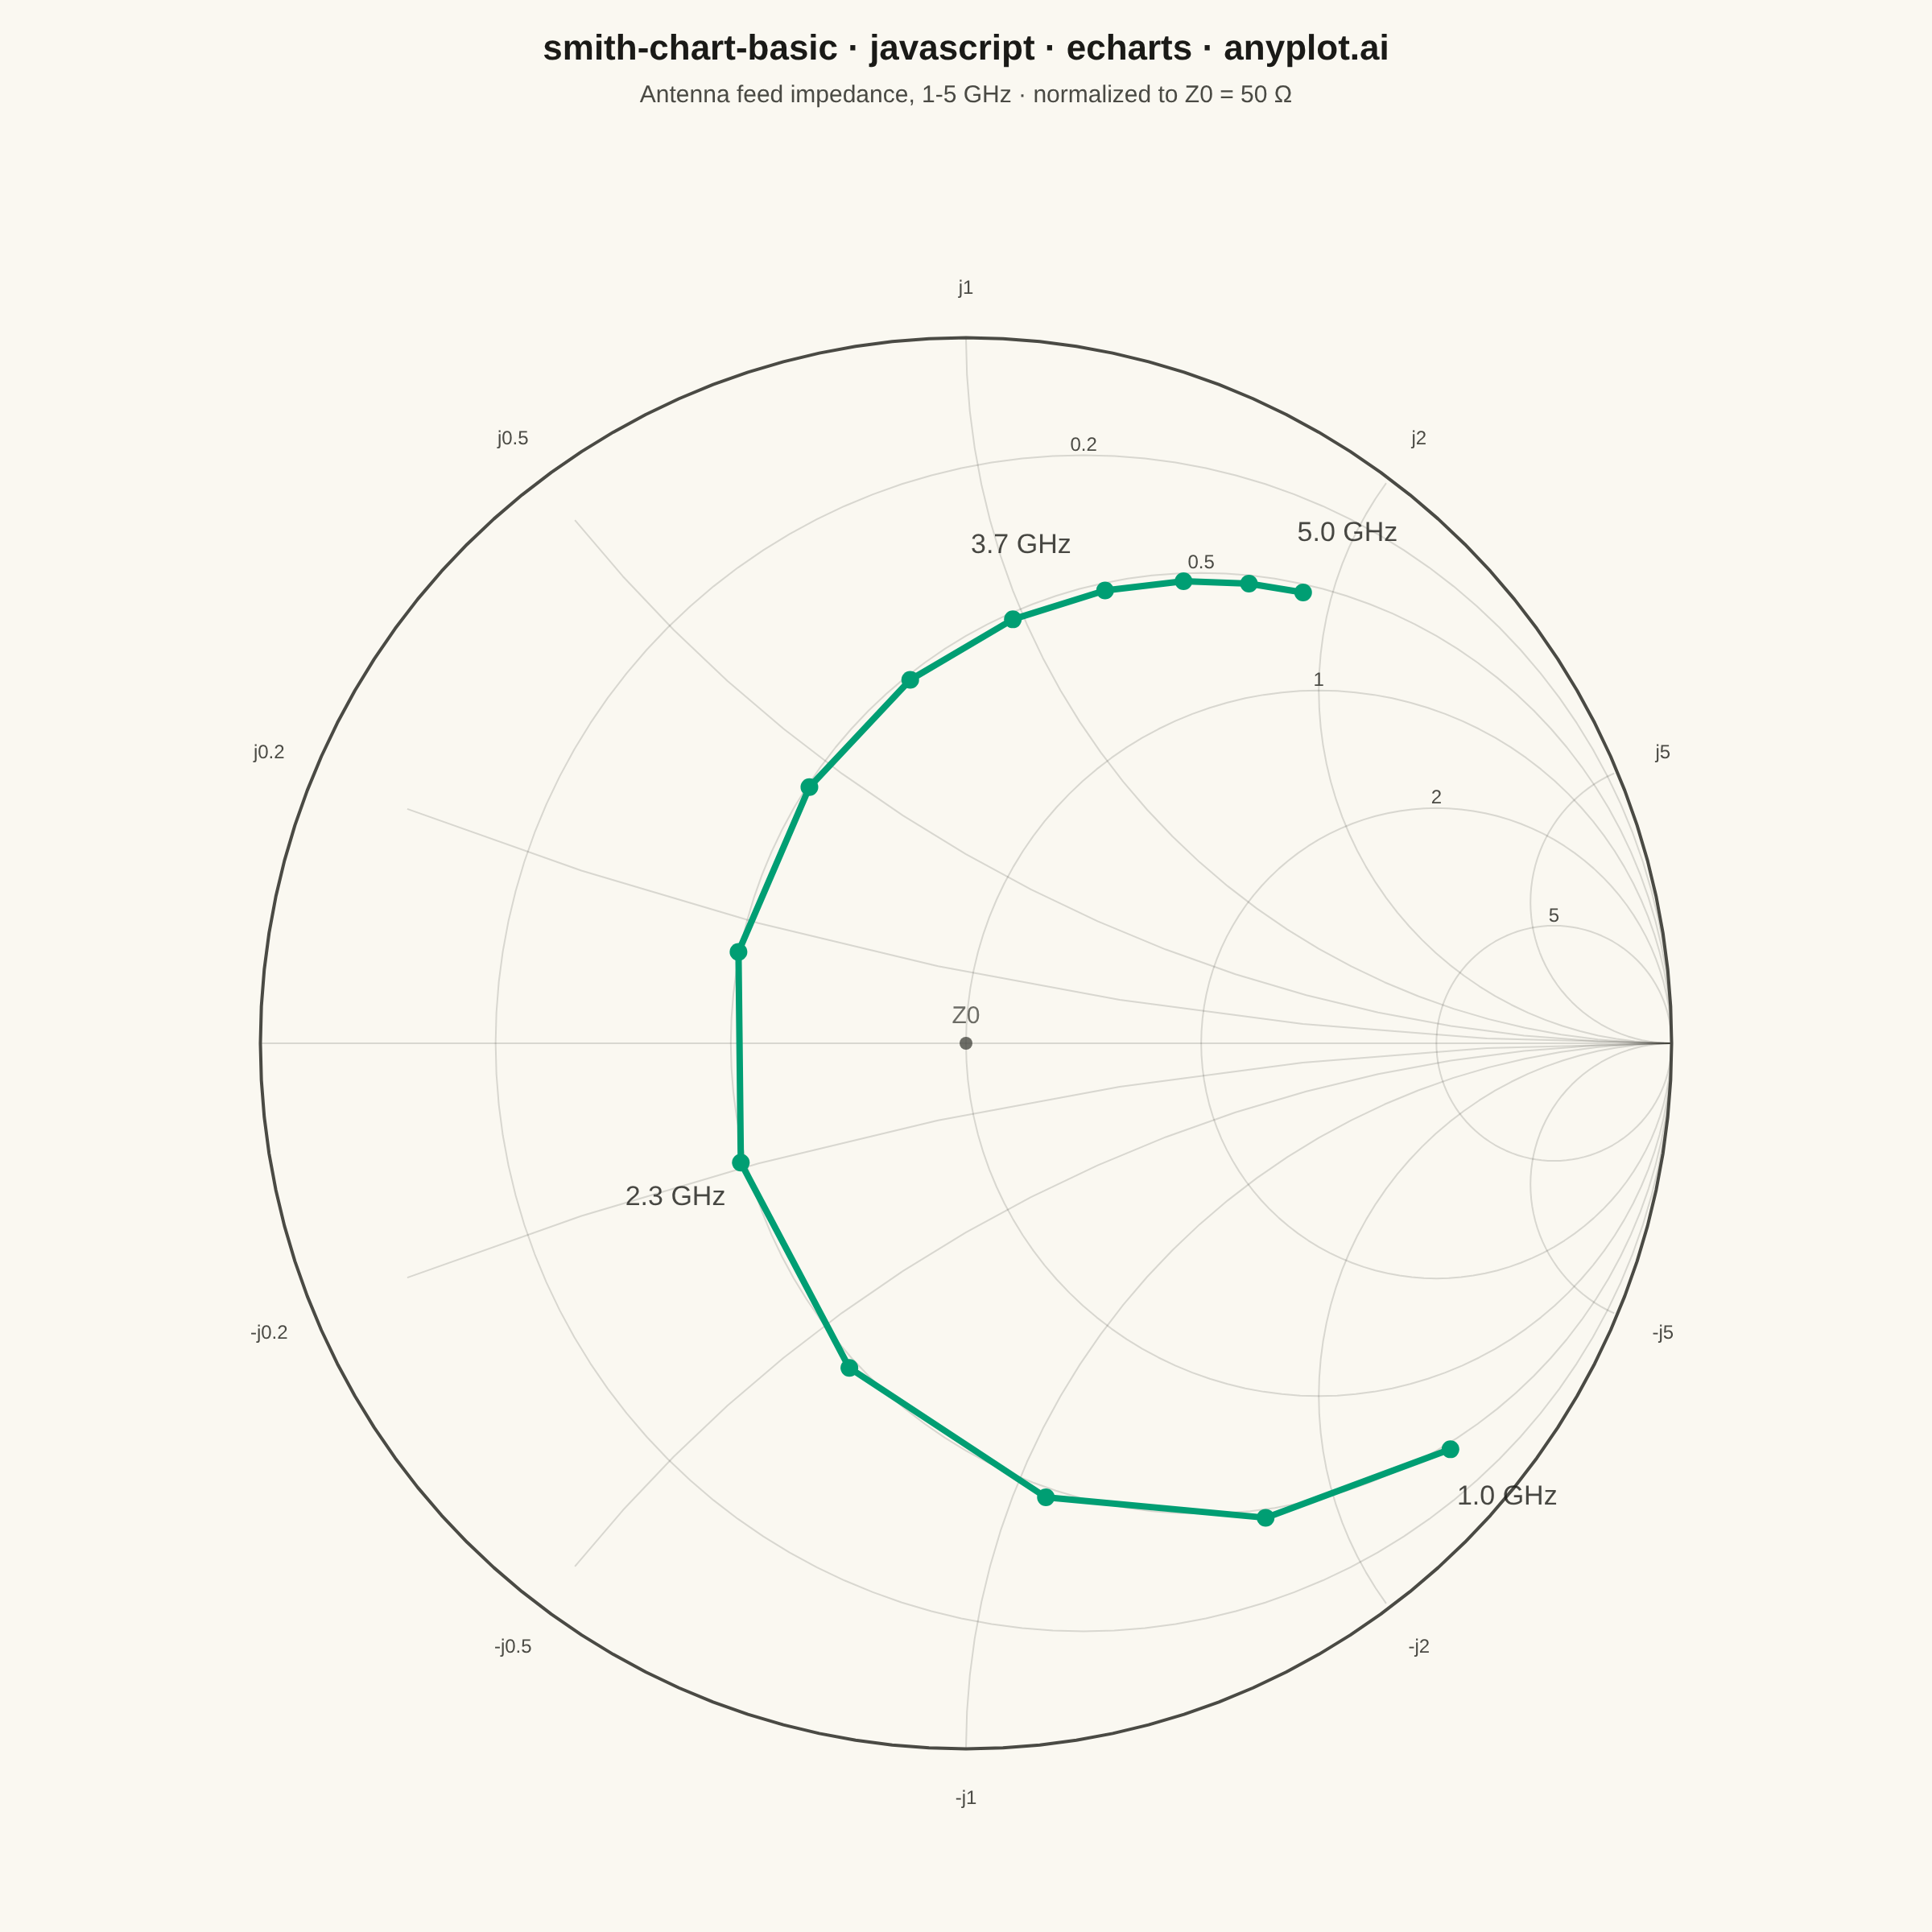
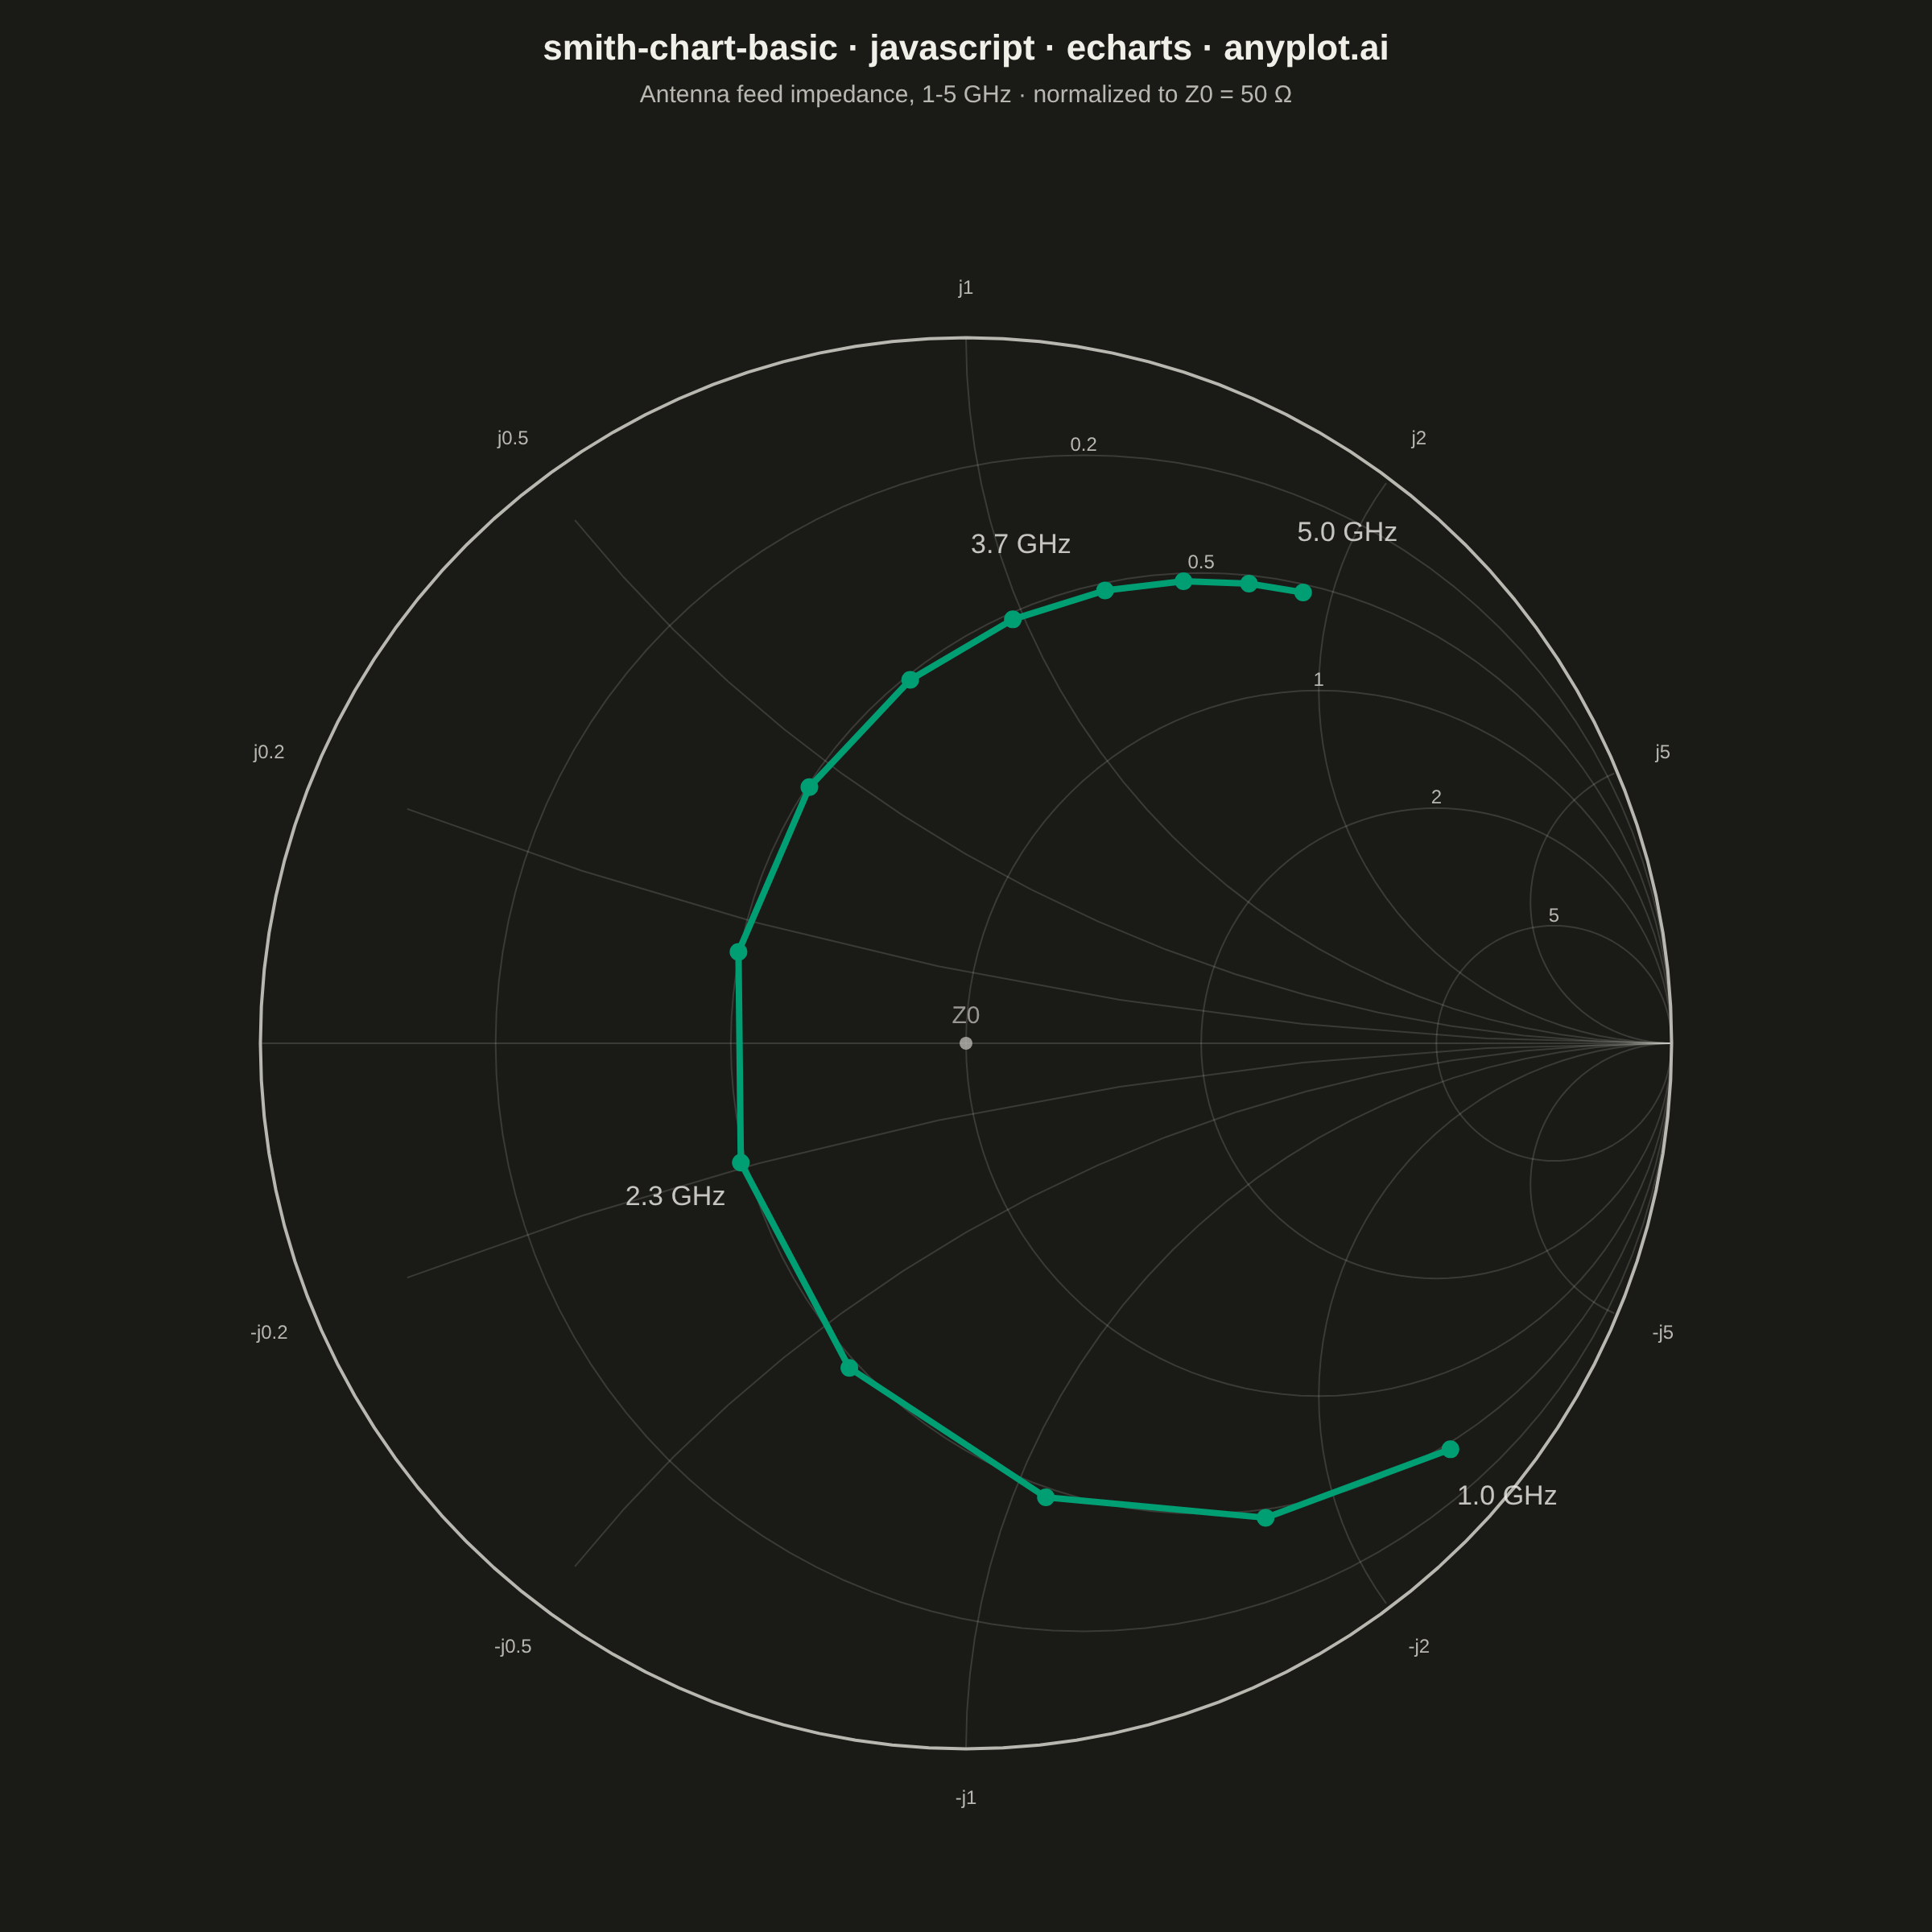
A Smith chart is a specialized circular diagram used in RF engineering to display complex impedance and reflection coefficients on a normalized polar grid. The chart features constant resistance circles (centered along the horizontal axis) and constant reactance arcs (curving from the right edge), enabling engineers to visualize impedance matching, transmission line behavior, and antenna characteristics. It reveals relationships between impedance, admittance, and reflection coefficient that would be difficult to interpret in Cartesian coordinates.
// anyplot.ai
// smith-chart-basic: Smith Chart for RF/Impedance
// Library: echarts 6.1.0 | JavaScript 22.23.2
// Quality: 91/100 | Created: 2026-09-02

//# anyplot-orientation: square

const t = window.ANYPLOT_TOKENS;

// --- Smith chart grid: constant-resistance circles + constant-reactance arcs ---
// All grid curves live in the reflection-coefficient (gamma) plane, where the
// chart boundary |gamma| = 1 is itself the r = 0 resistance circle.
const SEGMENTS = 120;

function resistanceCircle(r) {
  const cx = r / (1 + r);
  const cr = 1 / (1 + r);
  const pts = [];
  for (let i = 0; i <= SEGMENTS; i++) {
    const theta = (i / SEGMENTS) * 2 * Math.PI;
    pts.push([cx + cr * Math.cos(theta), cr * Math.sin(theta)]);
  }
  return pts;
}

function reactanceArc(x) {
  const cy = 1 / x;
  const cr = Math.abs(1 / x);
  const pts = [];
  for (let i = 0; i <= SEGMENTS; i++) {
    const theta = (i / SEGMENTS) * 2 * Math.PI;
    const px = 1 + cr * Math.cos(theta);
    const py = cy + cr * Math.sin(theta);
    // Keep only the stretch inside the unit disk — the rest of the full
    // parametric circle lies outside the chart and is dropped as a gap.
    pts.push(px * px + py * py <= 1.0005 ? [px, py] : null);
  }
  return pts;
}

const resistanceValues = [0.2, 0.5, 1, 2, 5];
const reactanceValues = [0.2, 0.5, 1, 2, 5];

const boundaryCircle = resistanceCircle(0);
const resistanceCircles = resistanceValues.map(resistanceCircle);
const reactanceArcsPos = reactanceValues.map(reactanceArc);
const reactanceArcsNeg = reactanceValues.map((x) => reactanceArc(-x));
const zeroReactanceLine = [
  [-1, 0],
  [1, 0],
];

// --- Grid value labels: top of each resistance circle, boundary crossing of
// each reactance arc. Rendered later via the `graphic` component once the
// coordinate system exists, so positions are exact pixel conversions rather
// than approximations.
const resistanceLabelData = resistanceValues.map((r) => ({
  text: String(r),
  point: [r / (1 + r), 1 / (1 + r)],
}));

function reactanceEdgePoint(x) {
  const theta = 2 * Math.atan(1 / x);
  return [Math.cos(theta), Math.sin(theta)];
}

const reactanceLabelData = [
  ...reactanceValues.map((x) => {
    const [px, py] = reactanceEdgePoint(x);
    return { text: `j${x}`, point: [px * 1.07, py * 1.07] };
  }),
  ...reactanceValues.map((x) => {
    const [px, py] = reactanceEdgePoint(x);
    return { text: `-j${x}`, point: [px * 1.07, -py * 1.07] };
  }),
];

// --- Impedance locus: series R-L-C antenna feed, swept 1-5 GHz -------------
const z0 = 50;
const inductanceH = 4e-9; // 4 nH series feed inductance
const capacitanceF = 1e-12; // 1 pF series feed capacitance
const numPoints = 13;
const freqStartHz = 1e9;
const freqEndHz = 5e9;

const locus = [];
for (let i = 0; i < numPoints; i++) {
  const freqHz = freqStartHz + ((freqEndHz - freqStartHz) * i) / (numPoints - 1);
  const resistance = 20 + 3 * Math.sqrt(freqHz / 1e9); // skin-effect-like rise
  const reactance =
    2 * Math.PI * freqHz * inductanceH - 1 / (2 * Math.PI * freqHz * capacitanceF);
  const zRe = resistance / z0;
  const zIm = reactance / z0;

  // gamma = (z - 1) / (z + 1), complex division
  const a = zRe - 1;
  const b = zIm;
  const c = zRe + 1;
  const d = zIm;
  const denomSq = c * c + d * d;
  const gammaRe = (a * c + b * d) / denomSq;
  const gammaIm = (b * c - a * d) / denomSq;

  locus.push({ freqGHz: freqHz / 1e9, point: [gammaRe, gammaIm] });
}

const locusPoints = locus.map((d) => d.point);
const labeledIndices = [0, 4, 8, numPoints - 1];
const freqLabelData = labeledIndices.map((idx) => {
  const { freqGHz, point } = locus[idx];
  const [x, y] = point;
  const norm = Math.sqrt(x * x + y * y) || 1;
  return {
    value: point,
    label: {
      show: true,
      formatter: `${freqGHz.toFixed(1)} GHz`,
      color: t.ink,
      fontSize: 17,
      offset: [(x / norm) * 46, -(y / norm) * 46],
    },
  };
});

// --- Init ---------------------------------------------------------------
const chart = echarts.init(document.getElementById("container"));

// --- Option ---------------------------------------------------------------
const gridLineStyle = { color: t.grid, width: 1 };
const gridSeriesBase = {
  type: "line",
  symbol: "none",
  smooth: false,
  silent: true,
  connectNulls: false,
  z: 1,
};

const gridSeries = [
  ...resistanceCircles.map((data) => ({ ...gridSeriesBase, data, lineStyle: gridLineStyle })),
  ...reactanceArcsPos.map((data) => ({ ...gridSeriesBase, data, lineStyle: gridLineStyle })),
  ...reactanceArcsNeg.map((data) => ({ ...gridSeriesBase, data, lineStyle: gridLineStyle })),
  { ...gridSeriesBase, data: zeroReactanceLine, lineStyle: gridLineStyle },
  {
    ...gridSeriesBase,
    data: boundaryCircle,
    lineStyle: { color: t.inkSoft, width: 2 },
    z: 2,
  },
];

chart.setOption({
  animation: false,
  backgroundColor: "transparent",
  title: {
    text: "smith-chart-basic · javascript · echarts · anyplot.ai",
    subtext: "Antenna feed impedance, 1-5 GHz · normalized to Z0 = 50 Ω",
    left: "center",
    textStyle: { color: t.ink, fontSize: 22 },
    subtextStyle: { color: t.inkSoft, fontSize: 15 },
  },
  grid: { left: "8%", right: "8%", top: "12%", bottom: "4%" },
  xAxis: {
    type: "value",
    min: -1.15,
    max: 1.15,
    show: false,
  },
  yAxis: {
    type: "value",
    min: -1.15,
    max: 1.15,
    show: false,
  },
  series: [
    ...gridSeries,
    {
      type: "scatter",
      name: "Matched",
      data: [[0, 0]],
      symbolSize: 8,
      itemStyle: { color: t.inkSoft },
      label: {
        show: true,
        formatter: "Z0",
        position: "top",
        color: t.inkSoft,
        fontSize: 15,
      },
      silent: true,
      z: 3,
    },
    {
      type: "line",
      name: "S11 locus",
      data: locusPoints,
      symbol: "circle",
      symbolSize: 11,
      lineStyle: { color: t.palette[0], width: 4 },
      itemStyle: { color: t.palette[0] },
      z: 5,
    },
    {
      type: "scatter",
      name: "Frequency labels",
      data: freqLabelData,
      symbolSize: 0,
      silent: true,
      z: 6,
    },
  ],
});

// --- Grid value labels via the `graphic` component -------------------------
// Placed after the first setOption so convertToPixel resolves exact pixel
// coordinates from the grid's data space, rather than approximating with
// percentage offsets.
const gridLabelStyle = { fill: t.inkSoft, fontSize: 12, textAlign: "center" };
const gridLabelElements = [
  ...resistanceLabelData.map(({ text, point }) => {
    const [x, y] = chart.convertToPixel({ xAxisIndex: 0, yAxisIndex: 0 }, point);
    return {
      type: "text",
      x,
      y,
      silent: true,
      z: 4,
      style: { ...gridLabelStyle, text, textVerticalAlign: "bottom" },
    };
  }),
  ...reactanceLabelData.map(({ text, point }) => {
    const [x, y] = chart.convertToPixel({ xAxisIndex: 0, yAxisIndex: 0 }, point);
    return {
      type: "text",
      x,
      y,
      silent: true,
      z: 4,
      style: { ...gridLabelStyle, text, textVerticalAlign: "middle" },
    };
  }),
];

chart.setOption({ graphic: { elements: gridLabelElements } });
Runnable source as JSON, for any HTTP client: https://api.anyplot.ai/specs/smith-chart-basic/echarts/code. Any spec id and library id listed in llms-full.txt fit the same URL shape; every URL below is complete and callable.
{
  "spec_id": "smith-chart-basic",
  "language": "javascript",
  "library": "echarts",
  "page": "https://anyplot.ai/smith-chart-basic/javascript/echarts",
  "hub": "https://anyplot.ai/smith-chart-basic",
  "code_json": "https://api.anyplot.ai/specs/smith-chart-basic/echarts/code",
  "spec_json": "https://api.anyplot.ai/specs/smith-chart-basic",
  "render_light_png": "https://storage.googleapis.com/anyplot-images/plots/smith-chart-basic/javascript/echarts/plot-light.png",
  "render_dark_png": "https://storage.googleapis.com/anyplot-images/plots/smith-chart-basic/javascript/echarts/plot-dark.png",
  "interactive_light_html": "https://storage.googleapis.com/anyplot-images/plots/smith-chart-basic/javascript/echarts/plot-light.html",
  "interactive_dark_html": "https://storage.googleapis.com/anyplot-images/plots/smith-chart-basic/javascript/echarts/plot-dark.html",
  "quality_score": 91.0,
  "license": "MIT",
  "guide": "https://anyplot.ai/llms.txt"
}
Part of Smith Chart for RF/Impedance on anyplot.ai.