The same plot in 14 other libraries — JavaScript: Chart.js, D3.js, Apache ECharts, MUI X Charts; Python: Altair, Bokeh, lets-plot, Matplotlib, Plotly, plotnine, Pygal, Seaborn; R: ggplot2; Julia: Makie.jl. Compare all 15 side by side: Smith Chart for RF/Impedance in Python, R, Julia and JavaScript.
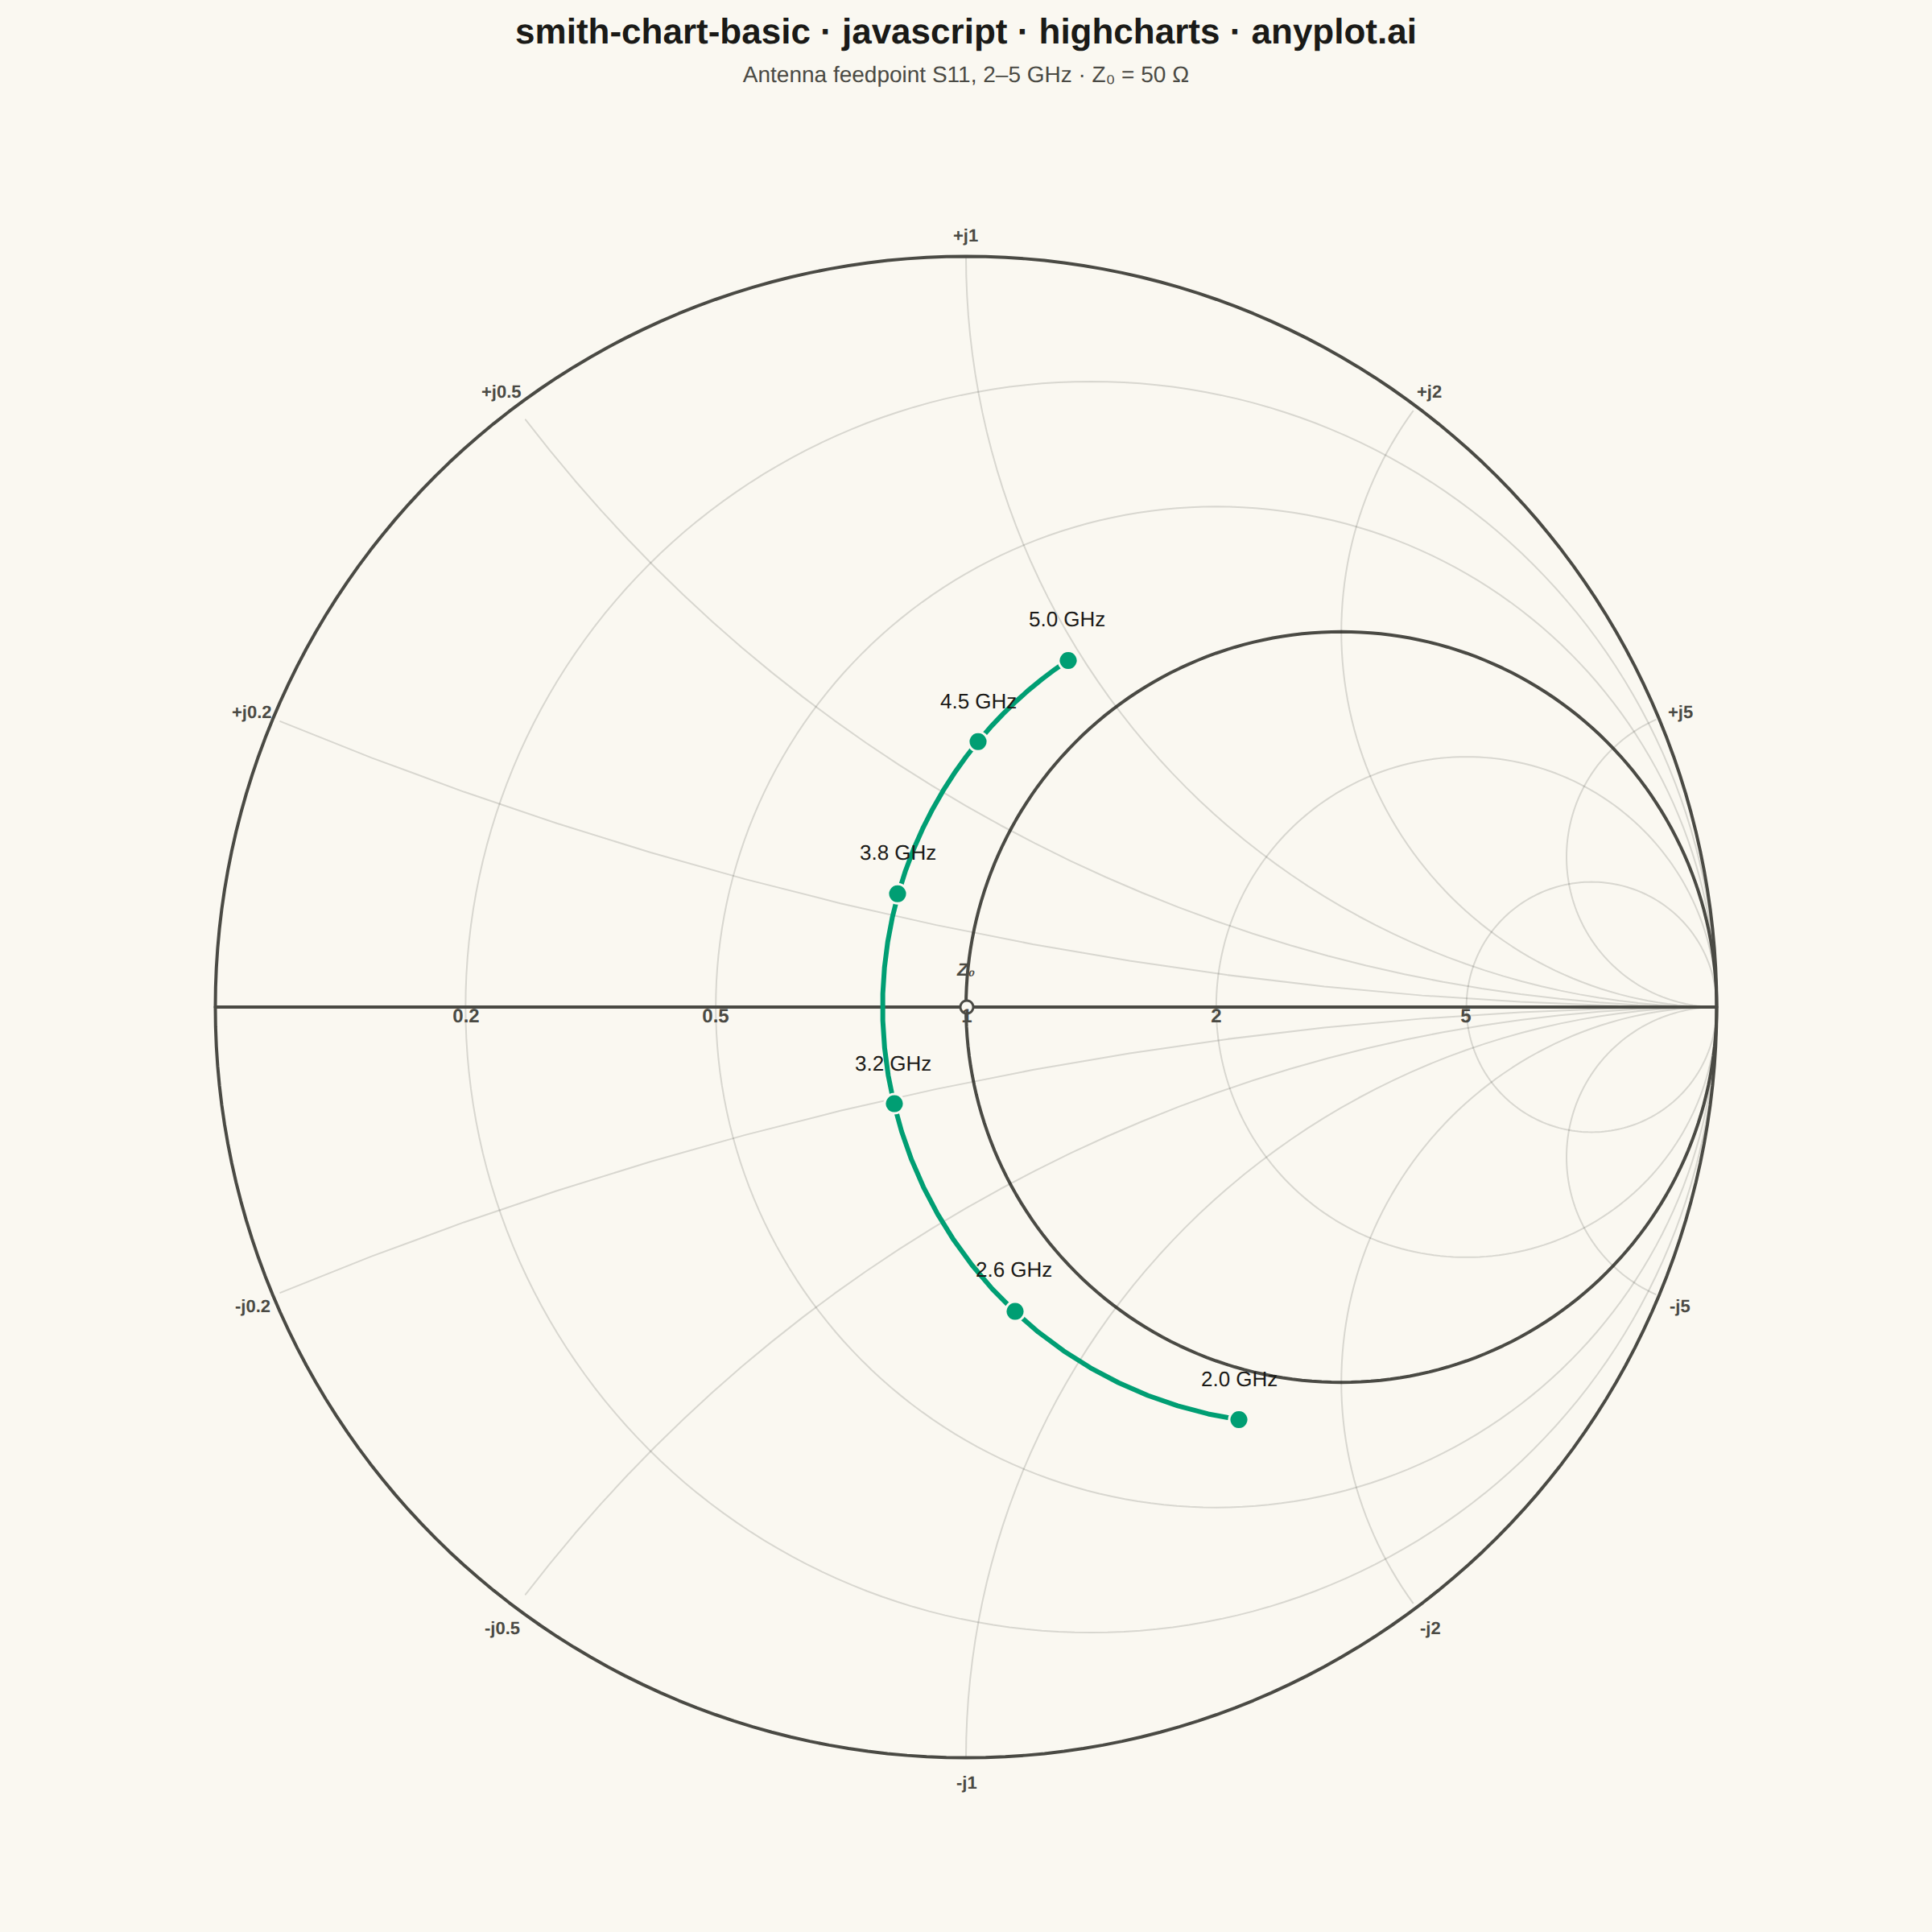
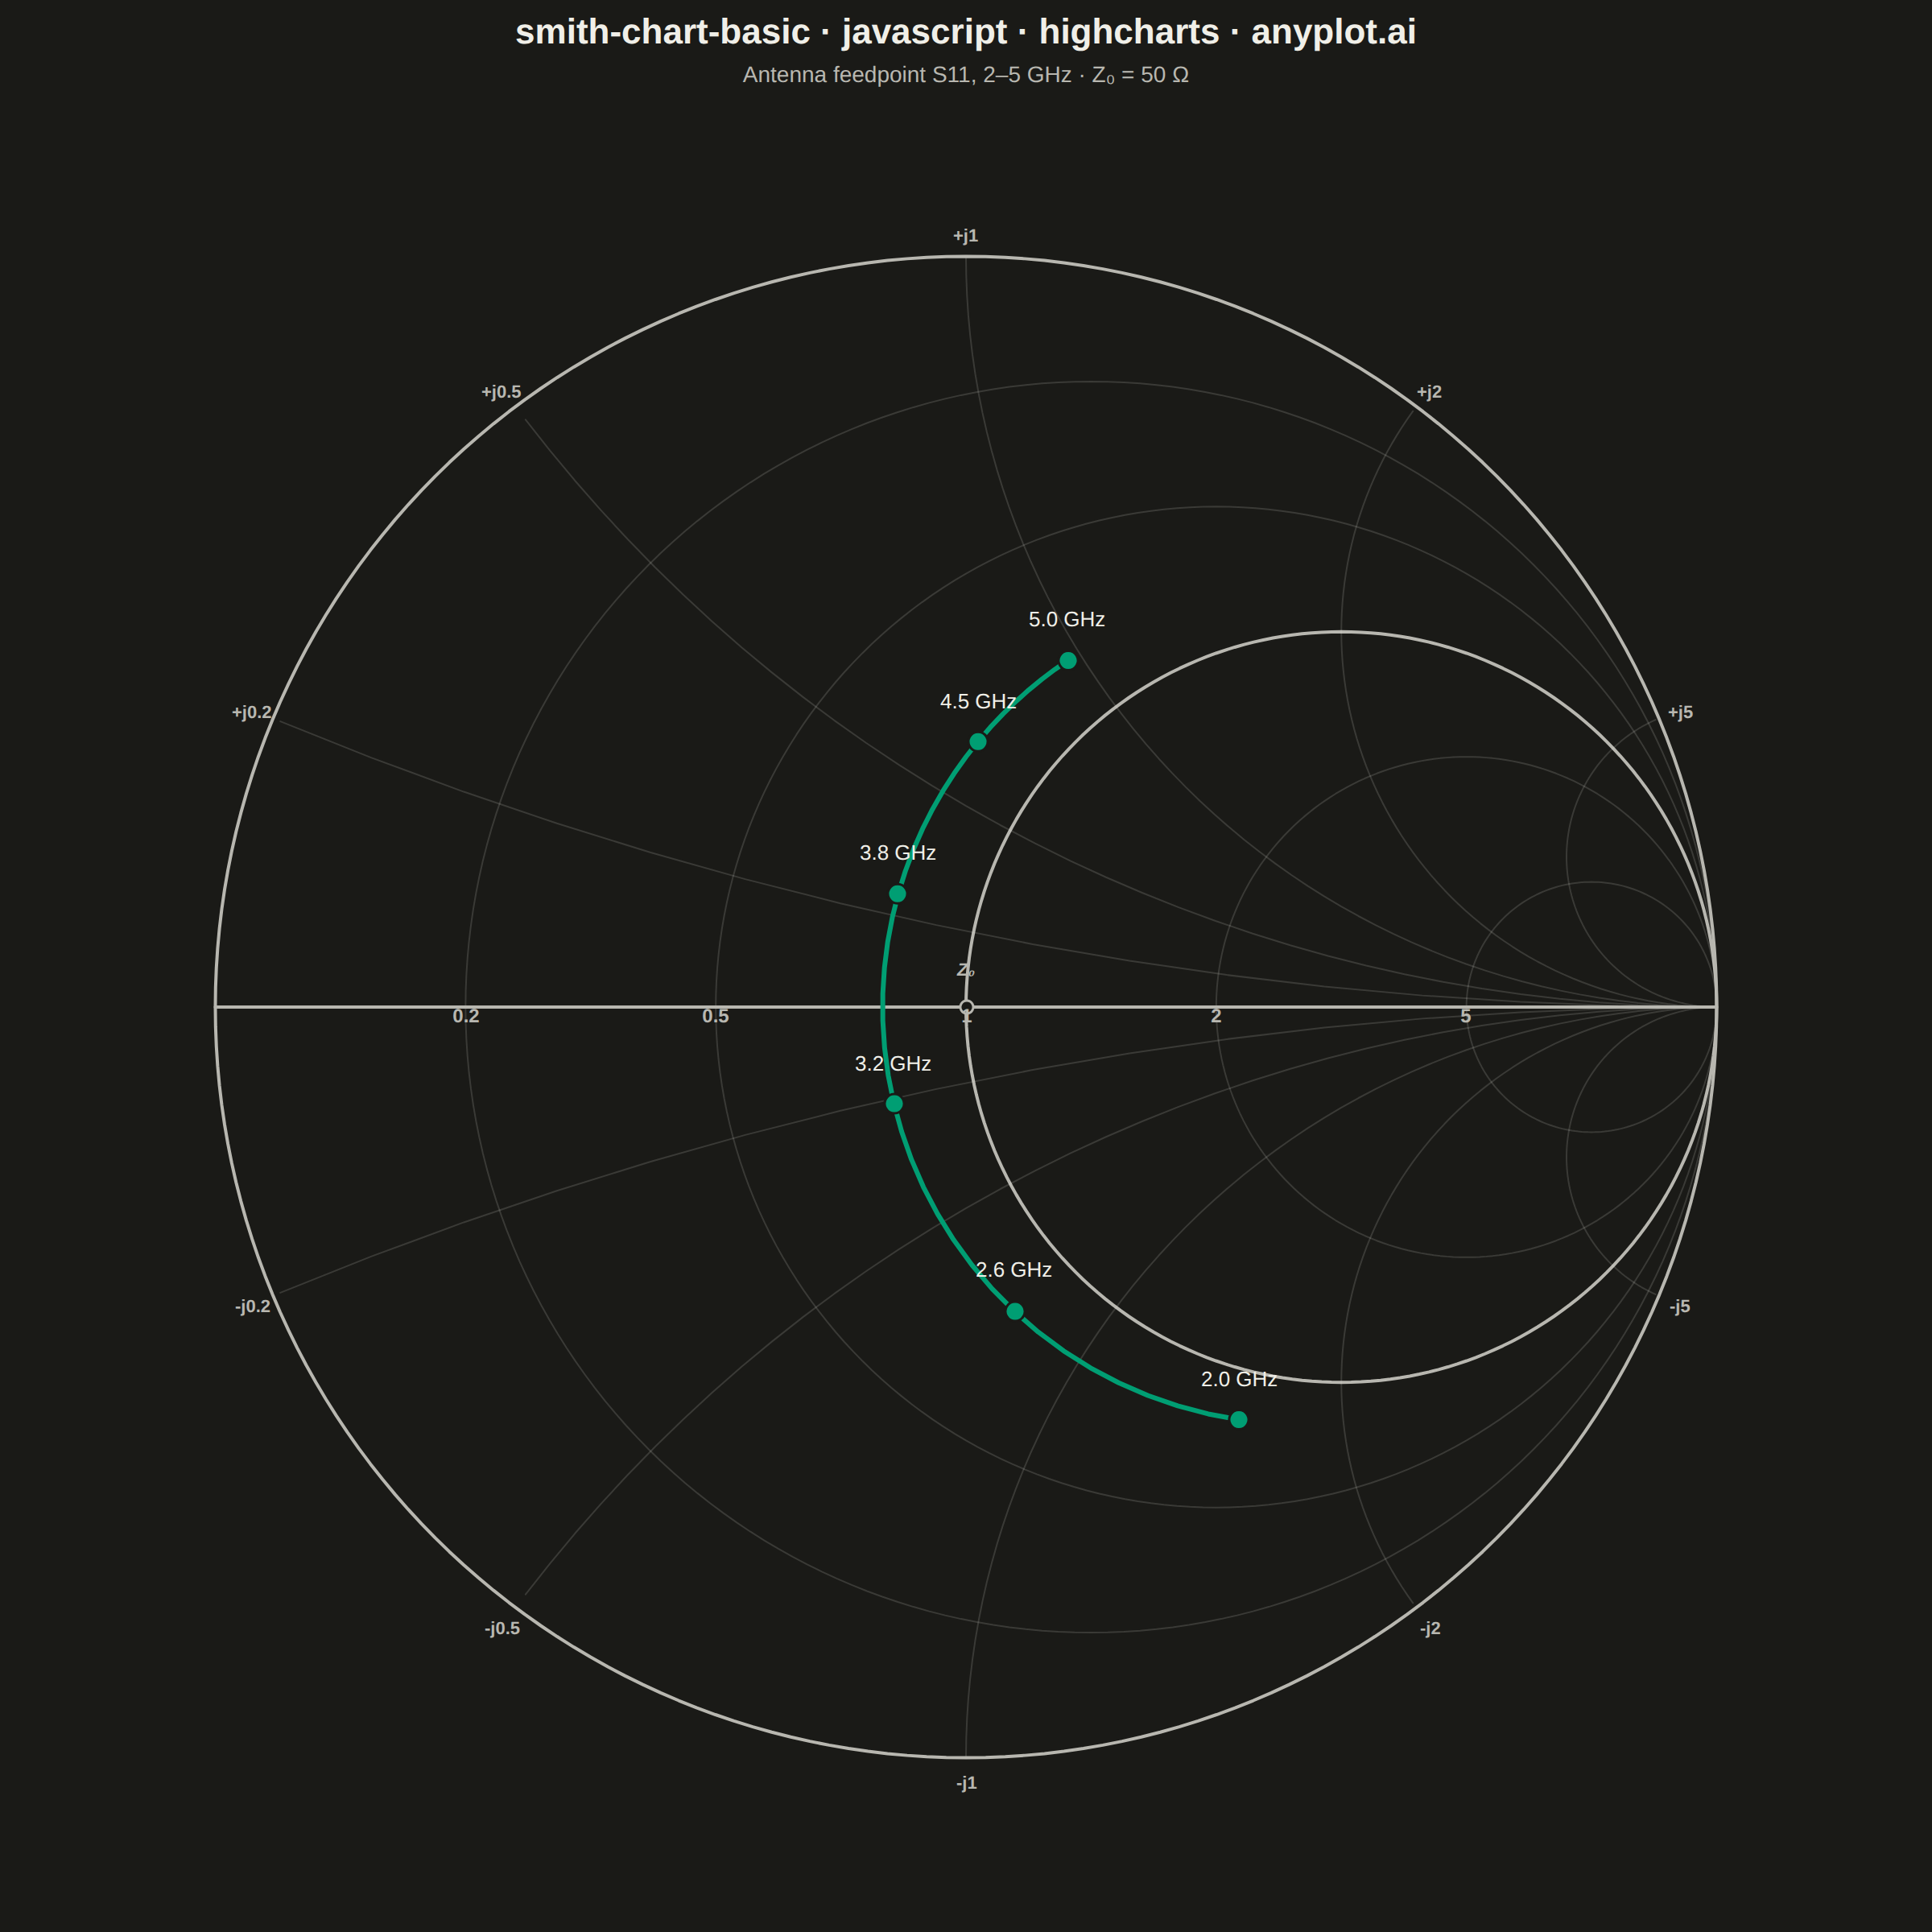
A Smith chart is a specialized circular diagram used in RF engineering to display complex impedance and reflection coefficients on a normalized polar grid. The chart features constant resistance circles (centered along the horizontal axis) and constant reactance arcs (curving from the right edge), enabling engineers to visualize impedance matching, transmission line behavior, and antenna characteristics. It reveals relationships between impedance, admittance, and reflection coefficient that would be difficult to interpret in Cartesian coordinates.
// anyplot.ai
// smith-chart-basic: Smith Chart for RF/Impedance
// Library: highcharts 12.6.0 | JavaScript 22.23.2
// Quality: 91/100 | Created: 2026-09-02
//# anyplot-orientation: square

const t = window.ANYPLOT_TOKENS;

// --- Smith chart grid geometry -----------------------------------------
// The grid lives entirely in the reflection-coefficient (Gamma) plane, where
// constant-resistance contours and constant-reactance contours are literal
// circles/arcs — no polar chart module needed, just Cartesian x/y series.
const ARC_STEPS = 240;
const RESISTANCE_VALUES = [0.2, 0.5, 1, 2, 5];
const REACTANCE_VALUES = [0.2, 0.5, 1, 2, 5];

const resistanceCircle = (r, steps) => {
  const cx = r / (1 + r);
  const radius = 1 / (1 + r);
  const points = [];
  for (let i = 0; i <= steps; i++) {
    const theta = (2 * Math.PI * i) / steps;
    points.push([cx + radius * Math.cos(theta), radius * Math.sin(theta)]);
  }
  return points;
};

// Reactance arcs pass through (1, 0) and only the portion inside |Gamma| <= 1
// is drawn — the circle's other side always sits outside the chart boundary.
const reactanceArc = (x, steps) => {
  const cx = 1;
  const cy = 1 / x;
  const radius = Math.abs(1 / x);
  const inside = [];
  for (let i = 0; i <= steps; i++) {
    const theta = (2 * Math.PI * i) / steps;
    const px = cx + radius * Math.cos(theta);
    const py = cy + radius * Math.sin(theta);
    if (px * px + py * py <= 1 + 1e-6) {
      inside.push({ theta, xy: [px, py] });
    }
  }
  inside.sort((a, b) => a.theta - b.theta);
  return inside.map((p) => p.xy);
};

const boundaryCircle = resistanceCircle(0, ARC_STEPS);
const realAxis = [
  [-1, 0],
  [1, 0],
];
const resistanceGrid = RESISTANCE_VALUES.map((r) => resistanceCircle(r, ARC_STEPS));
const reactanceGrid = REACTANCE_VALUES.flatMap((x) => [reactanceArc(x, ARC_STEPS), reactanceArc(-x, ARC_STEPS)]);
const resistanceAxisLabels = RESISTANCE_VALUES.map((r) => ({
  x: (r - 1) / (r + 1),
  y: 0,
  name: String(r),
}));

// Each constant-reactance arc leaves the boundary circle at the point where
// resistance = 0 (pure reactance, z = jx) — the conventional spot to label it.
const reactanceBoundaryPoint = (x) => {
  const denom = 1 + x * x;
  return { gammaReal: (x * x - 1) / denom, gammaImag: (2 * x) / denom };
};
const REACTANCE_LABEL_OFFSET_PX = 14;
const reactanceLabels = REACTANCE_VALUES.flatMap((x) =>
  [x, -x].map((signedX) => {
    const { gammaReal, gammaImag } = reactanceBoundaryPoint(signedX);
    const norm = Math.hypot(gammaReal, gammaImag) || 1;
    return {
      x: gammaReal,
      y: gammaImag,
      name: `${signedX > 0 ? "+" : "-"}j${Math.abs(signedX)}`,
      dataLabels: {
        // push the label radially outward past the boundary circle so it
        // never sits on top of the arc/boundary line it identifies
        x: (gammaReal / norm) * REACTANCE_LABEL_OFFSET_PX,
        y: -(gammaImag / norm) * REACTANCE_LABEL_OFFSET_PX,
      },
    };
  })
);

// --- Impedance locus: simplified series-RLC antenna feedpoint sweep -----
const z0 = 50;
const seriesResistanceOhm = 40;
const inductanceH = 3e-9;
const capacitanceF = 6.893e-13; // tuned so reactance crosses zero near 3.5 GHz
const freqStartHz = 2e9;
const freqEndHz = 5e9;
const freqPoints = 40;

const frequenciesHz = Array.from(
  { length: freqPoints },
  (_, i) => freqStartHz + ((freqEndHz - freqStartHz) * i) / (freqPoints - 1)
);

const locusData = frequenciesHz.map((f) => {
  const omega = 2 * Math.PI * f;
  const reactanceOhm = omega * inductanceH - 1 / (omega * capacitanceF);
  const zr = seriesResistanceOhm / z0;
  const zi = reactanceOhm / z0;
  const denom = (zr + 1) * (zr + 1) + zi * zi;
  const gammaReal = (zr * zr - 1 + zi * zi) / denom;
  const gammaImag = (2 * zi) / denom;
  return { x: gammaReal, y: gammaImag, freqGHz: f / 1e9 };
});

const labelIndices = [0, 8, 16, 24, 32, 39];
const labeledPoints = labelIndices.map((i) => ({
  x: locusData[i].x,
  y: locusData[i].y,
  name: `${locusData[i].freqGHz.toFixed(1)} GHz`,
}));

// --- Chart ---------------------------------------------------------------
Highcharts.chart("container", {
  chart: {
    type: "line",
    backgroundColor: "transparent",
    animation: false,
    style: { fontFamily: "inherit" },
    events: {
      // Keep resistance circles circular: force equal Gamma-units-per-pixel
      // on both axes regardless of how title/legend margins shape the plot area.
      load: function () {
        const chart = this;
        const xAxis = chart.xAxis[0];
        const yAxis = chart.yAxis[0];
        const xRange = xAxis.max - xAxis.min;
        const yRange = yAxis.max - yAxis.min;
        if (chart.plotWidth > chart.plotHeight) {
          const targetRange = yRange * (chart.plotWidth / chart.plotHeight);
          const mid = (xAxis.max + xAxis.min) / 2;
          xAxis.setExtremes(mid - targetRange / 2, mid + targetRange / 2, false);
        } else if (chart.plotHeight > chart.plotWidth) {
          const targetRange = xRange * (chart.plotHeight / chart.plotWidth);
          const mid = (yAxis.max + yAxis.min) / 2;
          yAxis.setExtremes(mid - targetRange / 2, mid + targetRange / 2, false);
        }
        chart.redraw();
      },
    },
  },
  credits: { enabled: false },
  legend: { enabled: false },
  title: {
    text: "smith-chart-basic · javascript · highcharts · anyplot.ai",
    style: { color: t.ink, fontSize: "22px", fontWeight: "600" },
  },
  subtitle: {
    text: `Antenna feedpoint S11, 2–5 GHz · Z₀ = ${z0} Ω`,
    style: { color: t.inkSoft, fontSize: "14px" },
  },
  xAxis: {
    min: -1.15,
    max: 1.15,
    lineWidth: 0,
    tickLength: 0,
    gridLineWidth: 0,
    labels: { enabled: false },
    title: { text: null },
  },
  yAxis: {
    min: -1.15,
    max: 1.15,
    lineWidth: 0,
    tickLength: 0,
    gridLineWidth: 0,
    labels: { enabled: false },
    title: { text: null },
  },
  plotOptions: {
    series: { animation: false, enableMouseTracking: false, showInLegend: false },
  },
  series: [
    // r=1 is the most diagnostically important resistance circle (matches Z0
    // on the real axis at both ends), so it renders heavier than the rest.
    ...resistanceGrid.map((data, i) => ({
      type: "line",
      data,
      color: RESISTANCE_VALUES[i] === 1 ? t.inkSoft : t.grid,
      lineWidth: RESISTANCE_VALUES[i] === 1 ? 2 : 1,
      marker: { enabled: false },
    })),
    ...reactanceGrid.map((data) => ({
      type: "line",
      data,
      color: t.grid,
      lineWidth: 1,
      marker: { enabled: false },
    })),
    {
      type: "line",
      data: realAxis,
      color: t.inkSoft,
      lineWidth: 2,
      marker: { enabled: false },
    },
    {
      type: "line",
      data: boundaryCircle,
      color: t.inkSoft,
      lineWidth: 2,
      marker: { enabled: false },
    },
    {
      type: "scatter",
      data: resistanceAxisLabels,
      color: t.inkSoft,
      marker: { enabled: false },
      dataLabels: {
        enabled: true,
        format: "{point.name}",
        align: "center",
        y: 16,
        style: { color: t.inkSoft, fontSize: "12px", textOutline: "none" },
      },
    },
    {
      type: "scatter",
      data: reactanceLabels,
      color: t.inkSoft,
      marker: { enabled: false },
      enableMouseTracking: false,
      dataLabels: {
        enabled: true,
        format: "{point.name}",
        align: "center",
        verticalAlign: "middle",
        style: { color: t.inkSoft, fontSize: "11px", textOutline: "none" },
      },
    },
    {
      // matched condition: Z = Z0, so Gamma = 0 at the chart's center — the
      // "1" resistance-circle label already occupies the space below this
      // point, so the Z0 label sits above it instead to avoid colliding
      type: "scatter",
      data: [{ x: 0, y: 0, name: "Z₀" }],
      color: t.inkSoft,
      enableMouseTracking: false,
      marker: { symbol: "circle", radius: 4, fillColor: t.pageBg, lineColor: t.inkSoft, lineWidth: 1.5 },
      dataLabels: {
        enabled: true,
        format: "{point.name}",
        align: "center",
        y: -14,
        style: { color: t.inkSoft, fontSize: "11px", fontStyle: "italic", textOutline: "none" },
      },
    },
    {
      type: "line",
      name: "S11 locus",
      data: locusData,
      color: t.palette[0],
      lineWidth: 3,
      marker: { enabled: false },
    },
    {
      type: "scatter",
      name: "Frequency",
      data: labeledPoints,
      color: t.palette[0],
      marker: { symbol: "circle", radius: 6, fillColor: t.palette[0], lineColor: t.pageBg, lineWidth: 1.5 },
      dataLabels: {
        enabled: true,
        format: "{point.name}",
        y: -14,
        style: { color: t.ink, fontSize: "13px", fontWeight: "500", textOutline: "none" },
      },
    },
  ],
});
Runnable source as JSON, for any HTTP client: https://api.anyplot.ai/specs/smith-chart-basic/highcharts/code. Any spec id and library id listed in llms-full.txt fit the same URL shape; every URL below is complete and callable.
{
  "spec_id": "smith-chart-basic",
  "language": "javascript",
  "library": "highcharts",
  "page": "https://anyplot.ai/smith-chart-basic/javascript/highcharts",
  "hub": "https://anyplot.ai/smith-chart-basic",
  "code_json": "https://api.anyplot.ai/specs/smith-chart-basic/highcharts/code",
  "spec_json": "https://api.anyplot.ai/specs/smith-chart-basic",
  "render_light_png": "https://storage.googleapis.com/anyplot-images/plots/smith-chart-basic/javascript/highcharts/plot-light.png",
  "render_dark_png": "https://storage.googleapis.com/anyplot-images/plots/smith-chart-basic/javascript/highcharts/plot-dark.png",
  "interactive_light_html": "https://storage.googleapis.com/anyplot-images/plots/smith-chart-basic/javascript/highcharts/plot-light.html",
  "interactive_dark_html": "https://storage.googleapis.com/anyplot-images/plots/smith-chart-basic/javascript/highcharts/plot-dark.html",
  "quality_score": 91.0,
  "license": "MIT",
  "guide": "https://anyplot.ai/llms.txt"
}
Part of Smith Chart for RF/Impedance on anyplot.ai.