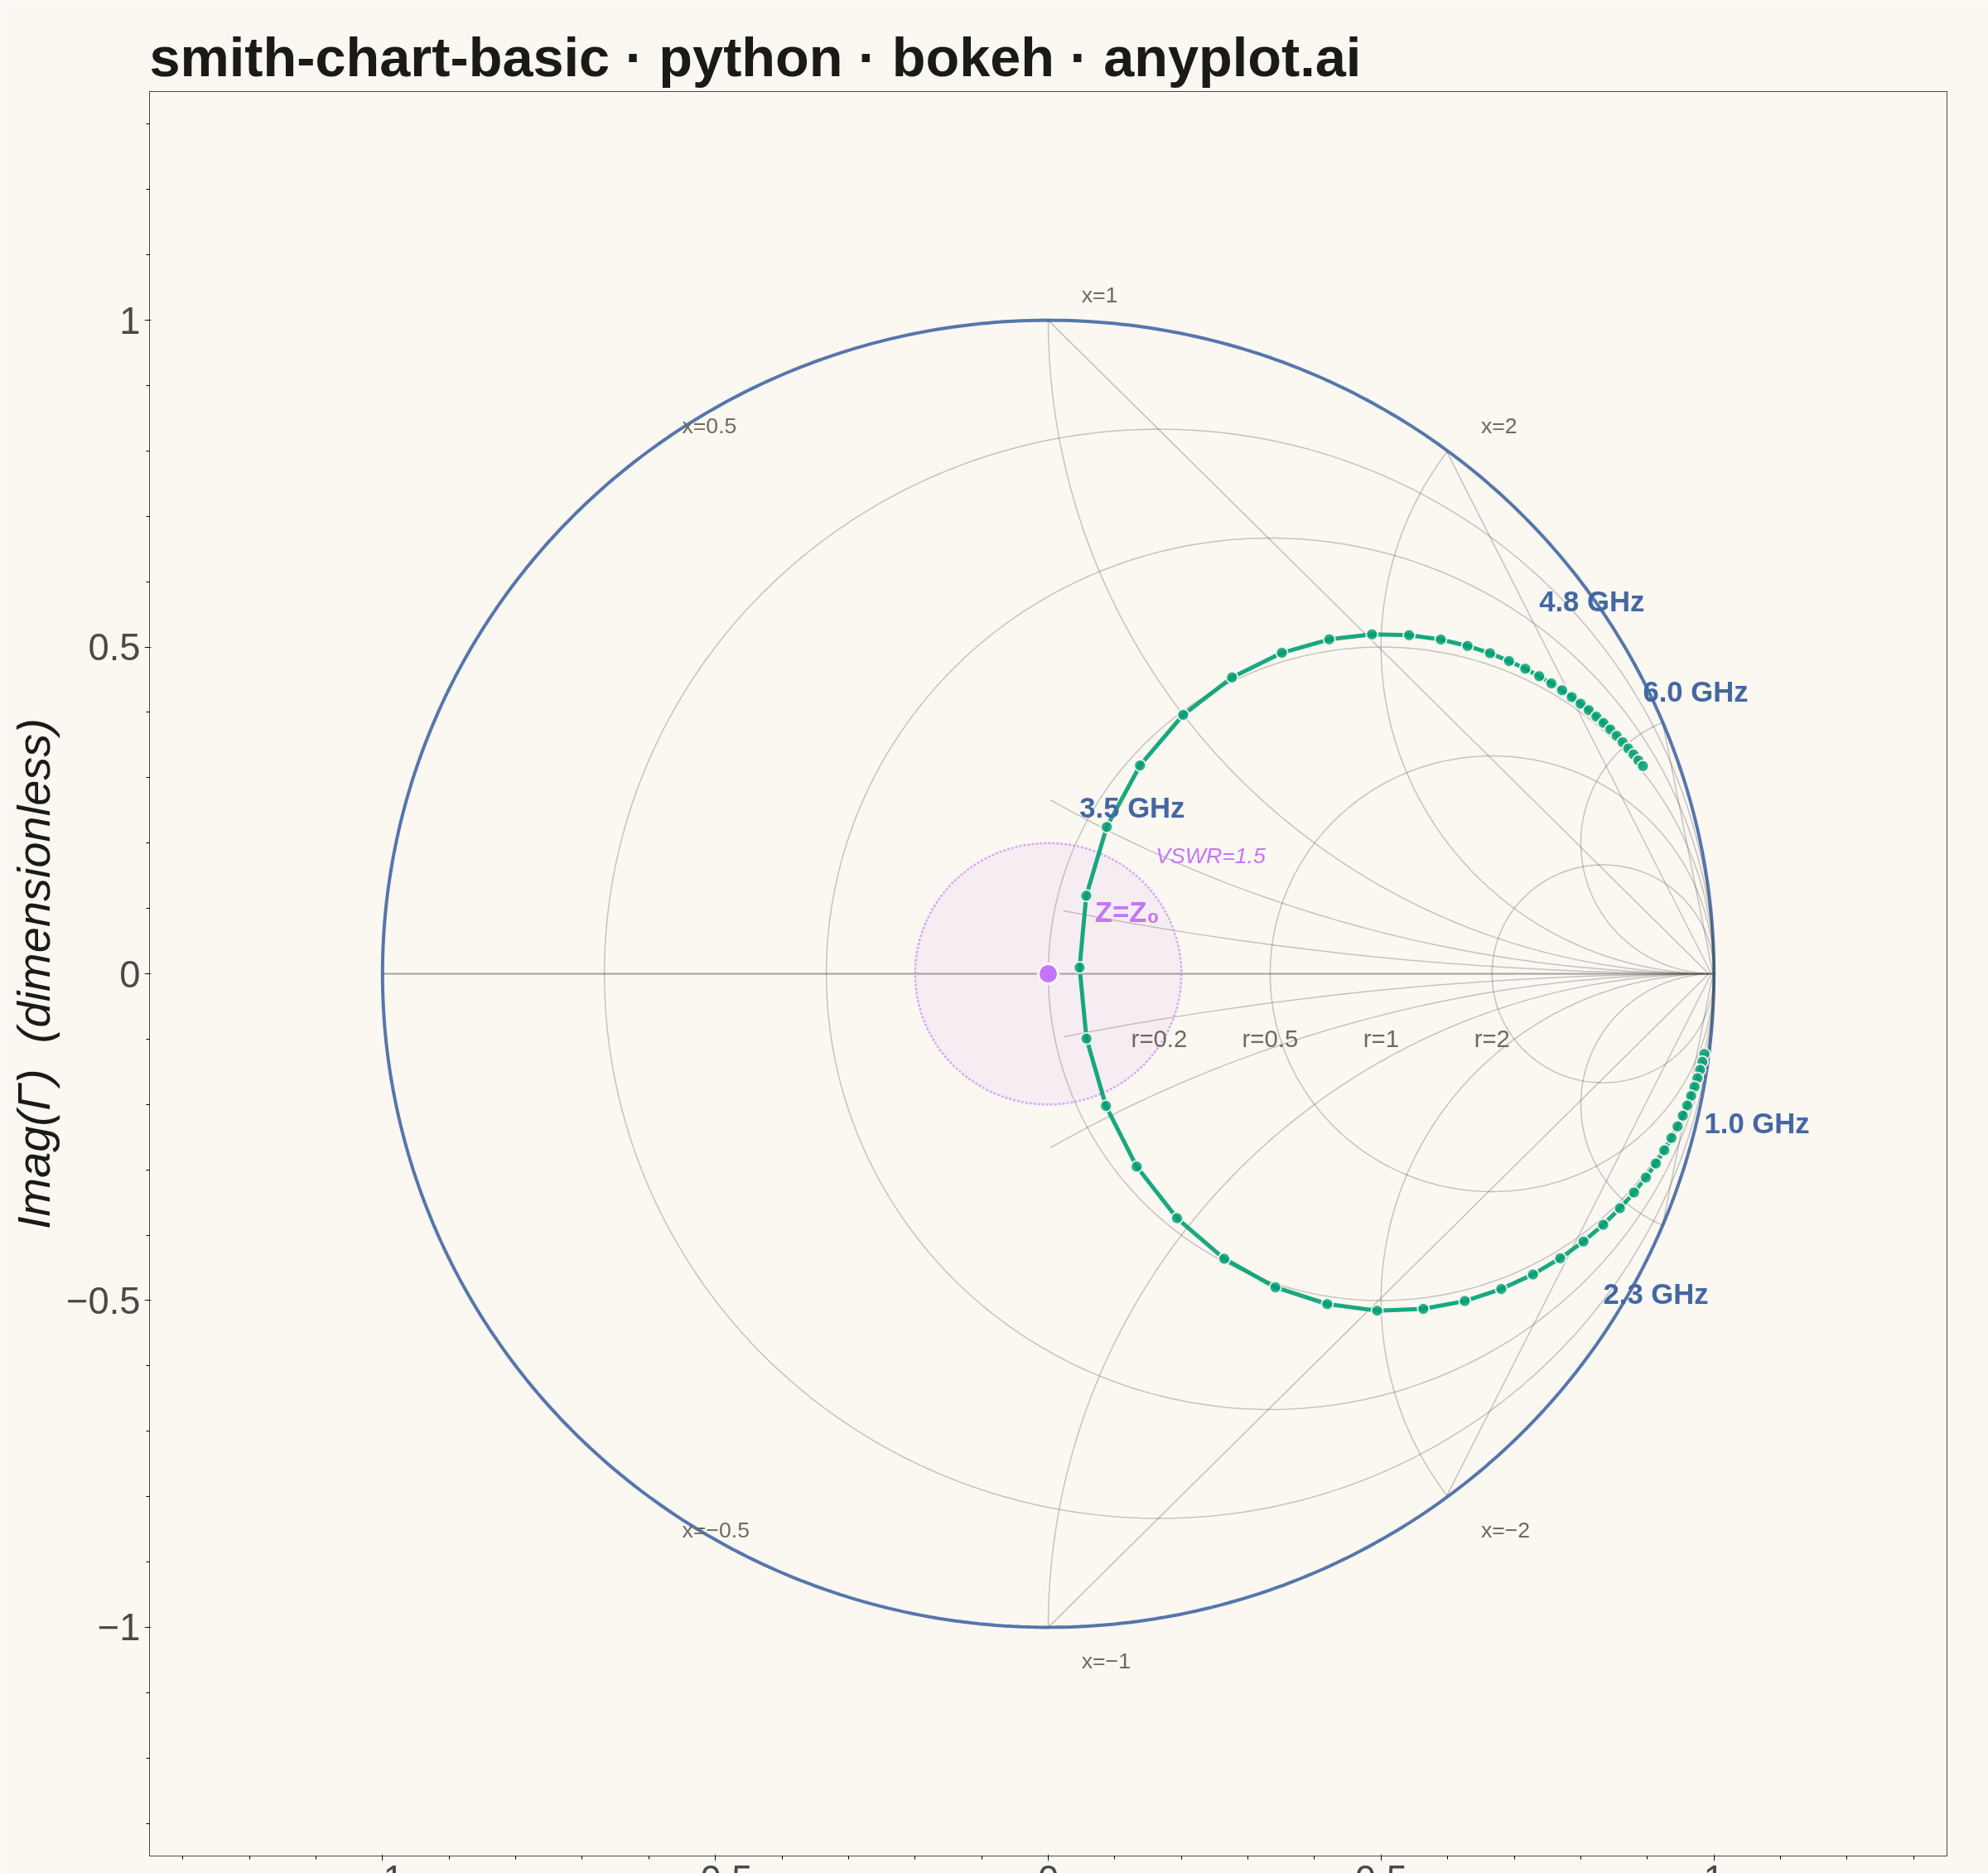
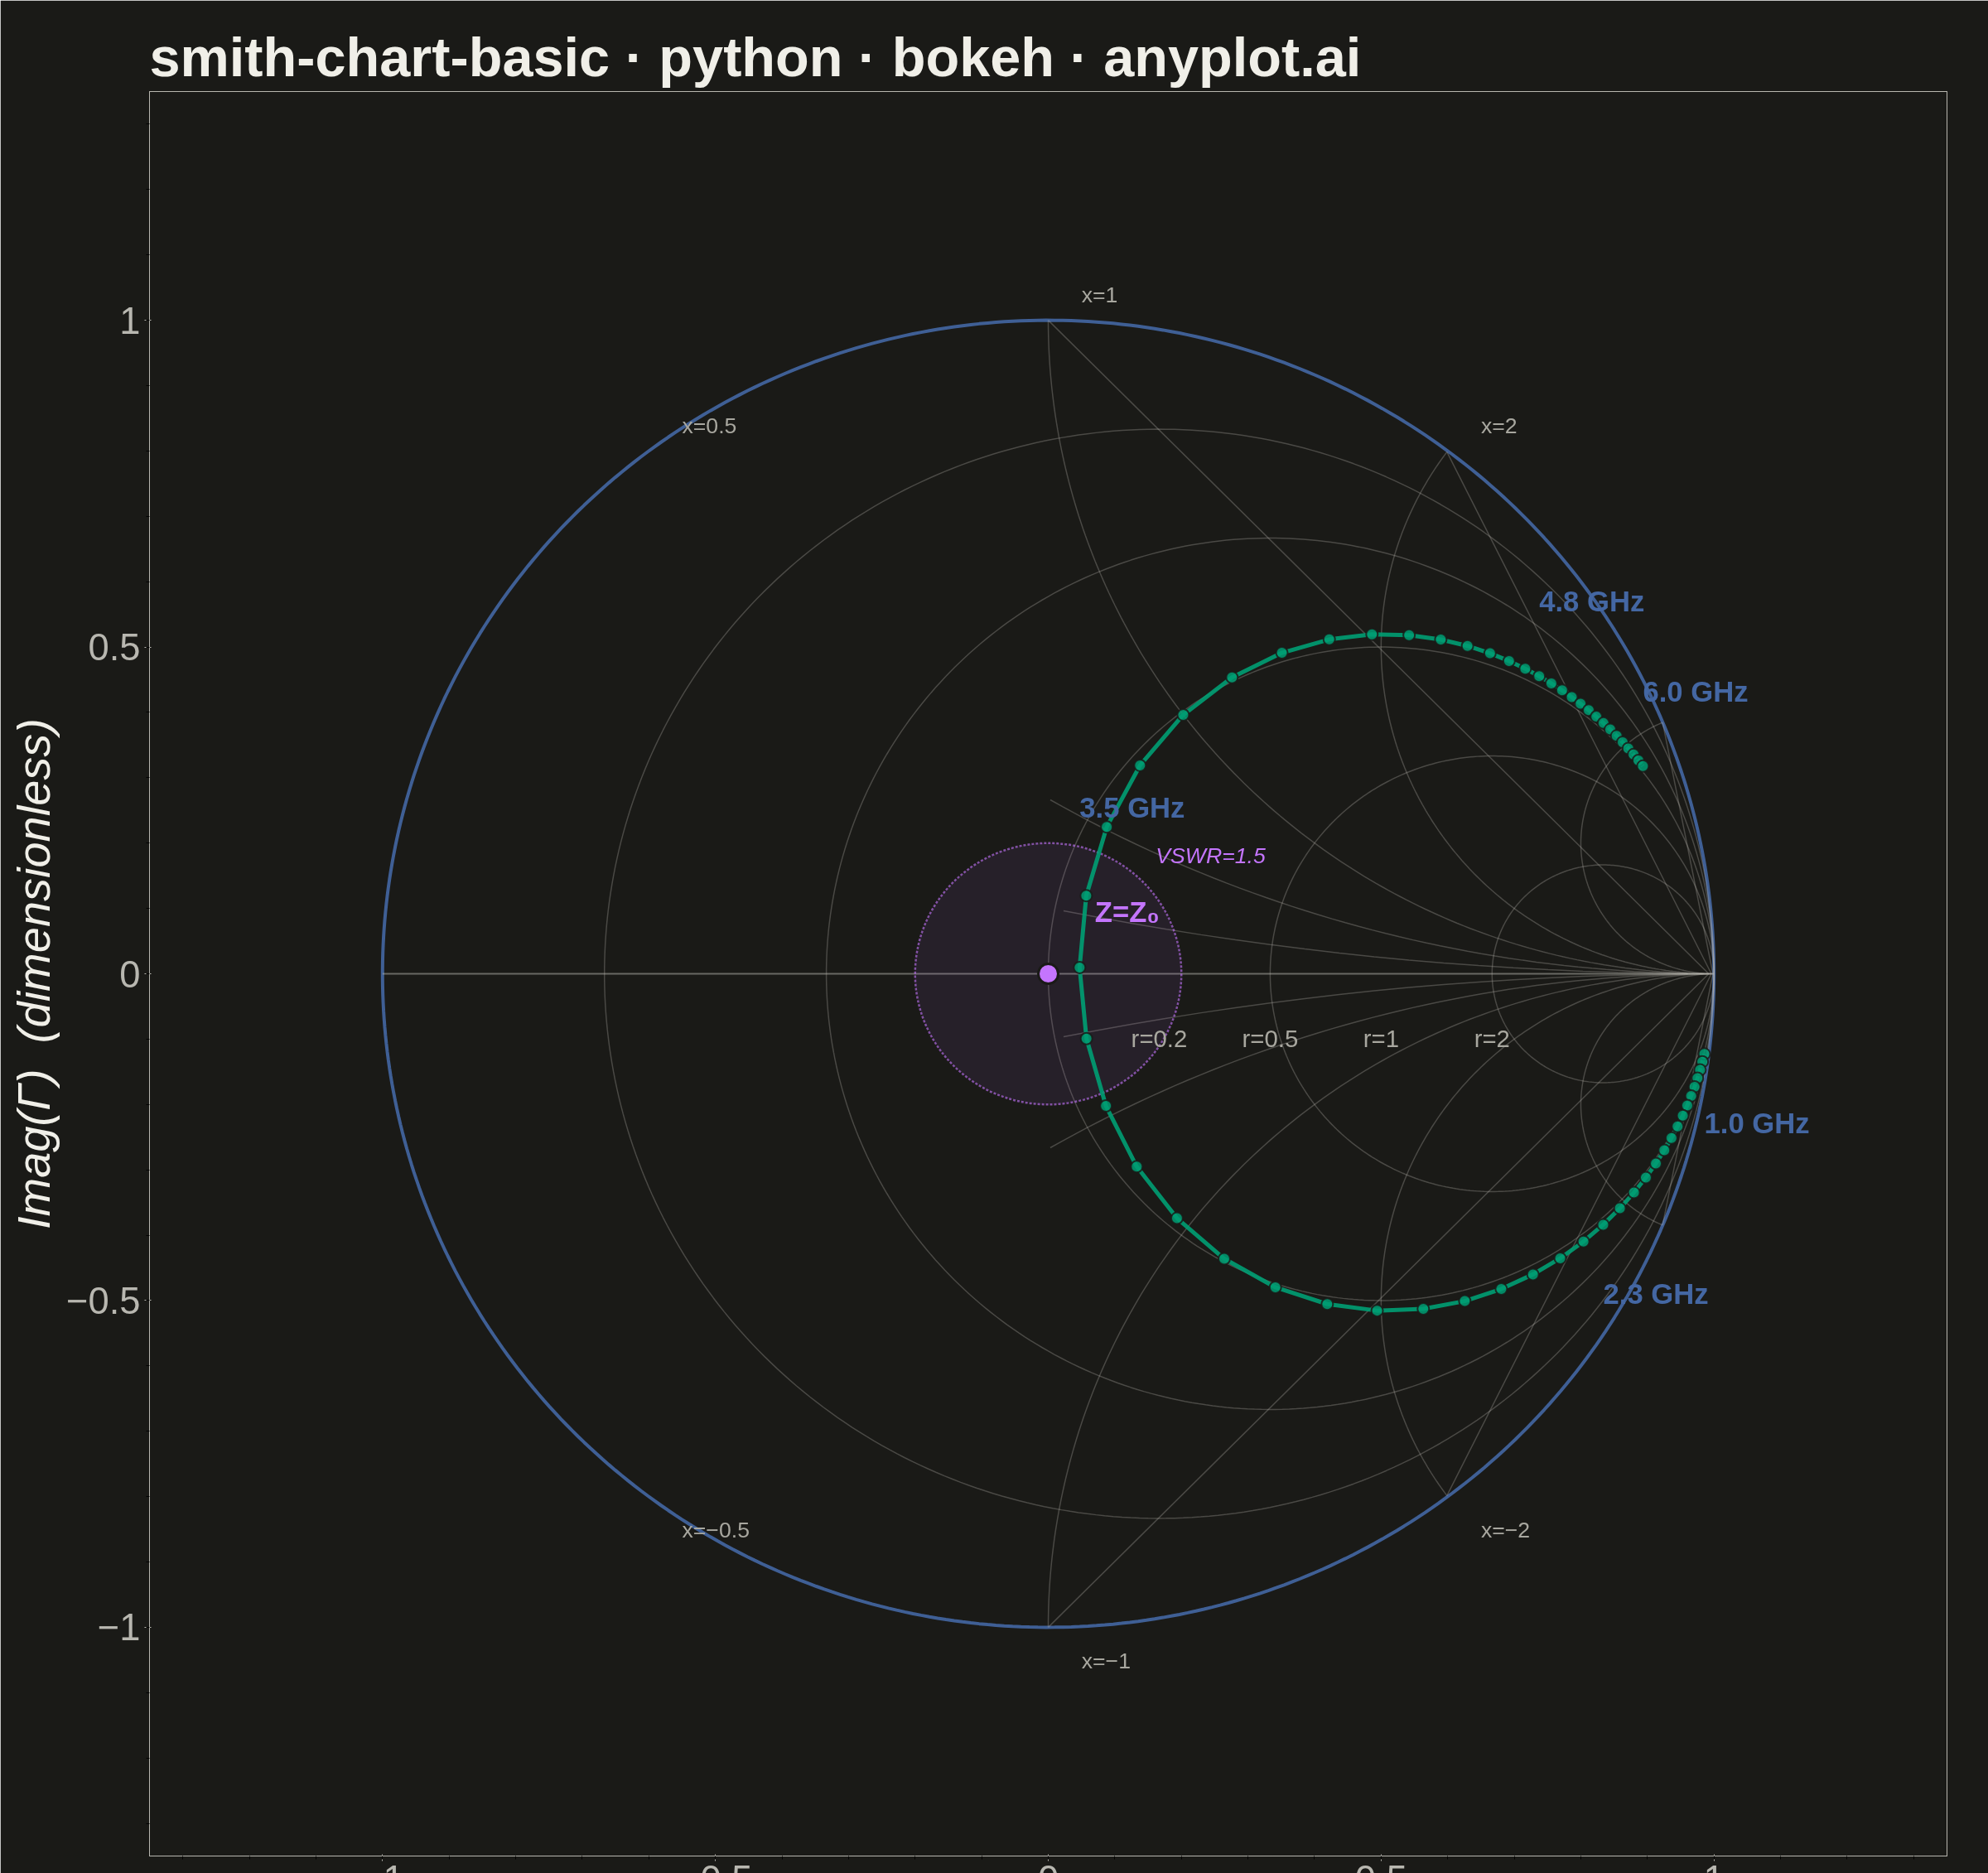
A Smith chart is a specialized circular diagram used in RF engineering to display complex impedance and reflection coefficients on a normalized polar grid. The chart features constant resistance circles (centered along the horizontal axis) and constant reactance arcs (curving from the right edge), enabling engineers to visualize impedance matching, transmission line behavior, and antenna characteristics. It reveals relationships between impedance, admittance, and reflection coefficient that would be difficult to interpret in Cartesian coordinates.
""" anyplot.ai
smith-chart-basic: Smith Chart for RF/Impedance
Library: bokeh 3.9.0 | Python 3.13.13
Quality: 91/100 | Updated: 2026-05-20
"""

import sys
from pathlib import Path


_script_dir = str(Path(__file__).parent.absolute())
sys.path = [p for p in sys.path if p != _script_dir and p != ""]

import os
import time

import numpy as np
from bokeh.io import output_file, save
from bokeh.models import ColumnDataSource, HoverTool, Label
from bokeh.plotting import figure
from selenium import webdriver
from selenium.webdriver.chrome.options import Options


# Theme tokens
THEME = os.getenv("ANYPLOT_THEME", "light")
PAGE_BG = "#FAF8F1" if THEME == "light" else "#1A1A17"
INK = "#1A1A17" if THEME == "light" else "#F0EFE8"
INK_SOFT = "#4A4A44" if THEME == "light" else "#B8B7B0"
INK_MUTED = "#6B6A63" if THEME == "light" else "#A8A79F"

# Okabe-Ito data colors (theme-independent)
LOCUS_COLOR = "#009E73"  # position 1 — brand green, impedance locus
BOUNDARY_COLOR = "#4467A3"  # position 3 — blue, unit circle boundary
MARKER_COLOR = "#C475FD"  # position 2 — vermillion, matched condition

# Reference impedance
Z0 = 50  # ohms

# Canvas: 2400×2400 (square — symmetric Smith chart)
W, H = 2400, 2400

# Plot
p = figure(
    width=W,
    height=H,
    title="smith-chart-basic · python · bokeh · anyplot.ai",
    x_axis_label="Real(Γ)  (dimensionless)",
    y_axis_label="Imag(Γ)  (dimensionless)",
    x_range=(-1.35, 1.35),
    y_range=(-1.35, 1.35),
    match_aspect=True,
    toolbar_location=None,
    min_border_bottom=160,
    min_border_left=180,
    min_border_top=110,
    min_border_right=50,
)

# Font sizes (bokeh CSS pt; 1pt ≈ 1.333 source-px)
p.title.text_font_size = "50pt"
p.xaxis.axis_label_text_font_size = "42pt"
p.yaxis.axis_label_text_font_size = "42pt"
p.xaxis.major_label_text_font_size = "34pt"
p.yaxis.major_label_text_font_size = "34pt"

# Theme-adaptive chrome
p.background_fill_color = PAGE_BG
p.border_fill_color = PAGE_BG
p.outline_line_color = INK_SOFT
p.title.text_color = INK
p.xaxis.axis_label_text_color = INK
p.yaxis.axis_label_text_color = INK
p.xaxis.major_label_text_color = INK_SOFT
p.yaxis.major_label_text_color = INK_SOFT
p.xaxis.axis_line_color = INK_SOFT
p.yaxis.axis_line_color = INK_SOFT
p.xaxis.major_tick_line_color = INK_SOFT
p.yaxis.major_tick_line_color = INK_SOFT
p.grid.visible = False

# Unit circle — outer boundary |Γ| = 1
theta = np.linspace(0, 2 * np.pi, 500)
p.line(np.cos(theta), np.sin(theta), line_width=4, line_color=BOUNDARY_COLOR, alpha=0.9)

# Constant resistance circles: r = 0.2, 0.5, 1, 2, 5
for r in [0.2, 0.5, 1, 2, 5]:
    center = r / (1 + r)
    radius = 1 / (1 + r)
    th = np.linspace(0, 2 * np.pi, 400)
    cx = center + radius * np.cos(th)
    cy = radius * np.sin(th)
    mask = cx**2 + cy**2 <= 1.001
    if mask.sum() > 0:
        p.line(cx[mask], cy[mask], line_width=1.5, line_color=INK_SOFT, alpha=0.30)

# Constant reactance arcs: x = ±0.2, ±0.5, ±1, ±2, ±5
for x in [0.2, 0.5, 1, 2, 5]:
    for sign in [1, -1]:
        cy_center = sign / x
        radius = 1.0 / x
        th = np.linspace(-np.pi, np.pi, 600)
        ax = 1.0 + radius * np.cos(th)
        ay = cy_center + radius * np.sin(th)
        mask = (ax**2 + ay**2 <= 1.001) & (ax >= -0.001)
        ax_m, ay_m = ax[mask], ay[mask]
        if len(ax_m) > 1:
            order = np.argsort(np.arctan2(ay_m - cy_center, ax_m - 1.0))
            p.line(ax_m[order], ay_m[order], line_width=1.5, line_color=INK_SOFT, alpha=0.30)

# Real axis (pure resistance line, x = 0)
p.line([-1, 1], [0, 0], line_width=2, line_color=INK_SOFT, alpha=0.5)

# VSWR=1.5 reference zone — well-matched region (|gamma| = 0.2)
vswr_r = (1.5 - 1) / (1.5 + 1)  # = 0.2
p.ellipse(
    x=0,
    y=0,
    width=2 * vswr_r,
    height=2 * vswr_r,
    fill_color=MARKER_COLOR,
    fill_alpha=0.08,
    line_color=MARKER_COLOR,
    line_dash="dashed",
    line_width=2.5,
    line_alpha=0.60,
)

# Data: antenna S11 sweep 1–6 GHz (series RLC resonance at 3.5 GHz, Q=5)
np.random.seed(42)
n_points = 60
freq = np.linspace(1e9, 6e9, n_points)
f_res = 3.5e9
Q = 5
R = 45 + 10 * np.exp(-((freq - f_res) ** 2) / (0.5e9) ** 2)
X = Z0 * Q * (freq / f_res - f_res / freq) + 5 * np.sin(2 * np.pi * freq / 2e9)

z_norm = (R + 1j * X) / Z0
gamma = (z_norm - 1) / (z_norm + 1)
gamma_real = np.real(gamma)
gamma_imag = np.imag(gamma)

source = ColumnDataSource(data={"gr": gamma_real, "gi": gamma_imag, "freq": freq / 1e9, "R": R, "X": X})

# HoverTool — active in the interactive HTML version
hover = HoverTool(
    tooltips=[
        ("Frequency", "@freq{0.2f} GHz"),
        ("R", "@R{0.1f} Ω"),
        ("X", "@X{+0.1f} Ω"),
        ("Γ", "(@gr{0.3f}, @gi{+0.3f}j)"),
    ]
)
p.add_tools(hover)

# Impedance locus
p.line("gr", "gi", source=source, line_width=5, line_color=LOCUS_COLOR, alpha=0.9)
p.scatter("gr", "gi", source=source, size=14, fill_color=LOCUS_COLOR, line_color=PAGE_BG, line_width=2, alpha=0.85)

# Frequency labels at key points along the locus
label_indices = [0, n_points // 4, n_points // 2, 3 * n_points // 4, n_points - 1]
for idx in label_indices:
    gx, gy = gamma_real[idx], gamma_imag[idx]
    # push near-center labels clear of the Z=Z0 marker at (0.07, 0.07)
    if abs(gx) < 0.2 and abs(gy) < 0.2:
        lx, ly = gx, gy + 0.22
    else:
        lx = gx
        ly = gy + (0.09 if gy >= 0 else -0.13)
    p.add_layout(
        Label(
            x=lx,
            y=ly,
            text=f"{freq[idx] / 1e9:.1f} GHz",
            text_font_size="26pt",
            text_color=BOUNDARY_COLOR,
            text_font_style="bold",
        )
    )

# Matched condition marker — Γ = 0 (Z = Z₀)
p.scatter([0], [0], size=24, fill_color=MARKER_COLOR, line_color=PAGE_BG, line_width=3)
p.add_layout(Label(x=0.07, y=0.07, text="Z=Z₀", text_font_size="26pt", text_color=MARKER_COLOR, text_font_style="bold"))

# VSWR=1.5 annotation on the reference circle
p.add_layout(
    Label(
        x=vswr_r * np.cos(np.pi / 4) + 0.02,
        y=vswr_r * np.sin(np.pi / 4) + 0.02,
        text="VSWR=1.5",
        text_font_size="20pt",
        text_color=MARKER_COLOR,
        text_font_style="italic",
    )
)

# Grid r-value labels along real axis (enlarged from previous)
for r in [0.2, 0.5, 1, 2]:
    p.add_layout(
        Label(x=r / (1 + r), y=-0.12, text=f"r={r}", text_font_size="22pt", text_color=INK_MUTED, text_align="center")
    )

# Reactance labels at chart boundary (enlarged from previous)
for x in [0.5, 1, 2]:
    angle = 2 * np.arctan(1 / x)
    lx, ly = np.cos(angle), np.sin(angle)
    p.add_layout(Label(x=lx + 0.05, y=ly + 0.02, text=f"x={x}", text_font_size="20pt", text_color=INK_MUTED))
    p.add_layout(Label(x=lx + 0.05, y=-ly - 0.07, text=f"x=−{x}", text_font_size="20pt", text_color=INK_MUTED))

# Save interactive HTML
output_file(f"plot-{THEME}.html", title="Smith Chart – python – bokeh – anyplot.ai")
save(p)

# Screenshot with headless Chrome (Selenium — export_png unavailable in this env)
opts = Options()
for arg in (
    "--headless=new",
    "--no-sandbox",
    "--disable-dev-shm-usage",
    "--disable-gpu",
    f"--window-size={W},{H}",
    "--hide-scrollbars",
):
    opts.add_argument(arg)
driver = webdriver.Chrome(options=opts)
driver.set_window_size(W, H)
driver.get(f"file://{Path(f'plot-{THEME}.html').resolve()}")
time.sleep(3)
driver.save_screenshot(f"plot-{THEME}.png")
driver.quit()
Runnable source as JSON, for any HTTP client: https://api.anyplot.ai/specs/smith-chart-basic/bokeh/code. Any spec id and library id listed in llms-full.txt fit the same URL shape; every URL below is complete and callable.
{
  "spec_id": "smith-chart-basic",
  "language": "python",
  "library": "bokeh",
  "page": "https://anyplot.ai/smith-chart-basic/python/bokeh",
  "hub": "https://anyplot.ai/smith-chart-basic",
  "code_json": "https://api.anyplot.ai/specs/smith-chart-basic/bokeh/code",
  "spec_json": "https://api.anyplot.ai/specs/smith-chart-basic",
  "render_light_png": "https://storage.googleapis.com/anyplot-images/plots/smith-chart-basic/python/bokeh/plot-light.png",
  "render_dark_png": "https://storage.googleapis.com/anyplot-images/plots/smith-chart-basic/python/bokeh/plot-dark.png",
  "interactive_light_html": "https://storage.googleapis.com/anyplot-images/plots/smith-chart-basic/python/bokeh/plot-light.html",
  "interactive_dark_html": "https://storage.googleapis.com/anyplot-images/plots/smith-chart-basic/python/bokeh/plot-dark.html",
  "quality_score": 91.0,
  "license": "MIT",
  "guide": "https://anyplot.ai/llms.txt"
}
Part of Smith Chart for RF/Impedance on anyplot.ai.