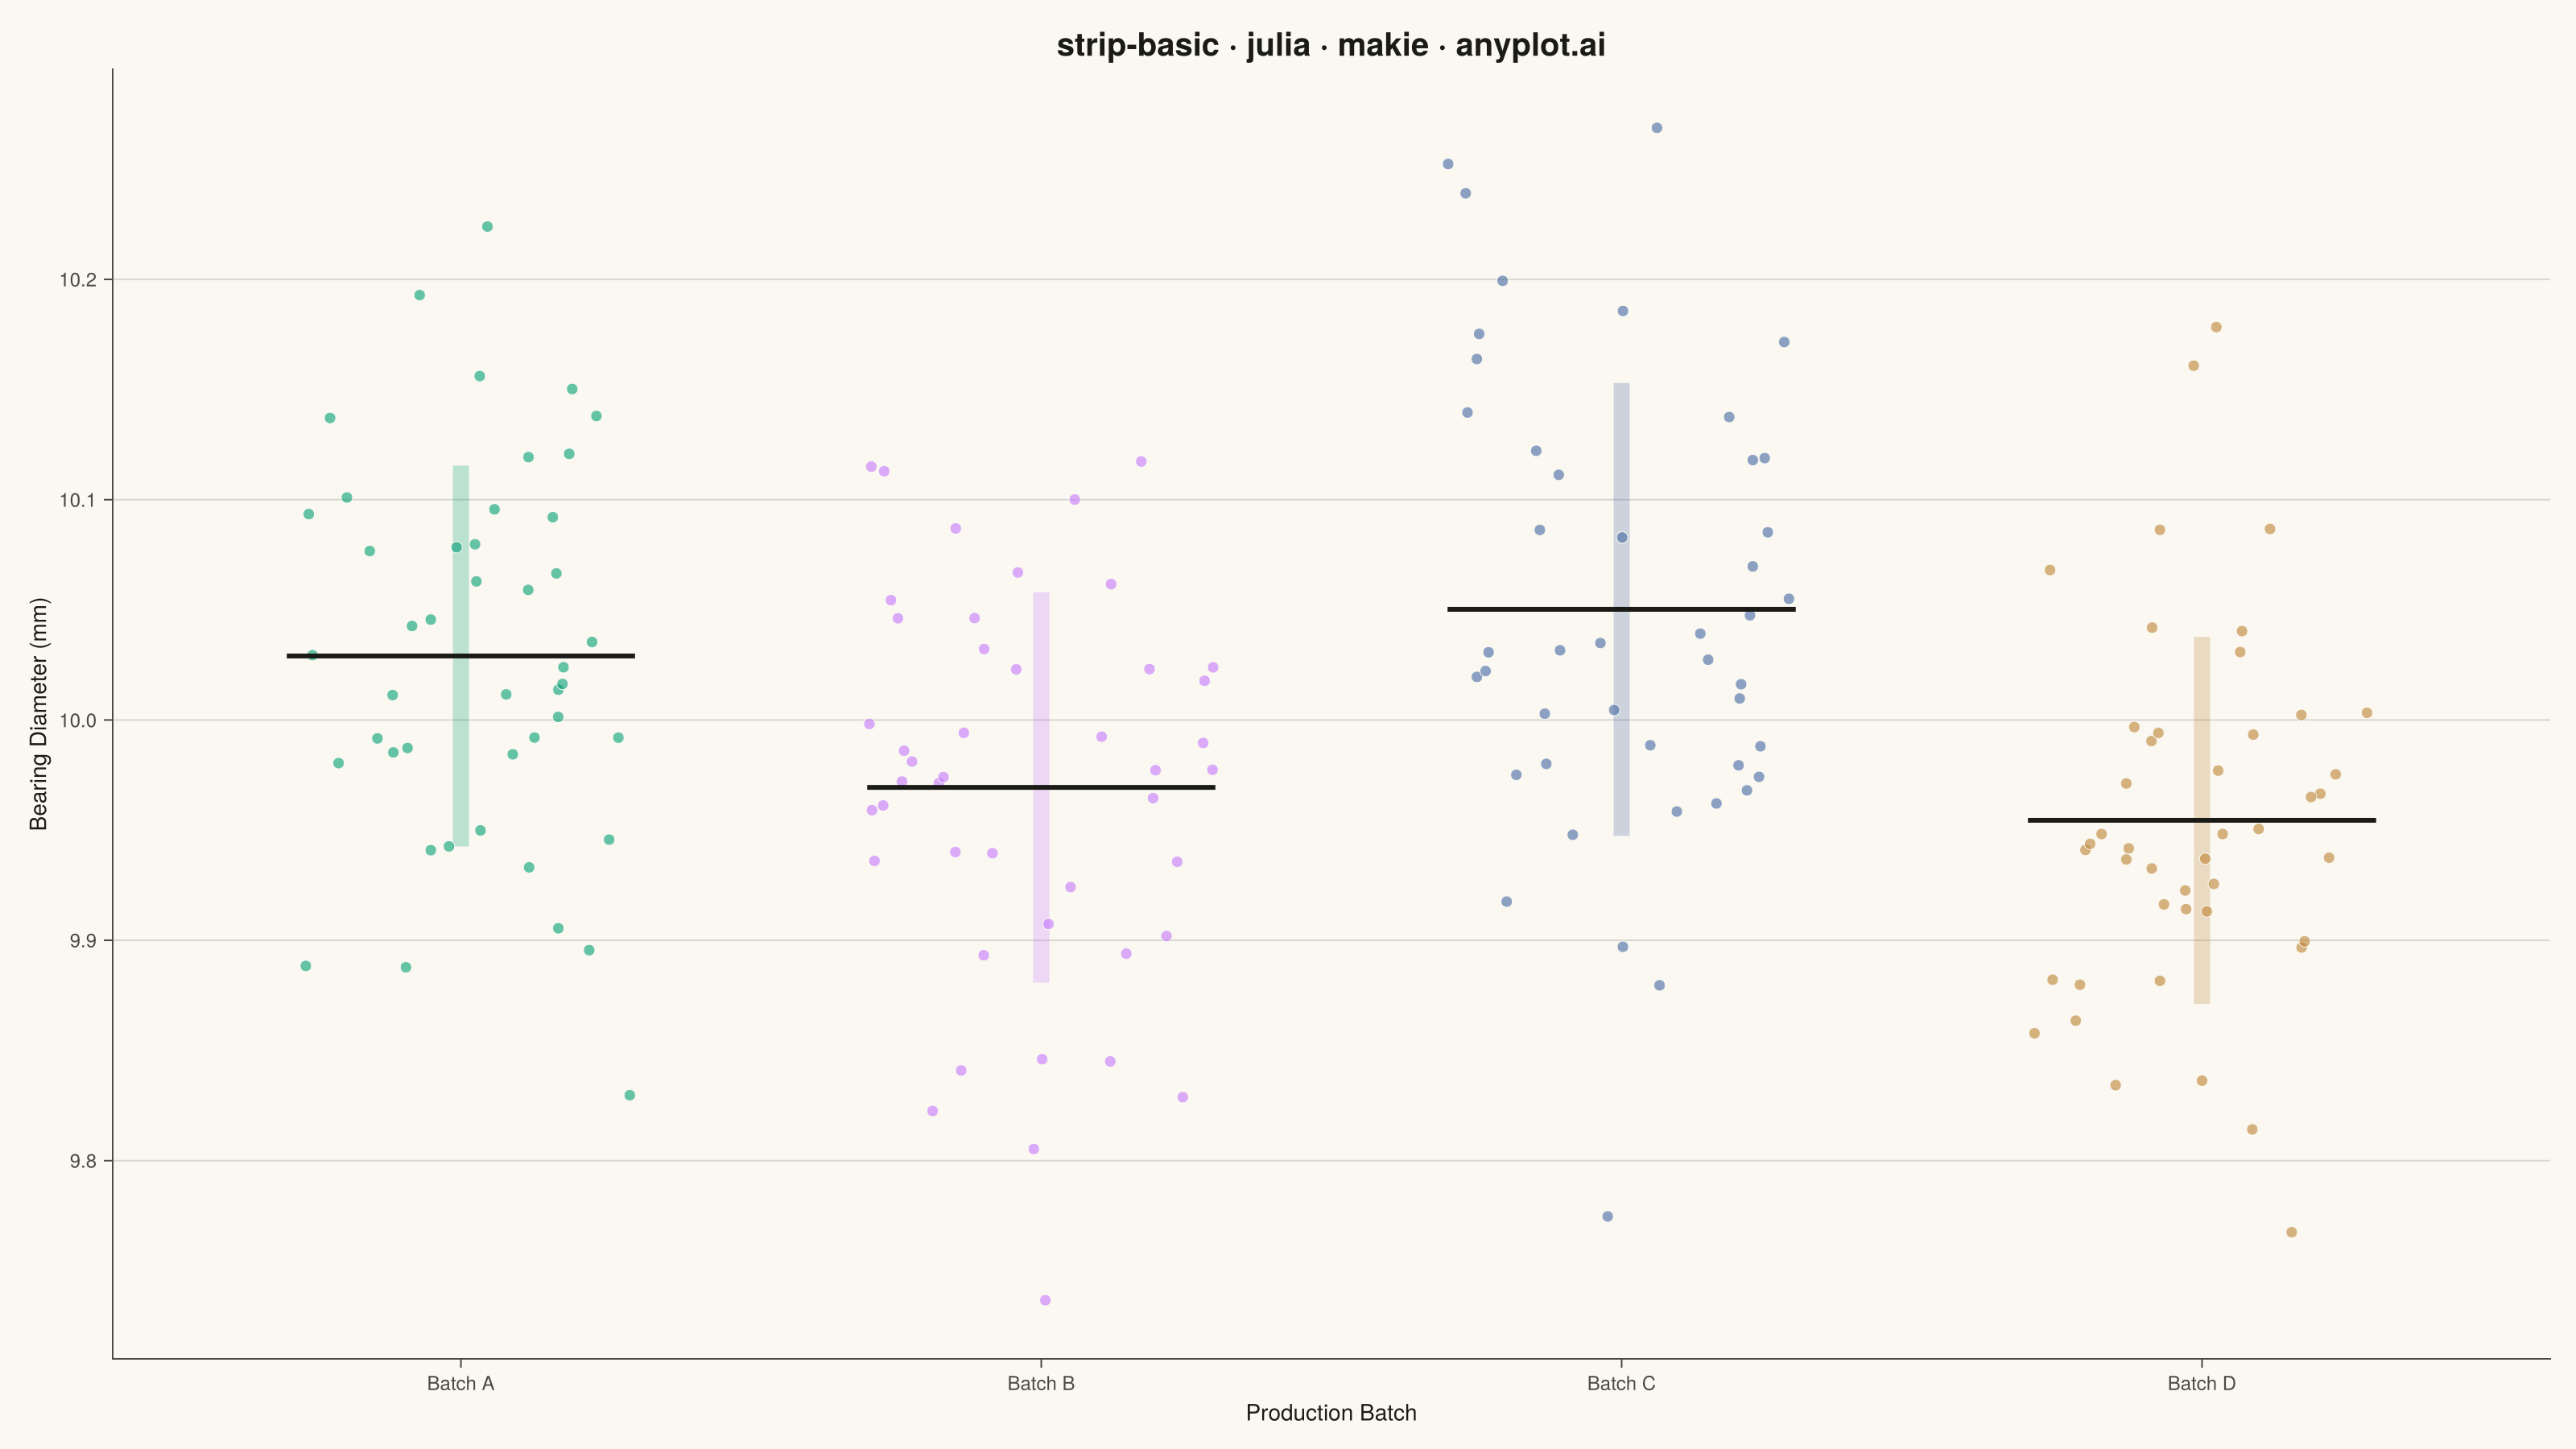
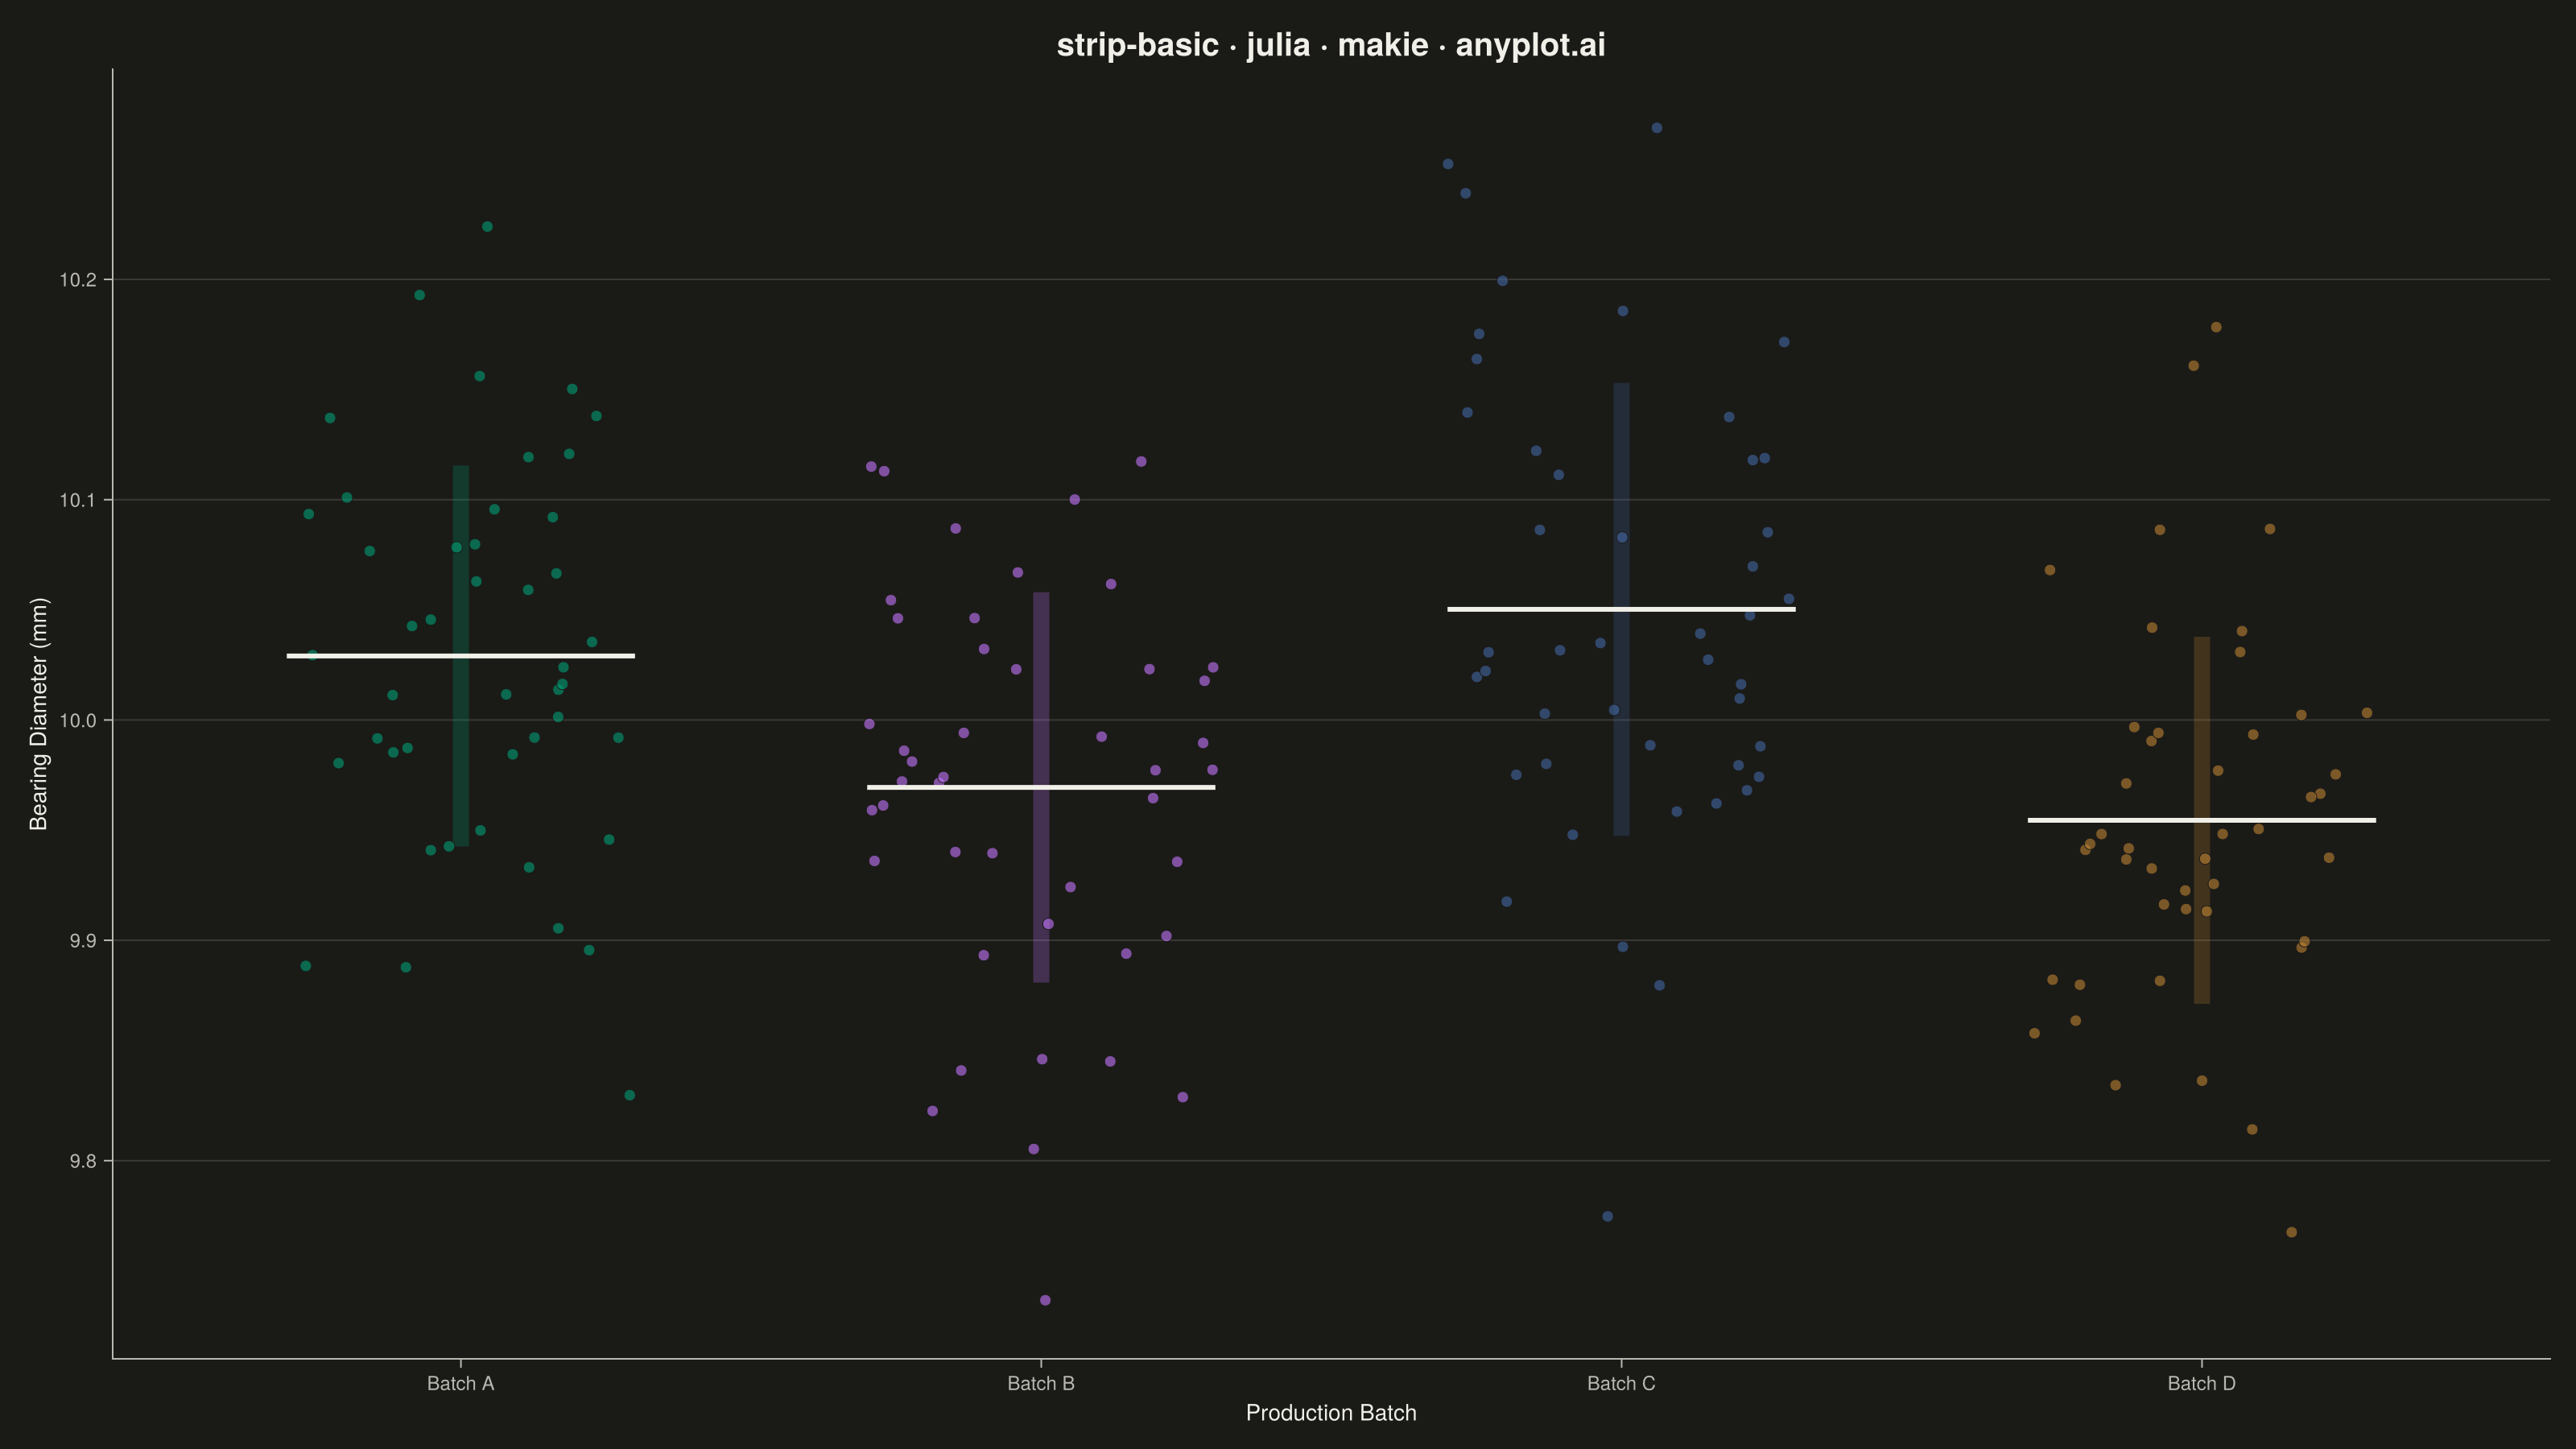
The same plot in 14 other libraries — Python: Altair, Bokeh, lets-plot, Matplotlib, Plotly, plotnine, Pygal, Seaborn; R: ggplot2; JavaScript: Chart.js, D3.js, Apache ECharts, Highcharts, MUI X Charts. Compare all 15 side by side: Basic Strip Plot in Python, R, Julia and JavaScript.
A strip plot displays individual data points for each category along a single axis, with random horizontal jitter applied to reduce overplotting. Unlike box plots or violin plots that show summary statistics, strip plots reveal every observation, making them ideal for small to medium datasets where individual values matter. The random jitter spreads points horizontally within each category to show density through point accumulation.
# anyplot.ai
# strip-basic: Basic Strip Plot
# Library: makie 0.21.9 | Julia 1.11.9
# Quality: 94/100 | Created: 2026-08-05

using CairoMakie
using Colors
using Random
using Statistics

Random.seed!(42)

# --- Theme tokens ------------------------------------------------------------
const THEME    = get(ENV, "ANYPLOT_THEME", "light")
const PAGE_BG  = THEME == "light" ? colorant"#FAF8F1" : colorant"#1A1A17"
const INK      = THEME == "light" ? colorant"#1A1A17" : colorant"#F0EFE8"
const INK_SOFT = THEME == "light" ? colorant"#4A4A44" : colorant"#B8B7B0"
const IMPRINT_PALETTE = [
    colorant"#009E73", colorant"#C475FD", colorant"#4467A3", colorant"#BD8233",
]

# --- Data ----------------------------------------------------------------
# Ball-bearing diameter (mm) measured across four production batches.
batches = ["Batch A", "Batch B", "Batch C", "Batch D"]
batch_means = [10.02, 9.97, 10.06, 9.94]
n_per_batch = 45
jitter_width = 0.3

x = Float64[]
diameters = Float64[]
group = Int[]
for (i, batch_mean) in enumerate(batch_means)
    readings = batch_mean .+ 0.09 .* randn(n_per_batch)
    jitter = (rand(n_per_batch) .- 0.5) .* (2 * jitter_width)
    append!(x, fill(Float64(i), n_per_batch) .+ jitter)
    append!(diameters, readings)
    append!(group, fill(i, n_per_batch))
end

colors = IMPRINT_PALETTE[group]

# Per-batch summary stats computed from the actual sampled readings
sample_means = [mean(diameters[group .== i]) for i in 1:length(batches)]
sample_stds = [std(diameters[group .== i]) for i in 1:length(batches)]

# --- Plot ------------------------------------------------------------------
fig = Figure(
    size            = (1600, 900),
    fontsize        = 14,
    backgroundcolor = PAGE_BG,
)

ax = Axis(
    fig[1, 1];
    title             = "strip-basic · julia · makie · anyplot.ai",
    titlesize         = 20,
    titlecolor        = INK,
    xlabel            = "Production Batch",
    ylabel            = "Bearing Diameter (mm)",
    xlabelsize        = 14,
    ylabelsize        = 14,
    xlabelcolor       = INK,
    ylabelcolor       = INK,
    xticklabelsize    = 12,
    yticklabelsize    = 12,
    xticklabelcolor   = INK_SOFT,
    yticklabelcolor   = INK_SOFT,
    xtickcolor        = INK_SOFT,
    ytickcolor        = INK_SOFT,
    backgroundcolor   = PAGE_BG,
    topspinevisible   = false,
    rightspinevisible = false,
    leftspinecolor    = INK_SOFT,
    bottomspinecolor  = INK_SOFT,
    xgridvisible      = false,
    ygridcolor        = RGBAf(INK.r, INK.g, INK.b, 0.15),
    xticks            = (1:length(batches), batches),
)

# Soft ±1 SD spread band per batch, drawn behind the jittered points
rangebars!(ax, 1:length(batches), sample_means .- sample_stds, sample_means .+ sample_stds;
    color        = [(c, 0.25) for c in IMPRINT_PALETTE],
    linewidth    = 10,
    whiskerwidth = 0,
)

scatter!(ax, x, diameters;
    color       = colors,
    markersize  = 10,
    alpha       = 0.6,
    strokewidth = 0.5,
    strokecolor = PAGE_BG,
)

# Batch mean reference tick, drawn on top so it reads clearly against the points
mean_ticks = Point2f[]
for (i, m) in enumerate(sample_means)
    push!(mean_ticks, Point2f(i - jitter_width, m))
    push!(mean_ticks, Point2f(i + jitter_width, m))
end
linesegments!(ax, mean_ticks; color = INK, linewidth = 3)

xlims!(ax, 0.4, length(batches) + 0.6)

# --- Save --------------------------------------------------------------------
save("plot-$(THEME).png", fig; px_per_unit = 2)
Runnable source as JSON, for any HTTP client: https://api.anyplot.ai/specs/strip-basic/makie/code. Any spec id and library id listed in llms-full.txt fit the same URL shape; every URL below is complete and callable.
{
  "spec_id": "strip-basic",
  "language": "julia",
  "library": "makie",
  "page": "https://anyplot.ai/strip-basic/julia/makie",
  "hub": "https://anyplot.ai/strip-basic",
  "code_json": "https://api.anyplot.ai/specs/strip-basic/makie/code",
  "spec_json": "https://api.anyplot.ai/specs/strip-basic",
  "render_light_png": "https://storage.googleapis.com/anyplot-images/plots/strip-basic/julia/makie/plot-light.png",
  "render_dark_png": "https://storage.googleapis.com/anyplot-images/plots/strip-basic/julia/makie/plot-dark.png",
  "quality_score": 94.0,
  "license": "MIT",
  "guide": "https://anyplot.ai/llms.txt"
}
Part of Basic Strip Plot on anyplot.ai.