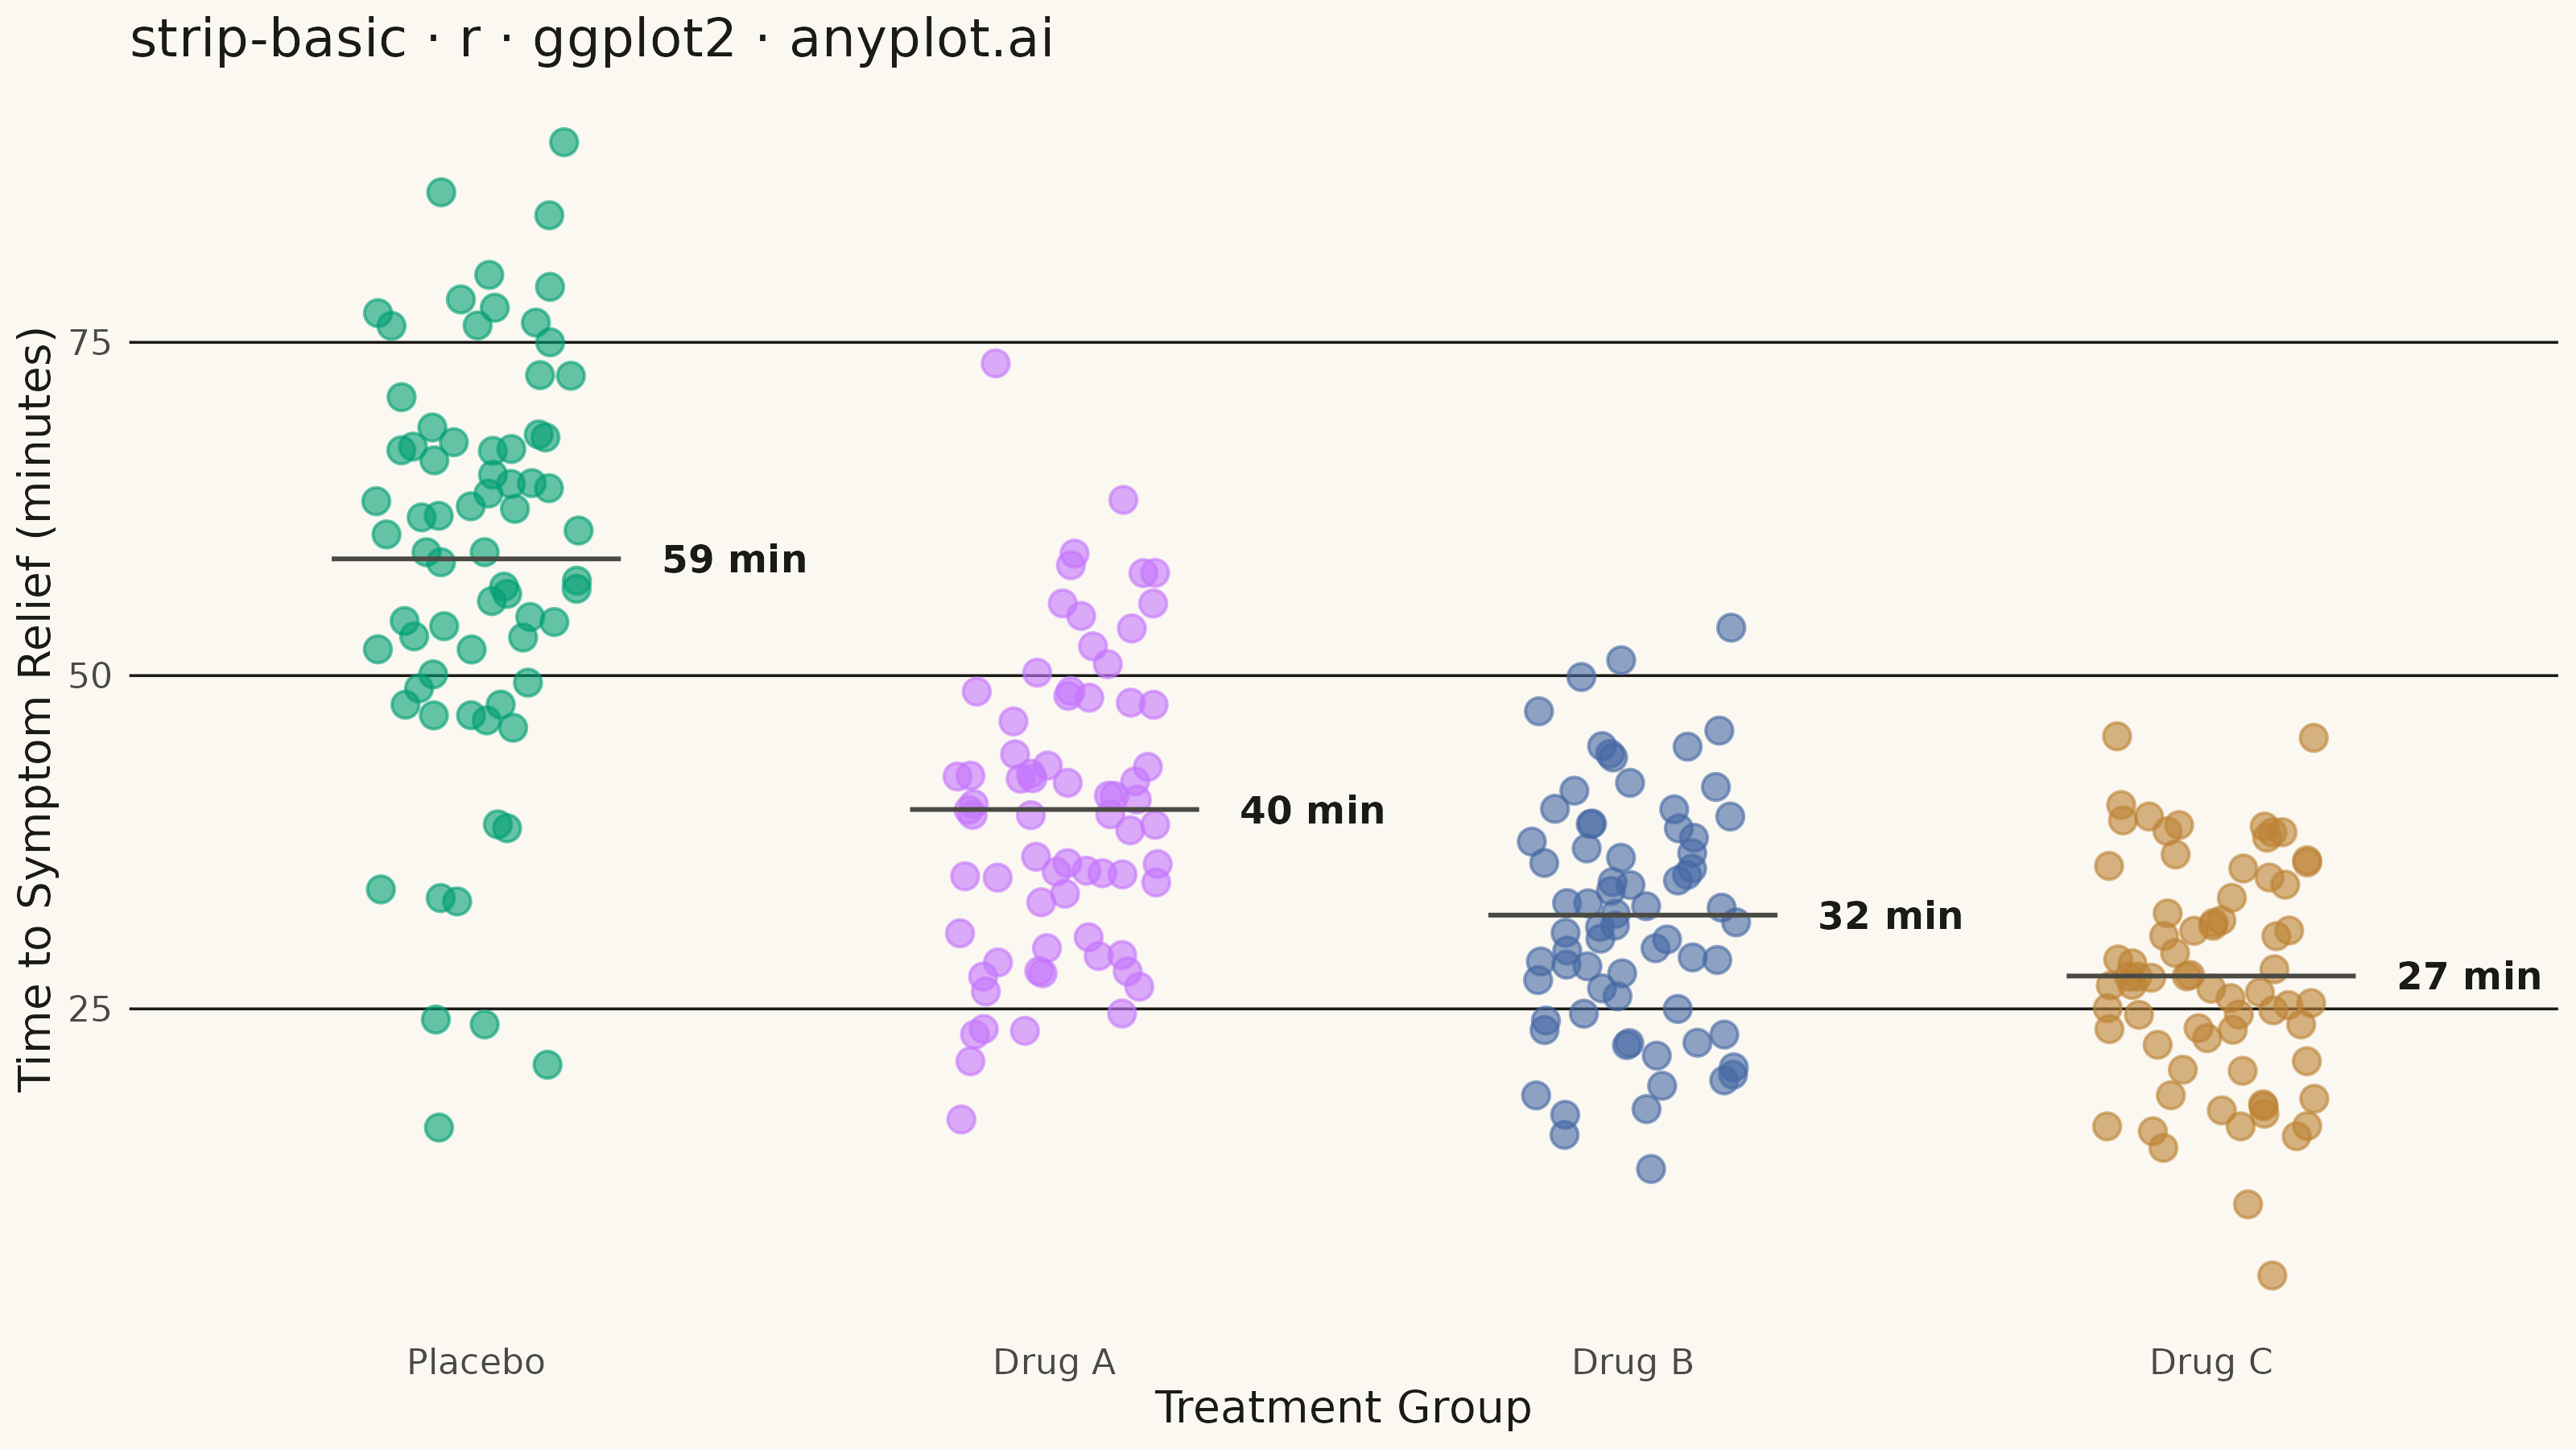
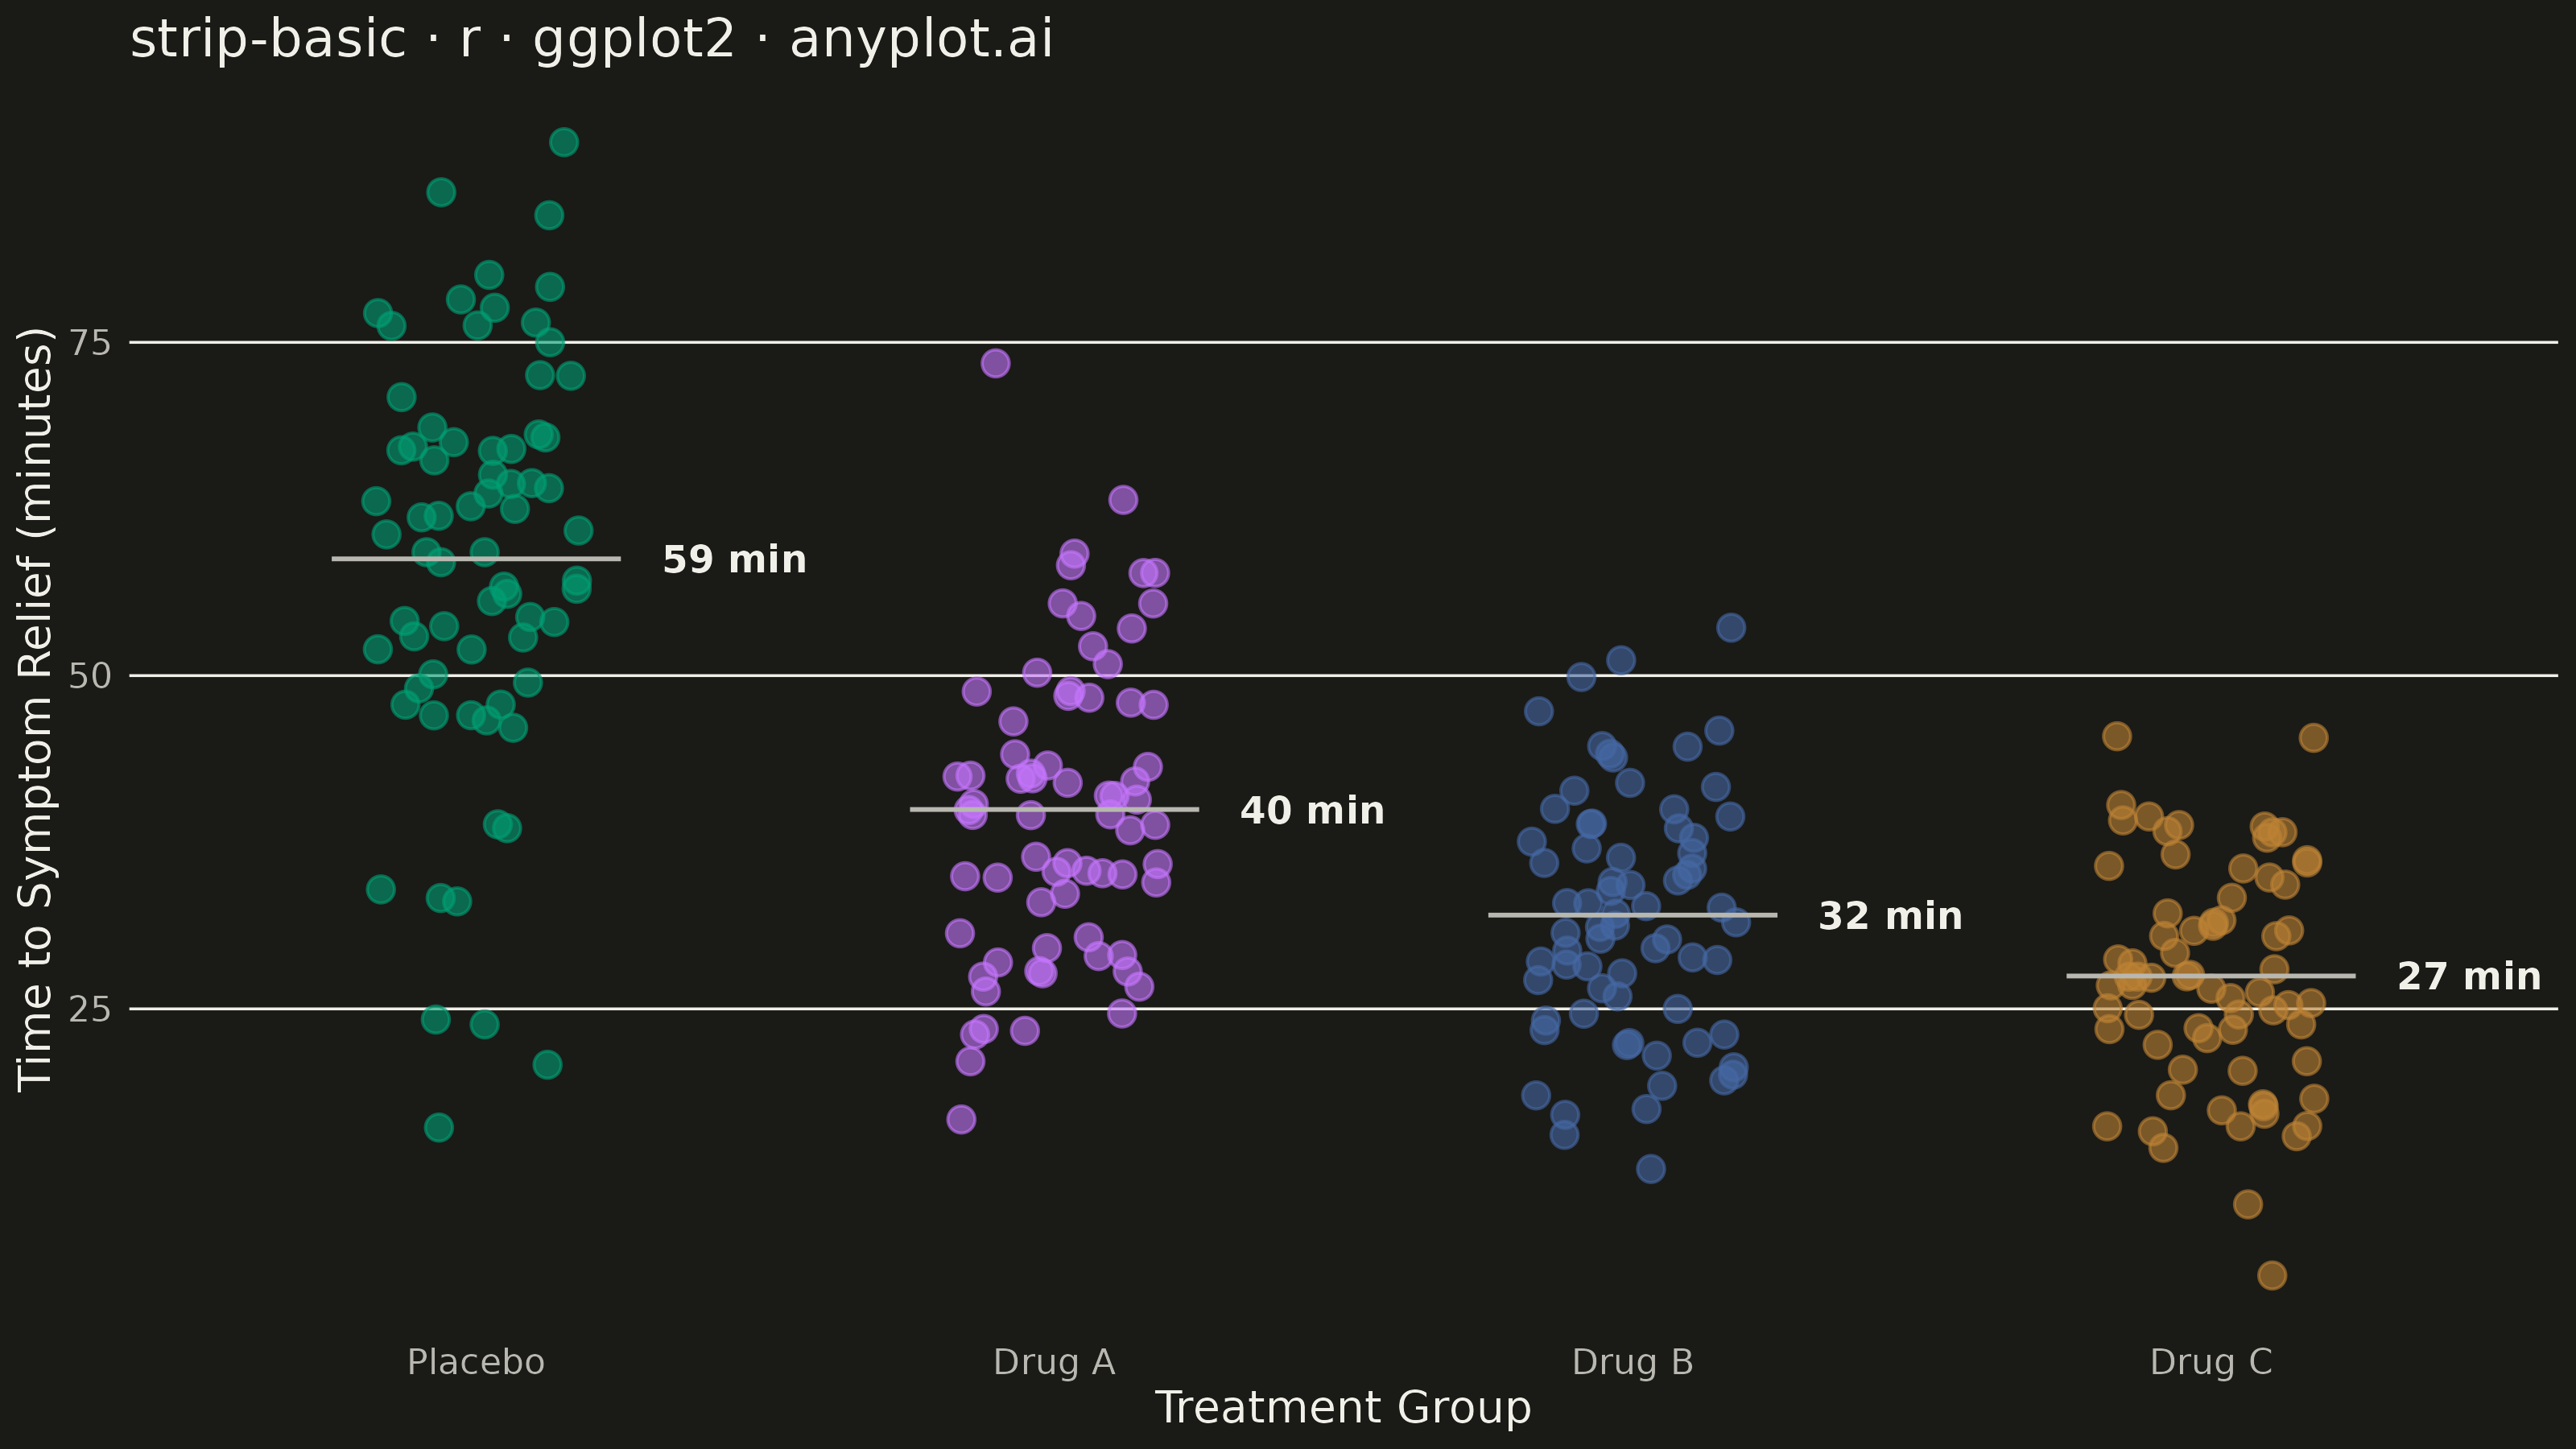
The same plot in 14 other libraries — Python: Altair, Bokeh, lets-plot, Matplotlib, Plotly, plotnine, Pygal, Seaborn; Julia: Makie.jl; JavaScript: Chart.js, D3.js, Apache ECharts, Highcharts, MUI X Charts. Compare all 15 side by side: Basic Strip Plot in Python, R, Julia and JavaScript.
A strip plot displays individual data points for each category along a single axis, with random horizontal jitter applied to reduce overplotting. Unlike box plots or violin plots that show summary statistics, strip plots reveal every observation, making them ideal for small to medium datasets where individual values matter. The random jitter spreads points horizontally within each category to show density through point accumulation.
#' anyplot.ai
#' strip-basic: Basic Strip Plot
#' Library: ggplot2 3.5.1 | R 4.4.1
#' Quality: 92/100 | Created: 2026-08-05

library(ggplot2)
library(ragg)

set.seed(42)

# Theme tokens (see prompts/default-style-guide.md "Background" + "Theme-adaptive Chrome")
THEME       <- Sys.getenv("ANYPLOT_THEME", "light")
PAGE_BG     <- if (THEME == "light") "#FAF8F1" else "#1A1A17"
INK         <- if (THEME == "light") "#1A1A17" else "#F0EFE8"
INK_SOFT    <- if (THEME == "light") "#4A4A44" else "#B8B7B0"
IMPRINT_PALETTE <- c("#009E73", "#C475FD", "#4467A3", "#BD8233",
                     "#AE3030", "#2ABCCD", "#954477", "#99B314")

# Data: time to symptom relief across drug trial groups
groups <- c("Placebo", "Drug A", "Drug B", "Drug C")
group_means <- c(58, 41, 33, 27)
group_sds   <- c(14, 12, 10, 9)
group_n     <- c(70, 70, 70, 70)

df <- do.call(rbind, lapply(seq_along(groups), function(i) {
  data.frame(
    group = groups[i],
    minutes = pmax(5, rnorm(group_n[i], mean = group_means[i], sd = group_sds[i]))
  )
}))
df$group <- factor(df$group, levels = groups)

# Plot
p <- ggplot(df, aes(x = group, y = minutes, color = group)) +
  geom_jitter(width = 0.18, size = 2.5, alpha = 0.6, show.legend = FALSE) +
  stat_summary(fun = mean, geom = "crossbar", width = 0.5,
               color = INK_SOFT, linewidth = 0.5, fatten = 1) +
  stat_summary(
    aes(label = after_stat(sprintf("%.0f min", y))),
    fun = mean, geom = "text", color = INK, size = 3,
    fontface = "bold", hjust = 0, vjust = 0.5,
    position = position_nudge(x = 0.32), show.legend = FALSE
  ) +
  scale_color_manual(values = IMPRINT_PALETTE) +
  labs(
    x = "Treatment Group",
    y = "Time to Symptom Relief (minutes)",
    title = "strip-basic · r · ggplot2 · anyplot.ai"
  ) +
  theme_minimal(base_size = 8) +
  theme(
    plot.background   = element_rect(fill = PAGE_BG, color = PAGE_BG),
    panel.background  = element_rect(fill = PAGE_BG, color = NA),
    panel.grid.major.x = element_blank(),
    panel.grid.minor  = element_blank(),
    panel.grid.major.y = element_line(color = INK, linewidth = 0.3),
    axis.title        = element_text(color = INK, size = 10),
    axis.text         = element_text(color = INK_SOFT, size = 8),
    axis.ticks        = element_blank(),
    plot.title        = element_text(color = INK, size = 12)
  )

# Save
ggsave(
  filename = sprintf("plot-%s.png", THEME),
  plot     = p,
  device   = ragg::agg_png,
  width    = 8,
  height   = 4.5,
  units    = "in",
  dpi      = 400
)
Runnable source as JSON, for any HTTP client: https://api.anyplot.ai/specs/strip-basic/ggplot2/code. Any spec id and library id listed in llms-full.txt fit the same URL shape; every URL below is complete and callable.
{
  "spec_id": "strip-basic",
  "language": "r",
  "library": "ggplot2",
  "page": "https://anyplot.ai/strip-basic/r/ggplot2",
  "hub": "https://anyplot.ai/strip-basic",
  "code_json": "https://api.anyplot.ai/specs/strip-basic/ggplot2/code",
  "spec_json": "https://api.anyplot.ai/specs/strip-basic",
  "render_light_png": "https://storage.googleapis.com/anyplot-images/plots/strip-basic/r/ggplot2/plot-light.png",
  "render_dark_png": "https://storage.googleapis.com/anyplot-images/plots/strip-basic/r/ggplot2/plot-dark.png",
  "quality_score": 92.0,
  "license": "MIT",
  "guide": "https://anyplot.ai/llms.txt"
}
Part of Basic Strip Plot on anyplot.ai.