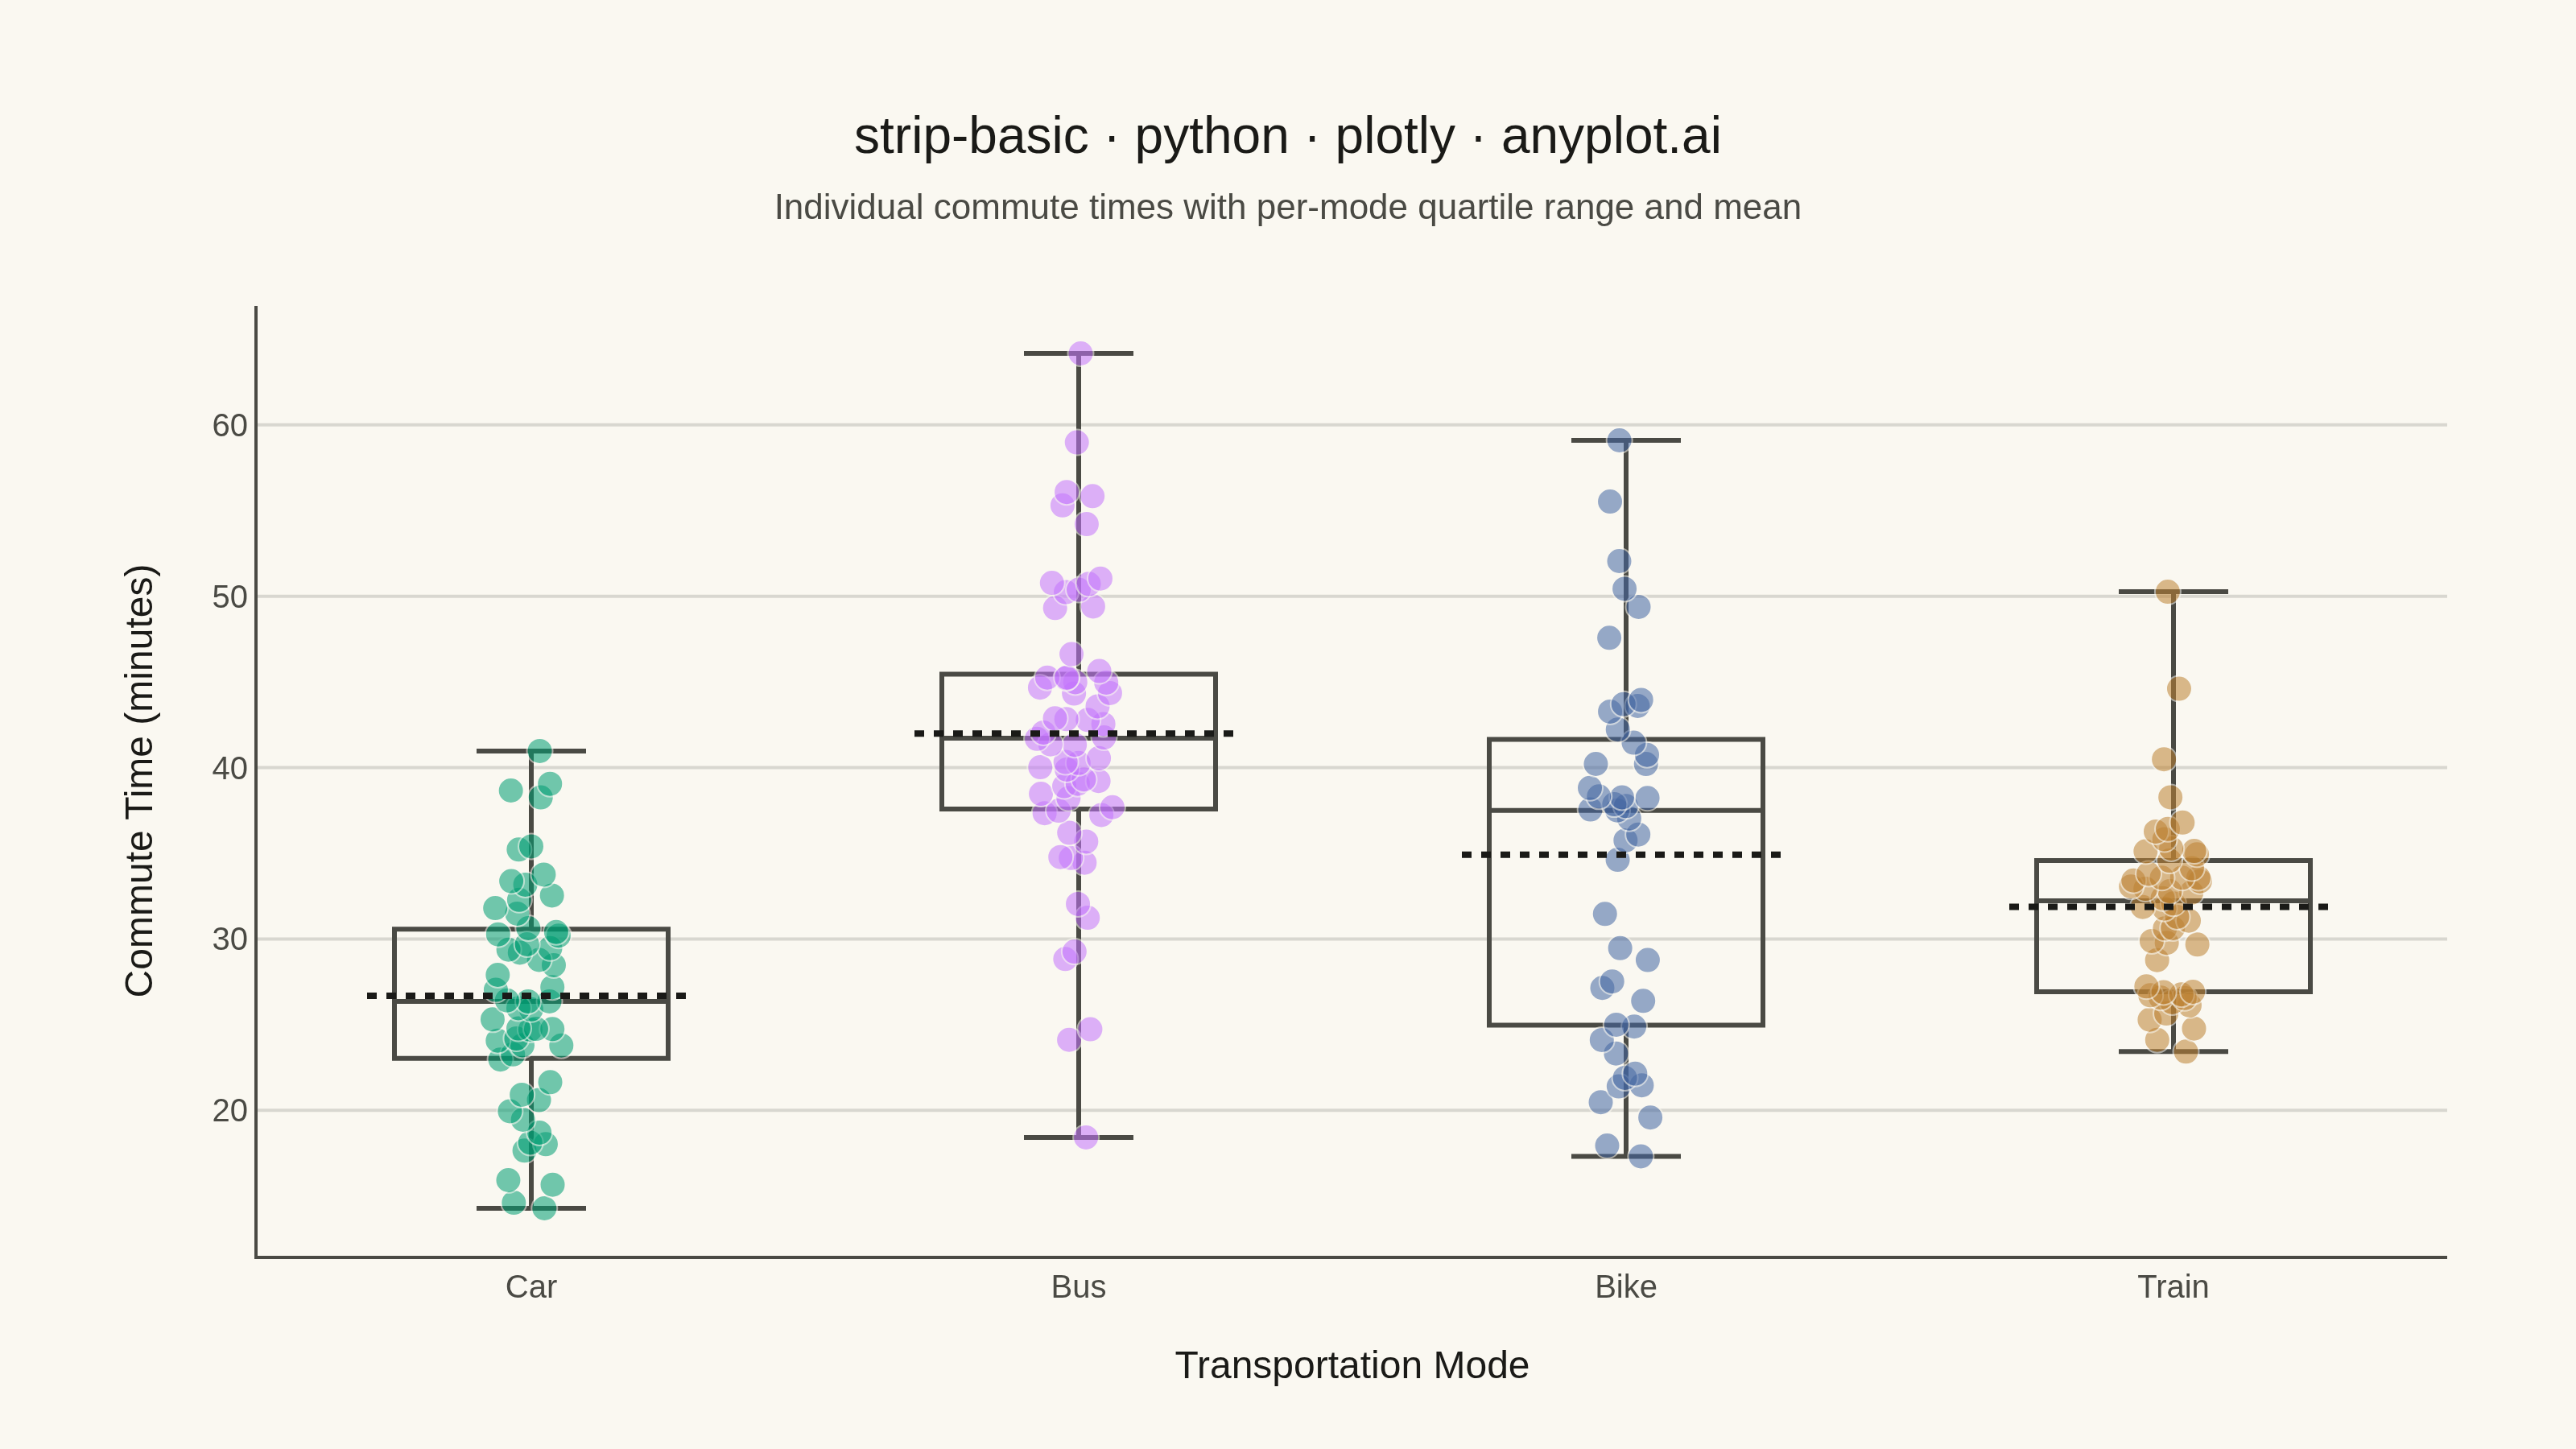
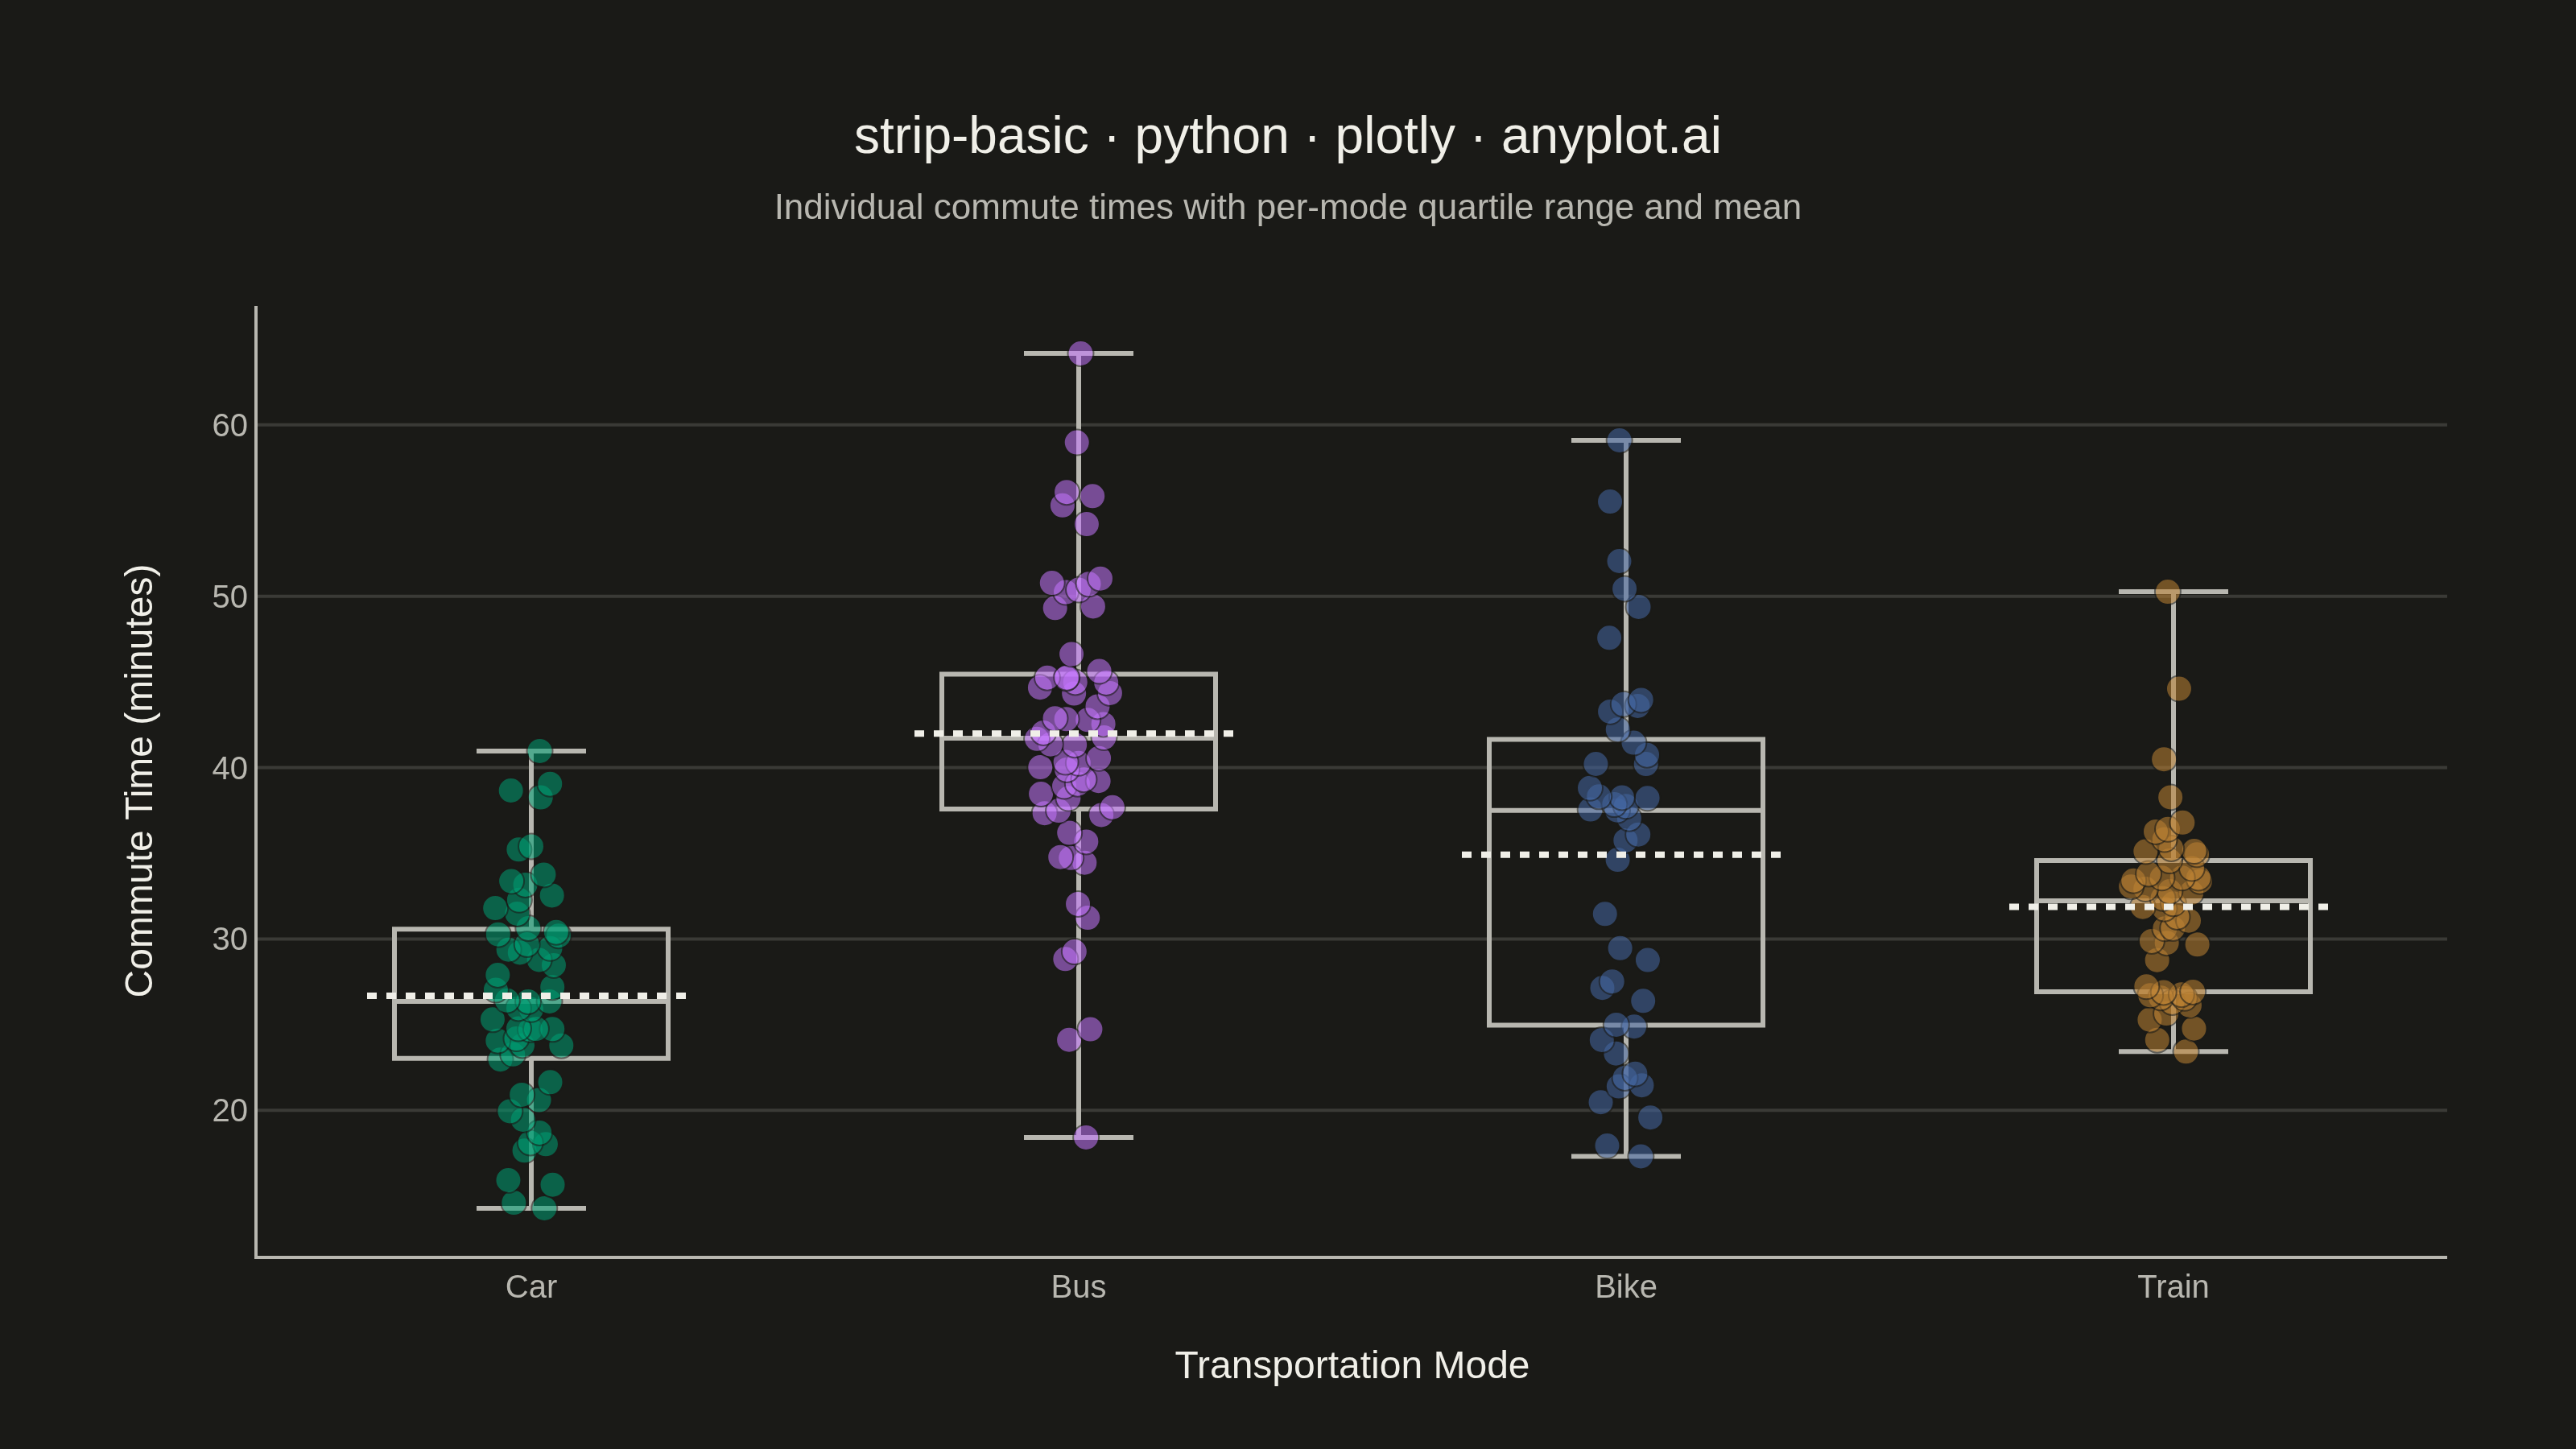
A strip plot displays individual data points for each category along a single axis, with random horizontal jitter applied to reduce overplotting. Unlike box plots or violin plots that show summary statistics, strip plots reveal every observation, making them ideal for small to medium datasets where individual values matter. The random jitter spreads points horizontally within each category to show density through point accumulation.
""" anyplot.ai
strip-basic: Basic Strip Plot
Library: plotly 6.9.0 | Python 3.13.14
Quality: 89/100 | Updated: 2026-08-05
"""

import os

import numpy as np
import pandas as pd
import plotly.express as px
import plotly.graph_objects as go


# Theme tokens
THEME = os.getenv("ANYPLOT_THEME", "light")
PAGE_BG = "#FAF8F1" if THEME == "light" else "#1A1A17"
INK = "#1A1A17" if THEME == "light" else "#F0EFE8"
INK_SOFT = "#4A4A44" if THEME == "light" else "#B8B7B0"
GRID = "rgba(26,26,23,0.15)" if THEME == "light" else "rgba(240,239,232,0.15)"

# Imprint palette — first series always #009E73
IMPRINT_PALETTE = ["#009E73", "#C475FD", "#4467A3", "#BD8233"]

# Data - Commute time per trip, sampled across commonly used transport modes
np.random.seed(42)

modes = ["Car", "Bus", "Bike", "Train"]
n_per_mode = [55, 60, 45, 50]
mean_minutes = [28, 42, 35, 31]
std_minutes = [7, 9, 11, 5]

commute = pd.concat(
    [
        pd.DataFrame({"mode": mode, "commute_time": np.clip(np.random.normal(mean, std, n), 3, None)})
        for mode, n, mean, std in zip(modes, n_per_mode, mean_minutes, std_minutes, strict=True)
    ],
    ignore_index=True,
)

# Quartile box summary (transparent fill, no whisker caps) layered behind the strip
# points — a plotly-specific composite of an Express strip trace with a Graph
# Objects box trace, giving each column distribution context the raw points alone
# don't convey.
fig = go.Figure()
for mode in modes:
    values = commute.loc[commute["mode"] == mode, "commute_time"]
    fig.add_trace(
        go.Box(
            x=[mode] * len(values),
            y=values,
            name=mode,
            boxpoints=False,
            fillcolor="rgba(0,0,0,0)",
            line={"color": INK_SOFT, "width": 1.5},
            whiskerwidth=0.4,
            width=0.5,
            showlegend=False,
            hoverinfo="skip",
        )
    )

strip = px.strip(
    commute,
    x="mode",
    y="commute_time",
    color="mode",
    category_orders={"mode": modes},
    color_discrete_sequence=IMPRINT_PALETTE,
)
strip.update_traces(
    jitter=0.35,
    marker={"size": 8, "opacity": 0.55, "line": {"width": 0.5, "color": PAGE_BG}},
    hovertemplate="<b>%{x}</b><br>Commute time: %{y:.1f} min<extra></extra>",
)
for trace in strip.data:
    fig.add_trace(trace)

# Mean reference lines
for i, mode in enumerate(modes):
    mean_val = commute.loc[commute["mode"] == mode, "commute_time"].mean()
    fig.add_shape(
        type="line", x0=i - 0.3, x1=i + 0.3, y0=mean_val, y1=mean_val, line={"color": INK, "width": 2, "dash": "dot"}
    )

# Style
fig.update_layout(
    autosize=False,
    paper_bgcolor=PAGE_BG,
    plot_bgcolor=PAGE_BG,
    showlegend=False,
    title={
        "text": "strip-basic · python · plotly · anyplot.ai",
        "subtitle": {
            "text": "Individual commute times with per-mode quartile range and mean",
            "font": {"size": 11, "color": INK_SOFT},
        },
        "font": {"size": 16, "color": INK},
        "x": 0.5,
        "xanchor": "center",
    },
    xaxis={
        "title": {"text": "Transportation Mode", "font": {"size": 12, "color": INK}},
        "tickfont": {"size": 10, "color": INK_SOFT},
        "categoryorder": "array",
        "categoryarray": modes,
        "showgrid": False,
        "linecolor": INK_SOFT,
        "zeroline": False,
    },
    yaxis={
        "title": {"text": "Commute Time (minutes)", "font": {"size": 12, "color": INK}},
        "tickfont": {"size": 10, "color": INK_SOFT},
        "gridcolor": GRID,
        "gridwidth": 1,
        "linecolor": INK_SOFT,
        "zerolinecolor": INK_SOFT,
    },
    margin={"l": 80, "r": 40, "t": 95, "b": 60},
)

# Save
fig.write_image(f"plot-{THEME}.png", width=800, height=450, scale=4)
fig.write_html(f"plot-{THEME}.html", include_plotlyjs="cdn")
Runnable source as JSON, for any HTTP client: https://api.anyplot.ai/specs/strip-basic/plotly/code. Any spec id and library id listed in llms-full.txt fit the same URL shape; every URL below is complete and callable.
{
  "spec_id": "strip-basic",
  "language": "python",
  "library": "plotly",
  "page": "https://anyplot.ai/strip-basic/python/plotly",
  "hub": "https://anyplot.ai/strip-basic",
  "code_json": "https://api.anyplot.ai/specs/strip-basic/plotly/code",
  "spec_json": "https://api.anyplot.ai/specs/strip-basic",
  "render_light_png": "https://storage.googleapis.com/anyplot-images/plots/strip-basic/python/plotly/plot-light.png",
  "render_dark_png": "https://storage.googleapis.com/anyplot-images/plots/strip-basic/python/plotly/plot-dark.png",
  "interactive_light_html": "https://storage.googleapis.com/anyplot-images/plots/strip-basic/python/plotly/plot-light.html",
  "interactive_dark_html": "https://storage.googleapis.com/anyplot-images/plots/strip-basic/python/plotly/plot-dark.html",
  "quality_score": 89.0,
  "license": "MIT",
  "guide": "https://anyplot.ai/llms.txt"
}
Part of Basic Strip Plot on anyplot.ai.