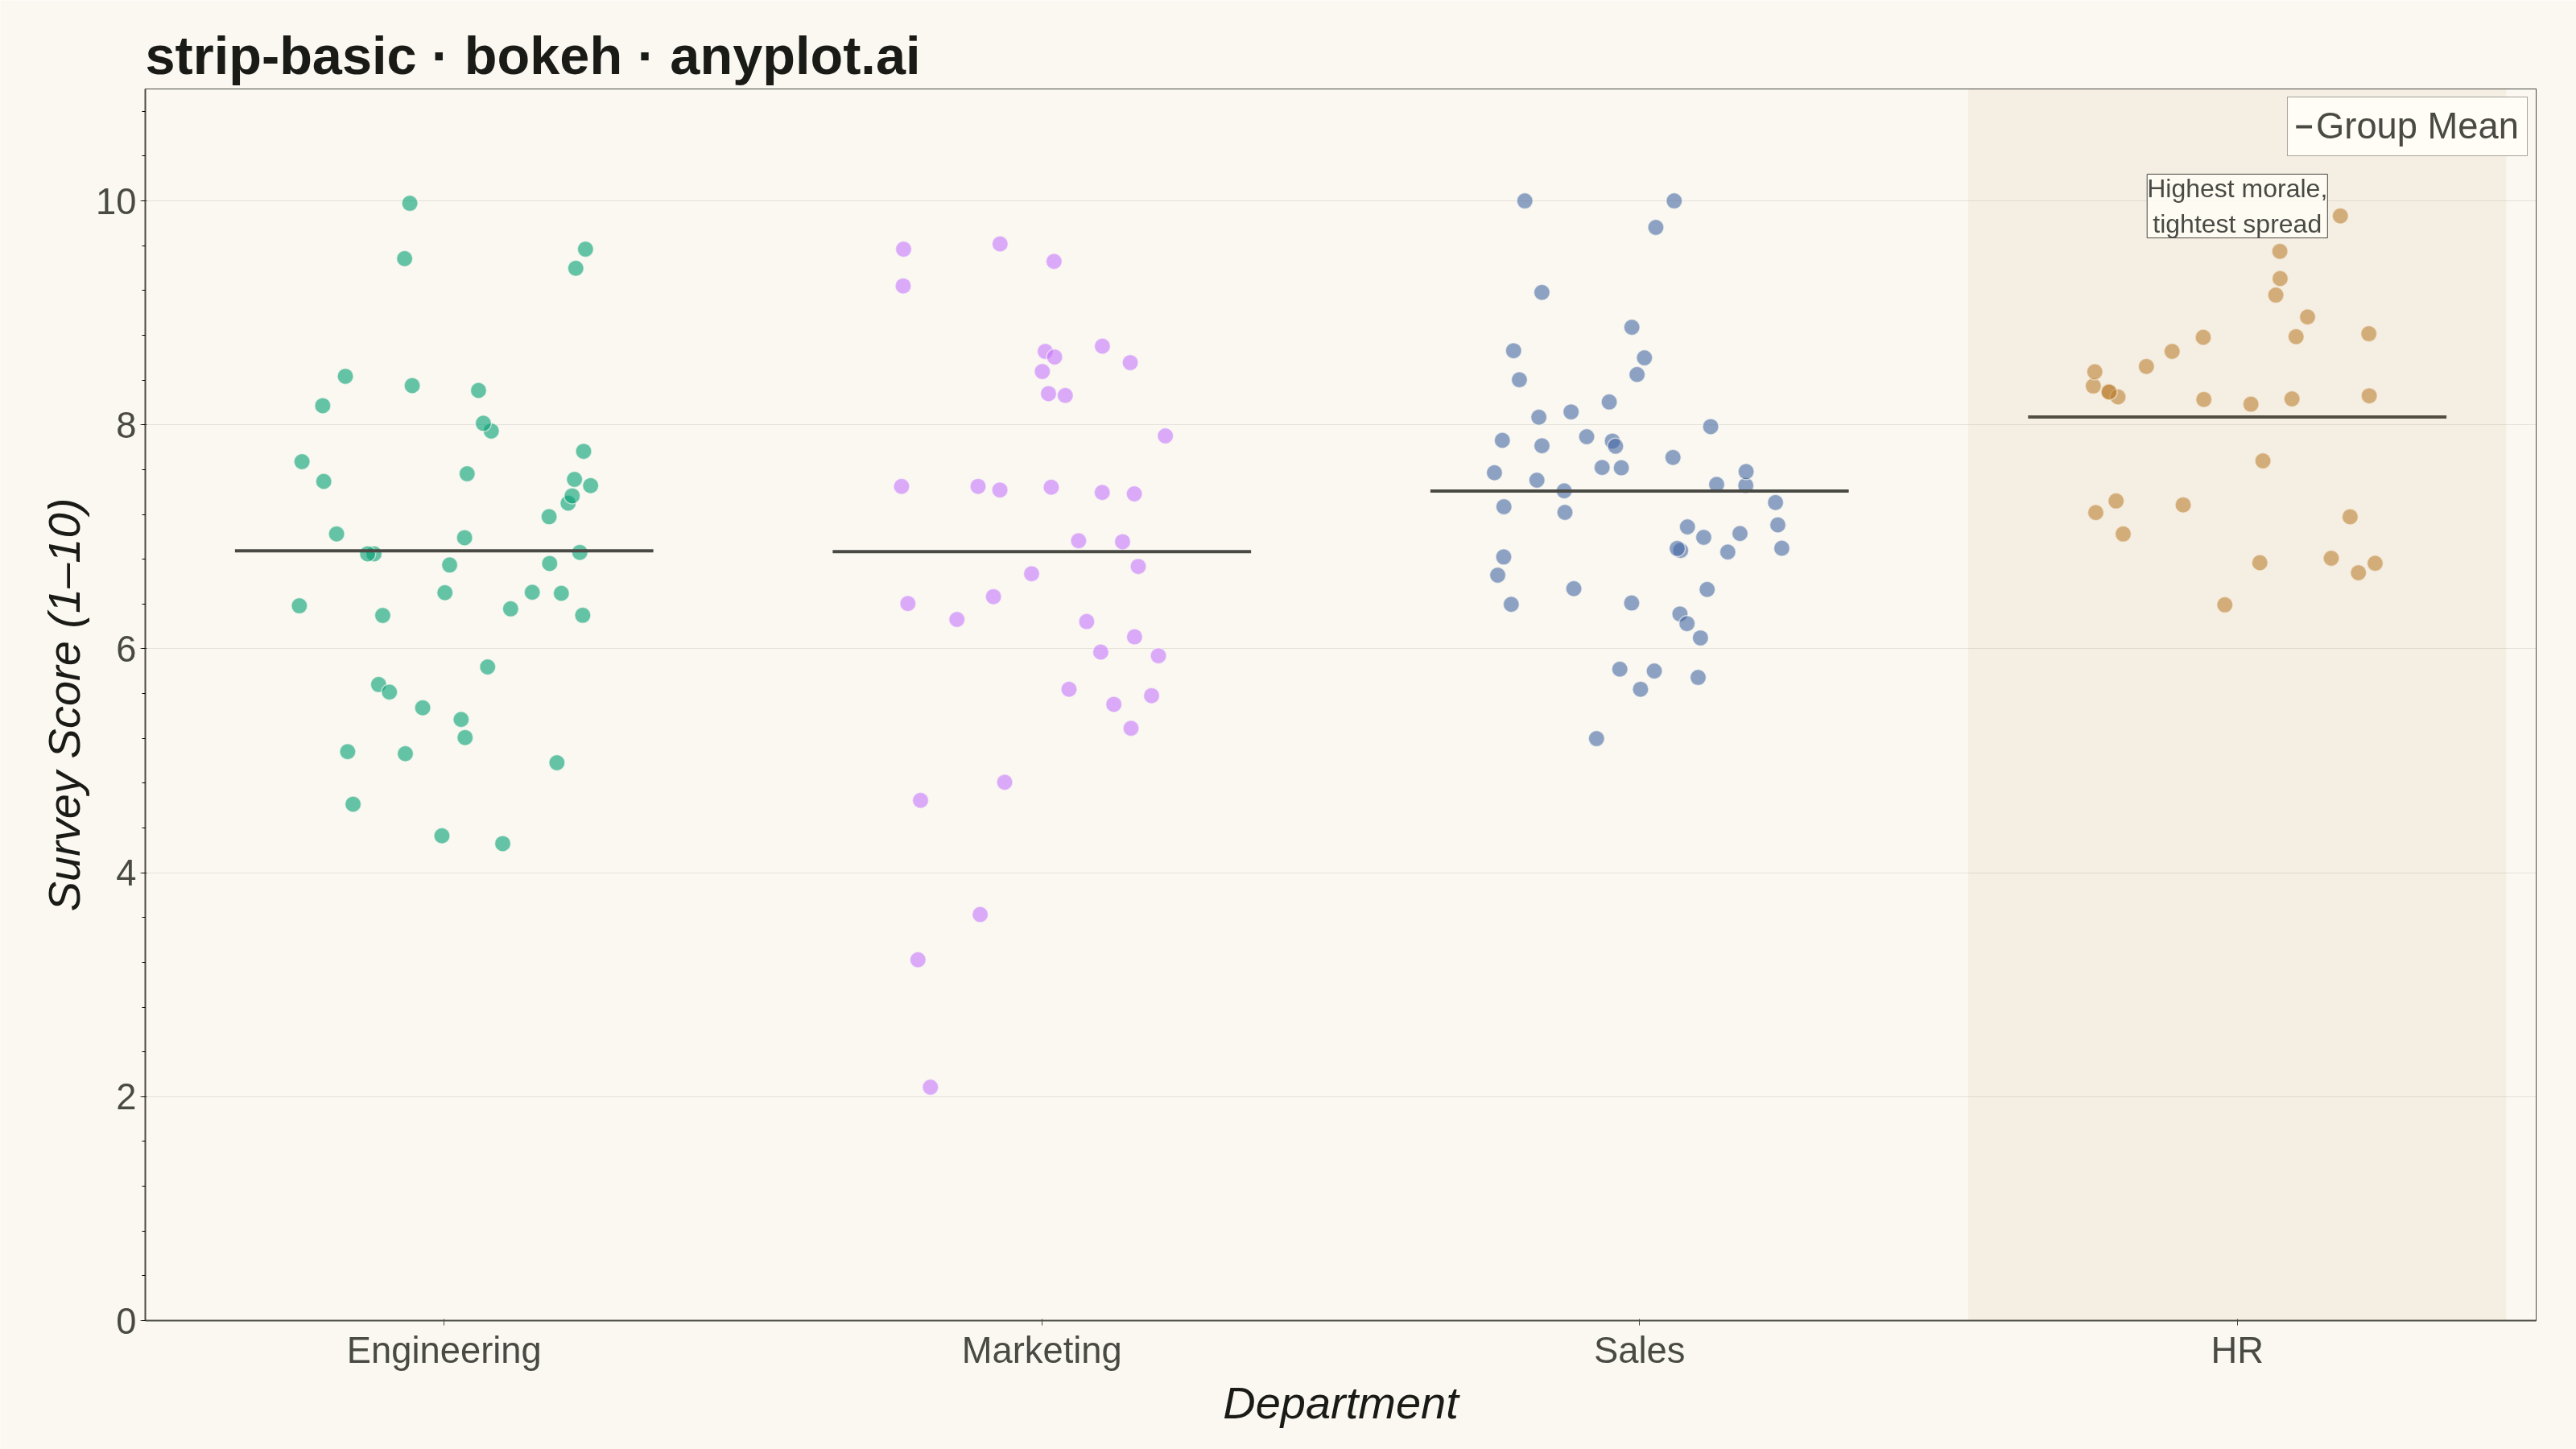
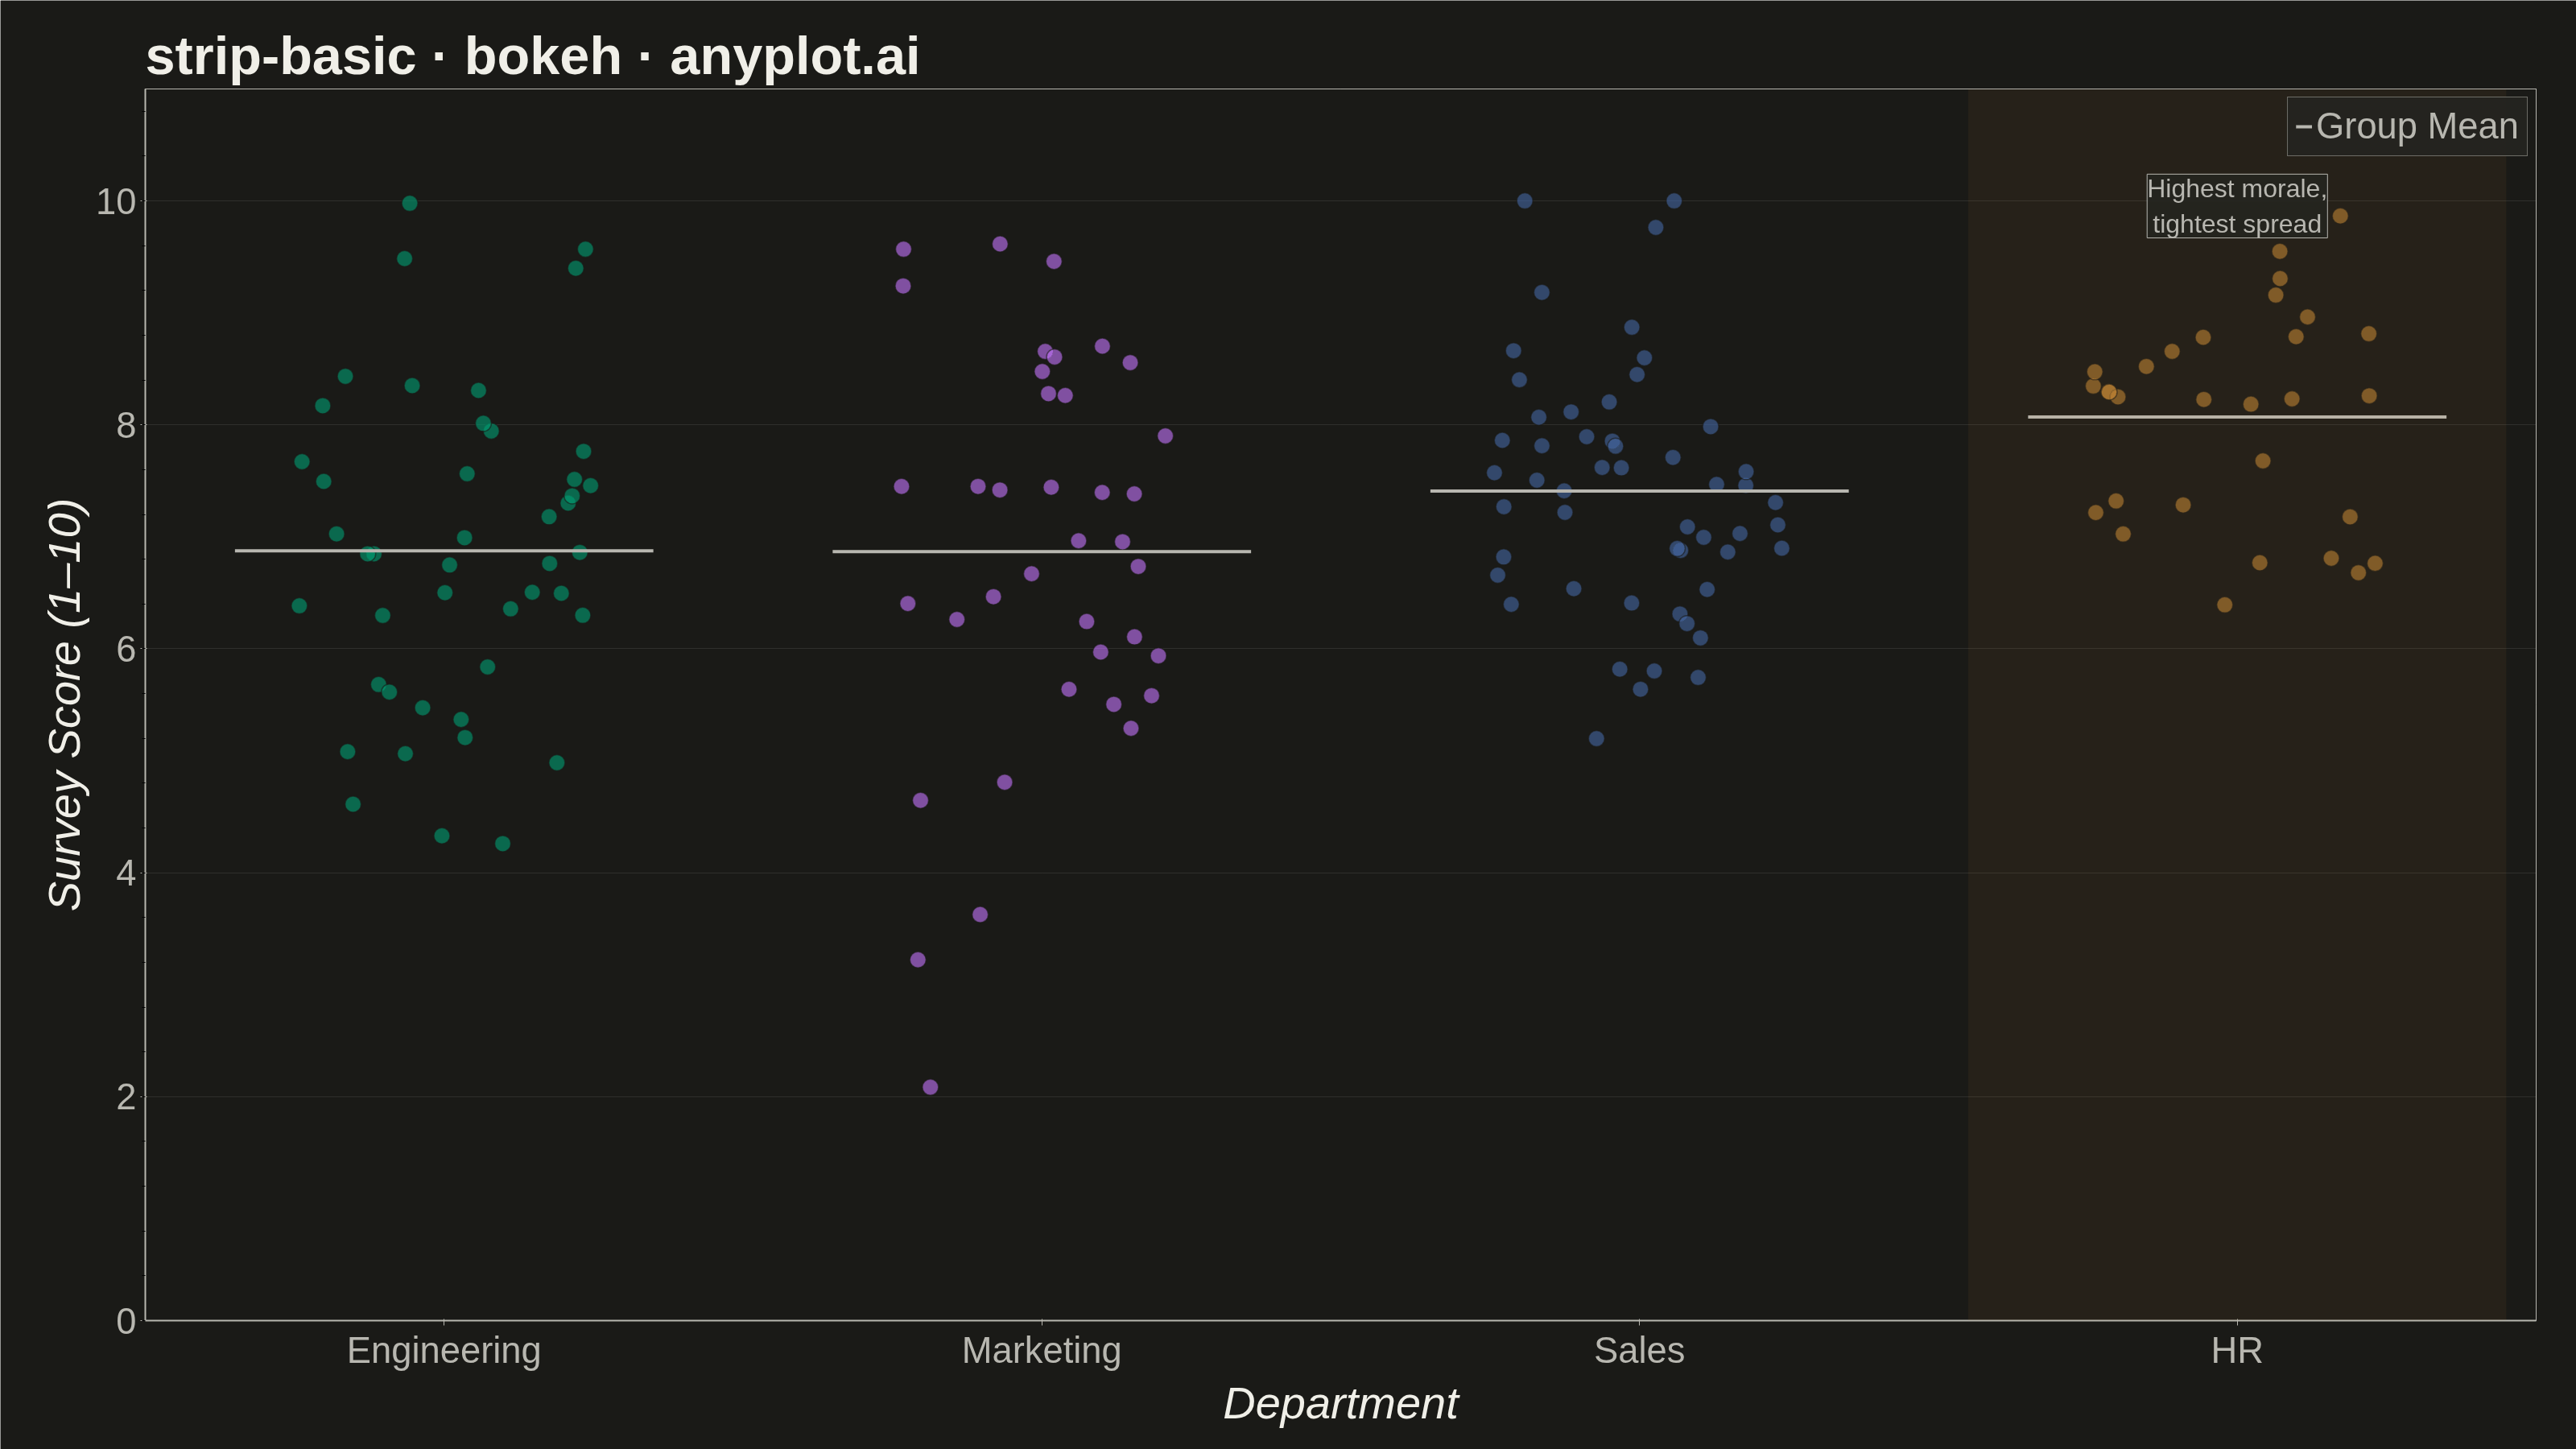
A strip plot displays individual data points for each category along a single axis, with random horizontal jitter applied to reduce overplotting. Unlike box plots or violin plots that show summary statistics, strip plots reveal every observation, making them ideal for small to medium datasets where individual values matter. The random jitter spreads points horizontally within each category to show density through point accumulation.
""" anyplot.ai
strip-basic: Basic Strip Plot
Library: bokeh 3.9.2 | Python 3.13.14
Quality: 94/100 | Updated: 2026-08-05
"""

import os
import time
from pathlib import Path

import numpy as np
from bokeh.io import output_file, save
from bokeh.models import BoxAnnotation, ColumnDataSource, Label
from bokeh.plotting import figure
from selenium import webdriver
from selenium.webdriver.chrome.options import Options


# Theme tokens
THEME = os.getenv("ANYPLOT_THEME", "light")
PAGE_BG = "#FAF8F1" if THEME == "light" else "#1A1A17"
ELEVATED_BG = "#FFFDF6" if THEME == "light" else "#242420"
INK = "#1A1A17" if THEME == "light" else "#F0EFE8"
INK_SOFT = "#4A4A44" if THEME == "light" else "#B8B7B0"

IMPRINT_PALETTE = ["#009E73", "#C475FD", "#4467A3", "#BD8233"]

# Data - Survey response scores by department
np.random.seed(42)

categories = ["Engineering", "Marketing", "Sales", "HR"]
n_per_category = [45, 38, 52, 30]

data = {
    "Engineering": np.clip(np.random.normal(7.2, 1.5, n_per_category[0]), 1, 10),
    "Marketing": np.clip(np.random.normal(6.8, 1.8, n_per_category[1]), 1, 10),
    "Sales": np.clip(np.random.normal(7.5, 1.2, n_per_category[2]), 1, 10),
    "HR": np.clip(np.random.normal(8.0, 1.0, n_per_category[3]), 1, 10),
}

# Build arrays for plotting with jitter
x_values = []
y_values = []
colors = []
color_map = dict(zip(categories, IMPRINT_PALETTE, strict=True))

jitter_width = 0.25

for i, cat in enumerate(categories):
    values = data[cat]
    n = len(values)
    jittered_x = i + np.random.uniform(-jitter_width, jitter_width, n)
    x_values.extend(jittered_x)
    y_values.extend(values)
    colors.extend([color_map[cat]] * n)

source = ColumnDataSource(data={"x": x_values, "y": y_values, "color": colors})

# Plot — 3200x1800 canonical canvas; toolbar disabled (static catalog render)
p = figure(
    width=3200,
    height=1800,
    title="strip-basic · bokeh · anyplot.ai",
    x_axis_label="Department",
    y_axis_label="Survey Score (1–10)",
    x_range=(-0.5, len(categories) - 0.5),
    y_range=(0, 11),
    toolbar_location=None,
    min_border_bottom=160,
    min_border_left=180,
    min_border_top=110,
    min_border_right=50,
)

# Data storytelling emphasis — HR has the highest mean and tightest spread
hr_index = categories.index("HR")
hr_mean = float(np.mean(data["HR"]))
p.add_layout(
    BoxAnnotation(
        left=hr_index - 0.45, right=hr_index + 0.45, fill_color=color_map["HR"], fill_alpha=0.08, line_color=None
    )
)
p.add_layout(
    Label(
        x=hr_index,
        y=hr_mean + 1.6,
        text="Highest morale,\ntightest spread",
        text_align="center",
        text_font_size="24pt",
        text_color=INK_SOFT,
        background_fill_color=ELEVATED_BG,
        background_fill_alpha=0.85,
        border_line_color=INK_SOFT,
    )
)

p.scatter(x="x", y="y", source=source, size=20, color="color", alpha=0.6, line_color=PAGE_BG, line_width=1.5)

# Mean reference lines — one legend entry shared across all categories
for i, cat in enumerate(categories):
    mean_val = float(np.mean(data[cat]))
    legend_kw = {"legend_label": "Group Mean"} if i == 0 else {}
    p.line(x=[i - 0.35, i + 0.35], y=[mean_val, mean_val], line_color=INK_SOFT, line_width=4, **legend_kw)

# Text sizes for 3200x1800 px (bokeh 'pt' strings rendered through headless Chrome)
p.title.text_font_size = "50pt"
p.xaxis.axis_label_text_font_size = "42pt"
p.yaxis.axis_label_text_font_size = "42pt"
p.xaxis.major_label_text_font_size = "34pt"
p.yaxis.major_label_text_font_size = "34pt"

# Categorical tick labels on x-axis
p.xaxis.ticker = list(range(len(categories)))
p.xaxis.major_label_overrides = dict(enumerate(categories))

# Theme-adaptive chrome
p.background_fill_color = PAGE_BG
p.border_fill_color = PAGE_BG
p.outline_line_color = INK_SOFT

p.title.text_color = INK
p.xaxis.axis_label_text_color = INK
p.yaxis.axis_label_text_color = INK
p.xaxis.major_label_text_color = INK_SOFT
p.yaxis.major_label_text_color = INK_SOFT
p.xaxis.axis_line_color = INK_SOFT
p.yaxis.axis_line_color = INK_SOFT
p.xaxis.axis_line_width = 2
p.yaxis.axis_line_width = 2
p.xaxis.major_tick_line_color = INK_SOFT
p.yaxis.major_tick_line_color = INK_SOFT

p.xgrid.grid_line_color = None
p.ygrid.grid_line_color = INK
p.ygrid.grid_line_alpha = 0.10

if p.legend:
    p.legend.background_fill_color = ELEVATED_BG
    p.legend.border_line_color = INK_SOFT
    p.legend.label_text_color = INK_SOFT
    p.legend.label_text_font_size = "34pt"
    p.legend.location = "top_right"

# Save HTML
output_file(f"plot-{THEME}.html")
save(p)

# Screenshot with headless Chrome — window size must match the figure's width/height
W, H = 3200, 1800
opts = Options()
for arg in (
    "--headless=new",
    "--no-sandbox",
    "--disable-dev-shm-usage",
    "--disable-gpu",
    f"--window-size={W},{H}",
    "--hide-scrollbars",
):
    opts.add_argument(arg)
driver = webdriver.Chrome(options=opts)
driver.set_window_size(W, H)
driver.get(f"file://{Path(f'plot-{THEME}.html').resolve()}")
# Headless Chrome's --window-size sets the OUTER window, which still reserves a
# phantom title-bar height even headless — pin the viewport exactly via CDP.
driver.execute_cdp_cmd(
    "Emulation.setDeviceMetricsOverride", {"width": W, "height": H, "deviceScaleFactor": 1, "mobile": False}
)
time.sleep(3)
driver.save_screenshot(f"plot-{THEME}.png")
driver.quit()
Runnable source as JSON, for any HTTP client: https://api.anyplot.ai/specs/strip-basic/bokeh/code. Any spec id and library id listed in llms-full.txt fit the same URL shape; every URL below is complete and callable.
{
  "spec_id": "strip-basic",
  "language": "python",
  "library": "bokeh",
  "page": "https://anyplot.ai/strip-basic/python/bokeh",
  "hub": "https://anyplot.ai/strip-basic",
  "code_json": "https://api.anyplot.ai/specs/strip-basic/bokeh/code",
  "spec_json": "https://api.anyplot.ai/specs/strip-basic",
  "render_light_png": "https://storage.googleapis.com/anyplot-images/plots/strip-basic/python/bokeh/plot-light.png",
  "render_dark_png": "https://storage.googleapis.com/anyplot-images/plots/strip-basic/python/bokeh/plot-dark.png",
  "interactive_light_html": "https://storage.googleapis.com/anyplot-images/plots/strip-basic/python/bokeh/plot-light.html",
  "interactive_dark_html": "https://storage.googleapis.com/anyplot-images/plots/strip-basic/python/bokeh/plot-dark.html",
  "quality_score": 94.0,
  "license": "MIT",
  "guide": "https://anyplot.ai/llms.txt"
}
Part of Basic Strip Plot on anyplot.ai.