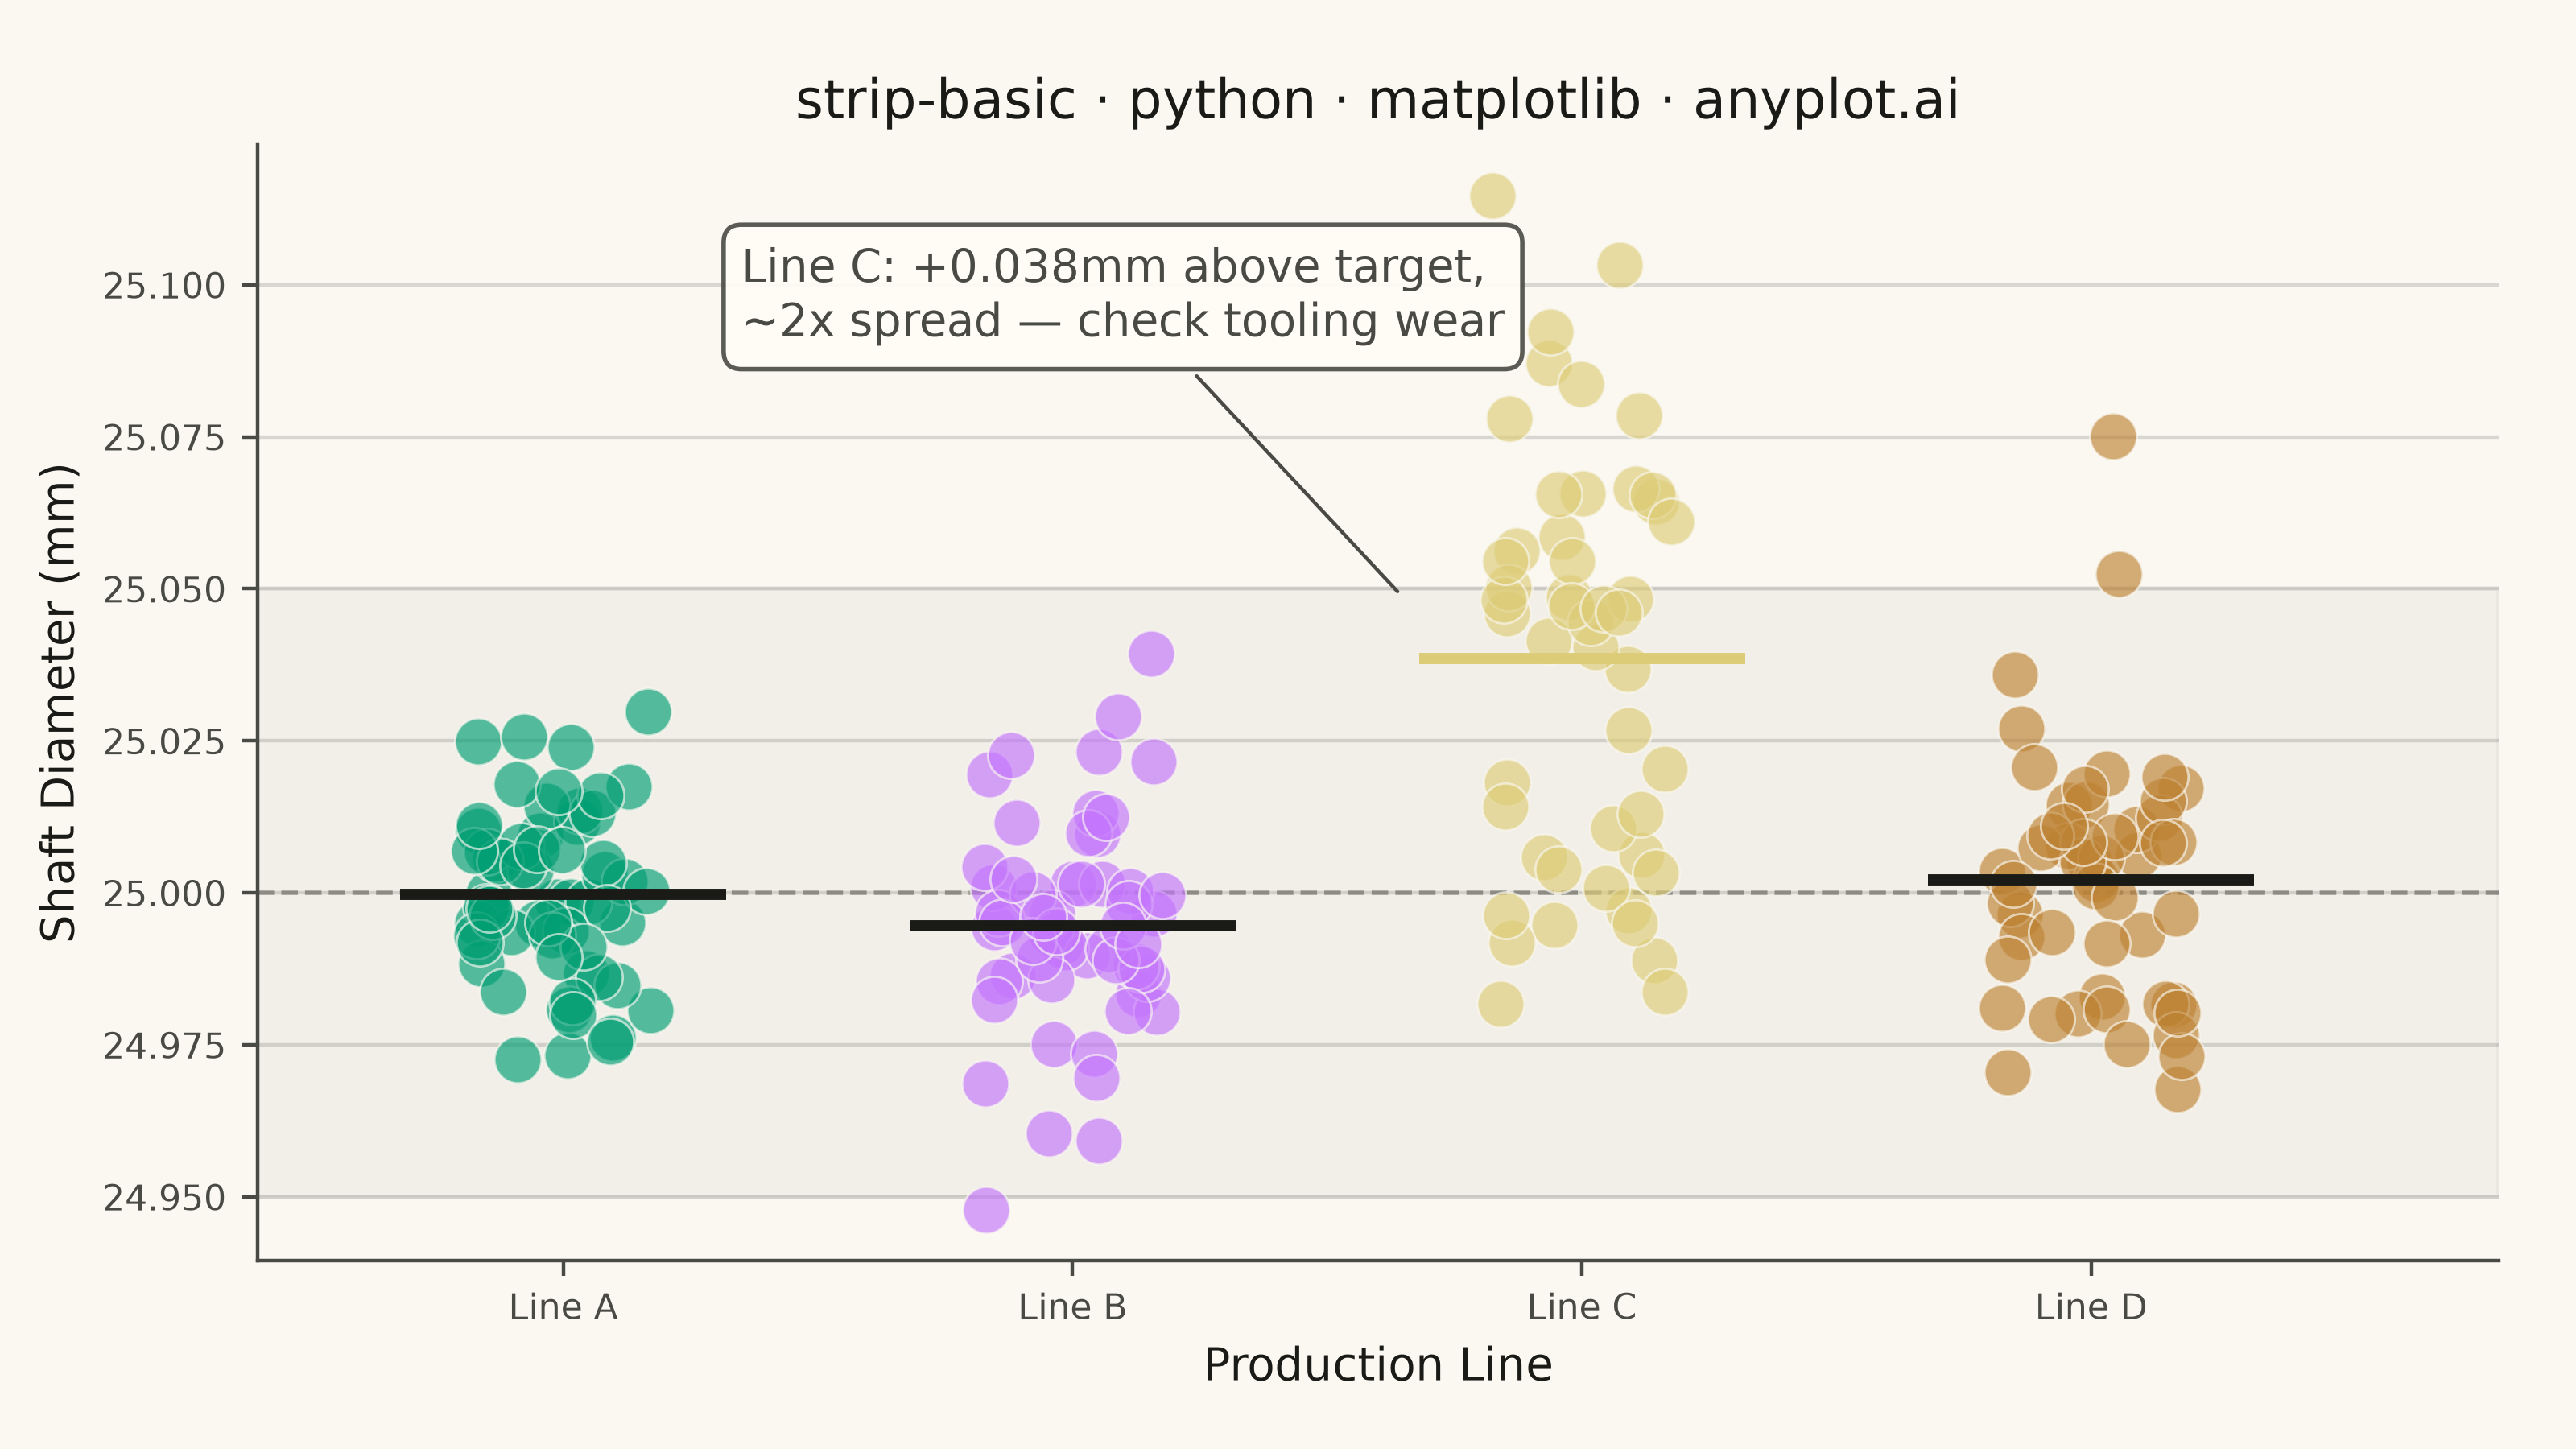
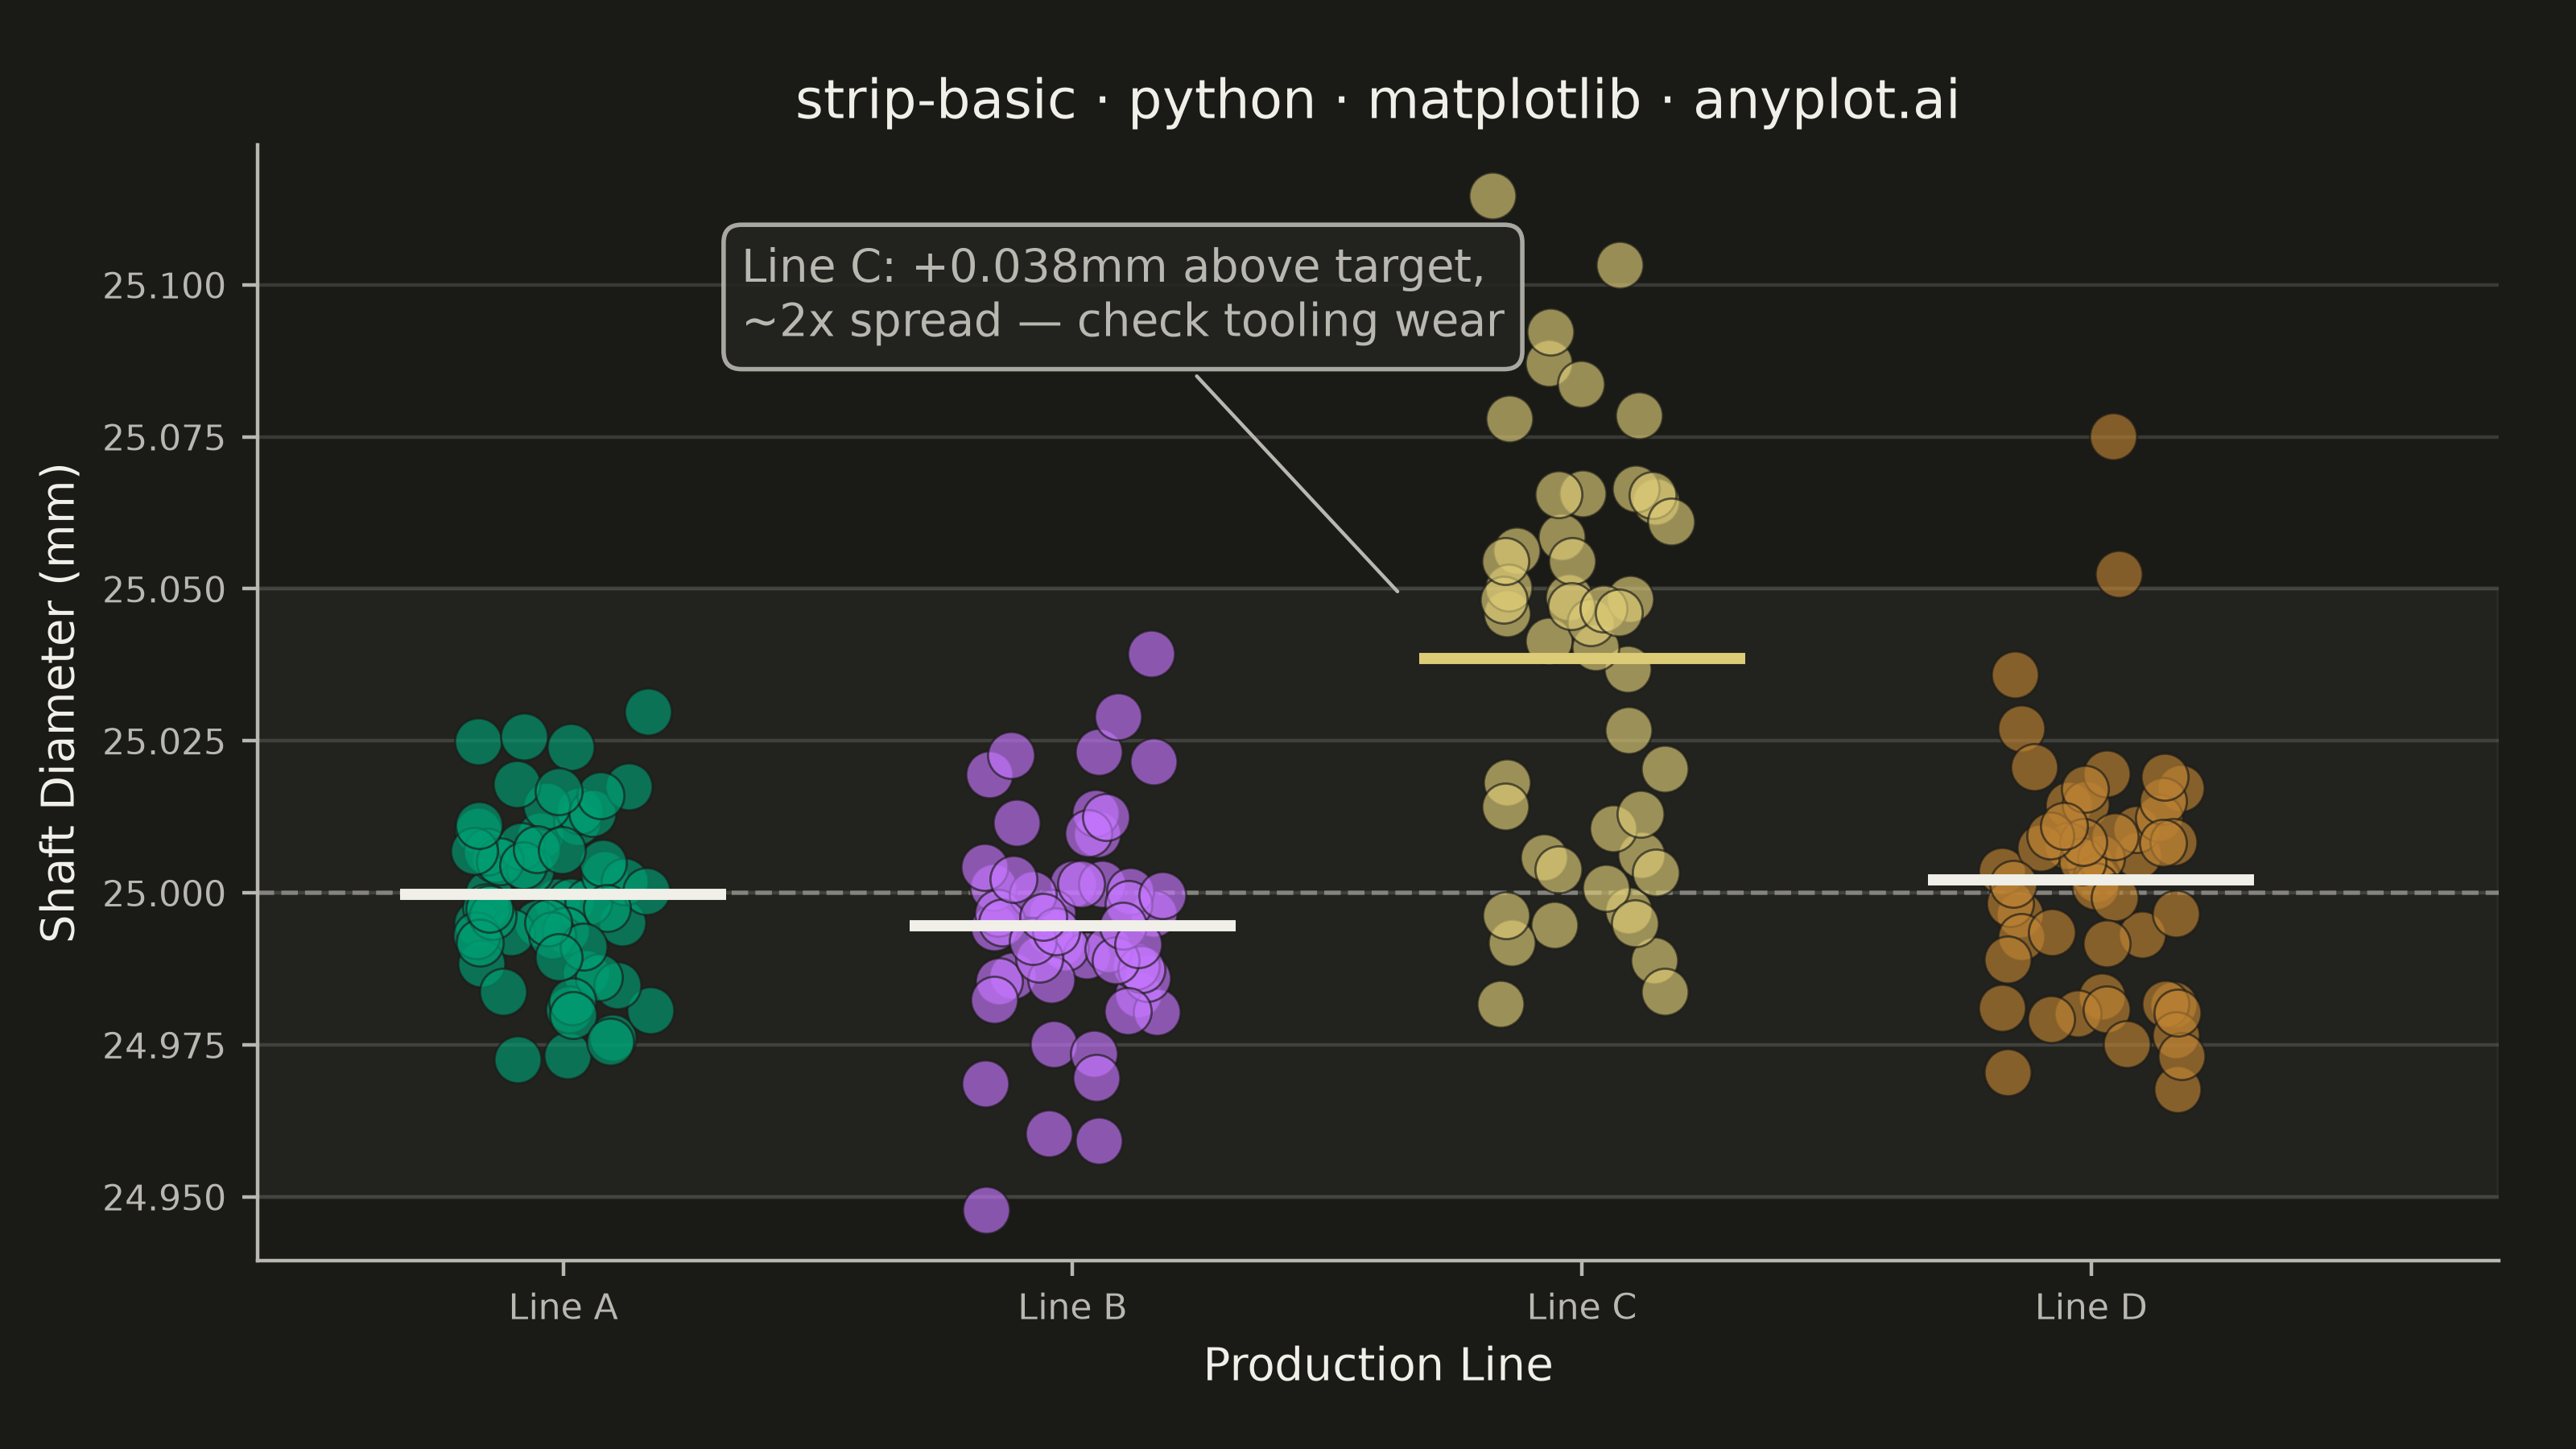
A strip plot displays individual data points for each category along a single axis, with random horizontal jitter applied to reduce overplotting. Unlike box plots or violin plots that show summary statistics, strip plots reveal every observation, making them ideal for small to medium datasets where individual values matter. The random jitter spreads points horizontally within each category to show density through point accumulation.
""" anyplot.ai
strip-basic: Basic Strip Plot
Library: matplotlib 3.11.1 | Python 3.13.14
Quality: 93/100 | Updated: 2026-08-05
"""

import os

import matplotlib.pyplot as plt
import numpy as np


# Theme tokens
THEME = os.getenv("ANYPLOT_THEME", "light")
PAGE_BG = "#FAF8F1" if THEME == "light" else "#1A1A17"
ELEVATED_BG = "#FFFDF6" if THEME == "light" else "#242420"
INK = "#1A1A17" if THEME == "light" else "#F0EFE8"
INK_SOFT = "#4A4A44" if THEME == "light" else "#B8B7B0"
INK_MUTED = "#6B6A63" if THEME == "light" else "#A8A79F"
AMBER = "#DDCC77"  # semantic anchor — warning / caution

IMPRINT_PALETTE = ["#009E73", "#C475FD", "#4467A3", "#BD8233"]

# Data — shaft outer-diameter inspection across four production lines (mm)
# Target 25.000mm +/- 0.050mm tolerance; Line C has drifted high with a wider
# spread, the kind of tooling-wear signal a strip plot is well suited to reveal.
np.random.seed(42)

lines = ["Line A", "Line B", "Line C", "Line D"]
distributions = {
    "Line A": (25.002, 0.015, 60),
    "Line B": (24.995, 0.018, 55),
    "Line C": (25.038, 0.035, 48),
    "Line D": (24.998, 0.020, 52),
}
flagged_line = "Line C"

measurements = {line: np.random.normal(mean, std, n) for line, (mean, std, n) in distributions.items()}

# Plot
fig, ax = plt.subplots(figsize=(8, 4.5), dpi=400, facecolor=PAGE_BG)
ax.set_facecolor(PAGE_BG)

# Tolerance band gives the strip plot a reference frame for "in spec" vs "out of spec"
ax.axhspan(24.95, 25.05, color=INK_MUTED, alpha=0.06, zorder=0)
ax.axhline(25.000, color=INK_MUTED, linewidth=1, linestyle="--", alpha=0.6, zorder=1)

for i, line in enumerate(lines):
    values = measurements[line]
    color = AMBER if line == flagged_line else IMPRINT_PALETTE[i]

    jitter = np.random.uniform(-0.18, 0.18, len(values))
    ax.scatter(i + jitter, values, s=110, alpha=0.65, color=color, edgecolors=PAGE_BG, linewidth=0.5, zorder=3)

    mean_val = values.mean()
    line_color = AMBER if line == flagged_line else INK
    ax.hlines(mean_val, i - 0.32, i + 0.32, colors=line_color, linewidth=2.5, zorder=4)

# Callout on the flagged line — the visual hierarchy the previous review asked for.
# Anchored in the open upper-left region (Lines A/B stay well below 25.06mm) so
# the box never crowds the canvas edge.
flagged_mean = measurements[flagged_line].mean()
flagged_i = lines.index(flagged_line)
ax.annotate(
    f"{flagged_line}: +{flagged_mean - 25.0:.3f}mm above target,\n~2x spread — check tooling wear",
    xy=(flagged_i - 0.35, flagged_mean + 0.01),
    xytext=(0.35, 25.098),
    fontsize=10,
    color=INK_SOFT,
    ha="left",
    va="center",
    arrowprops={"arrowstyle": "-", "color": INK_SOFT, "linewidth": 0.8},
    bbox={"facecolor": ELEVATED_BG, "edgecolor": INK_SOFT, "alpha": 0.9, "boxstyle": "round,pad=0.4"},
)

# Style
ax.set_xticks(range(len(lines)))
ax.set_xticklabels(lines)
ax.set_xlabel("Production Line", fontsize=10, color=INK)
ax.set_ylabel("Shaft Diameter (mm)", fontsize=10, color=INK)
ax.set_title("strip-basic · python · matplotlib · anyplot.ai", fontsize=12, fontweight="medium", color=INK)
ax.tick_params(axis="both", labelsize=8, colors=INK_SOFT, labelcolor=INK_SOFT)
ax.set_xlim(-0.6, len(lines) - 0.2)
ax.yaxis.grid(True, alpha=0.15, linewidth=0.8, color=INK)

ax.spines["top"].set_visible(False)
ax.spines["right"].set_visible(False)
for spine in ("left", "bottom"):
    ax.spines[spine].set_color(INK_SOFT)

fig.subplots_adjust(left=0.1, right=0.97, top=0.9, bottom=0.13)
plt.savefig(f"plot-{THEME}.png", dpi=400, facecolor=PAGE_BG)
Runnable source as JSON, for any HTTP client: https://api.anyplot.ai/specs/strip-basic/matplotlib/code. Any spec id and library id listed in llms-full.txt fit the same URL shape; every URL below is complete and callable.
{
  "spec_id": "strip-basic",
  "language": "python",
  "library": "matplotlib",
  "page": "https://anyplot.ai/strip-basic/python/matplotlib",
  "hub": "https://anyplot.ai/strip-basic",
  "code_json": "https://api.anyplot.ai/specs/strip-basic/matplotlib/code",
  "spec_json": "https://api.anyplot.ai/specs/strip-basic",
  "render_light_png": "https://storage.googleapis.com/anyplot-images/plots/strip-basic/python/matplotlib/plot-light.png",
  "render_dark_png": "https://storage.googleapis.com/anyplot-images/plots/strip-basic/python/matplotlib/plot-dark.png",
  "quality_score": 93.0,
  "license": "MIT",
  "guide": "https://anyplot.ai/llms.txt"
}
Part of Basic Strip Plot on anyplot.ai.