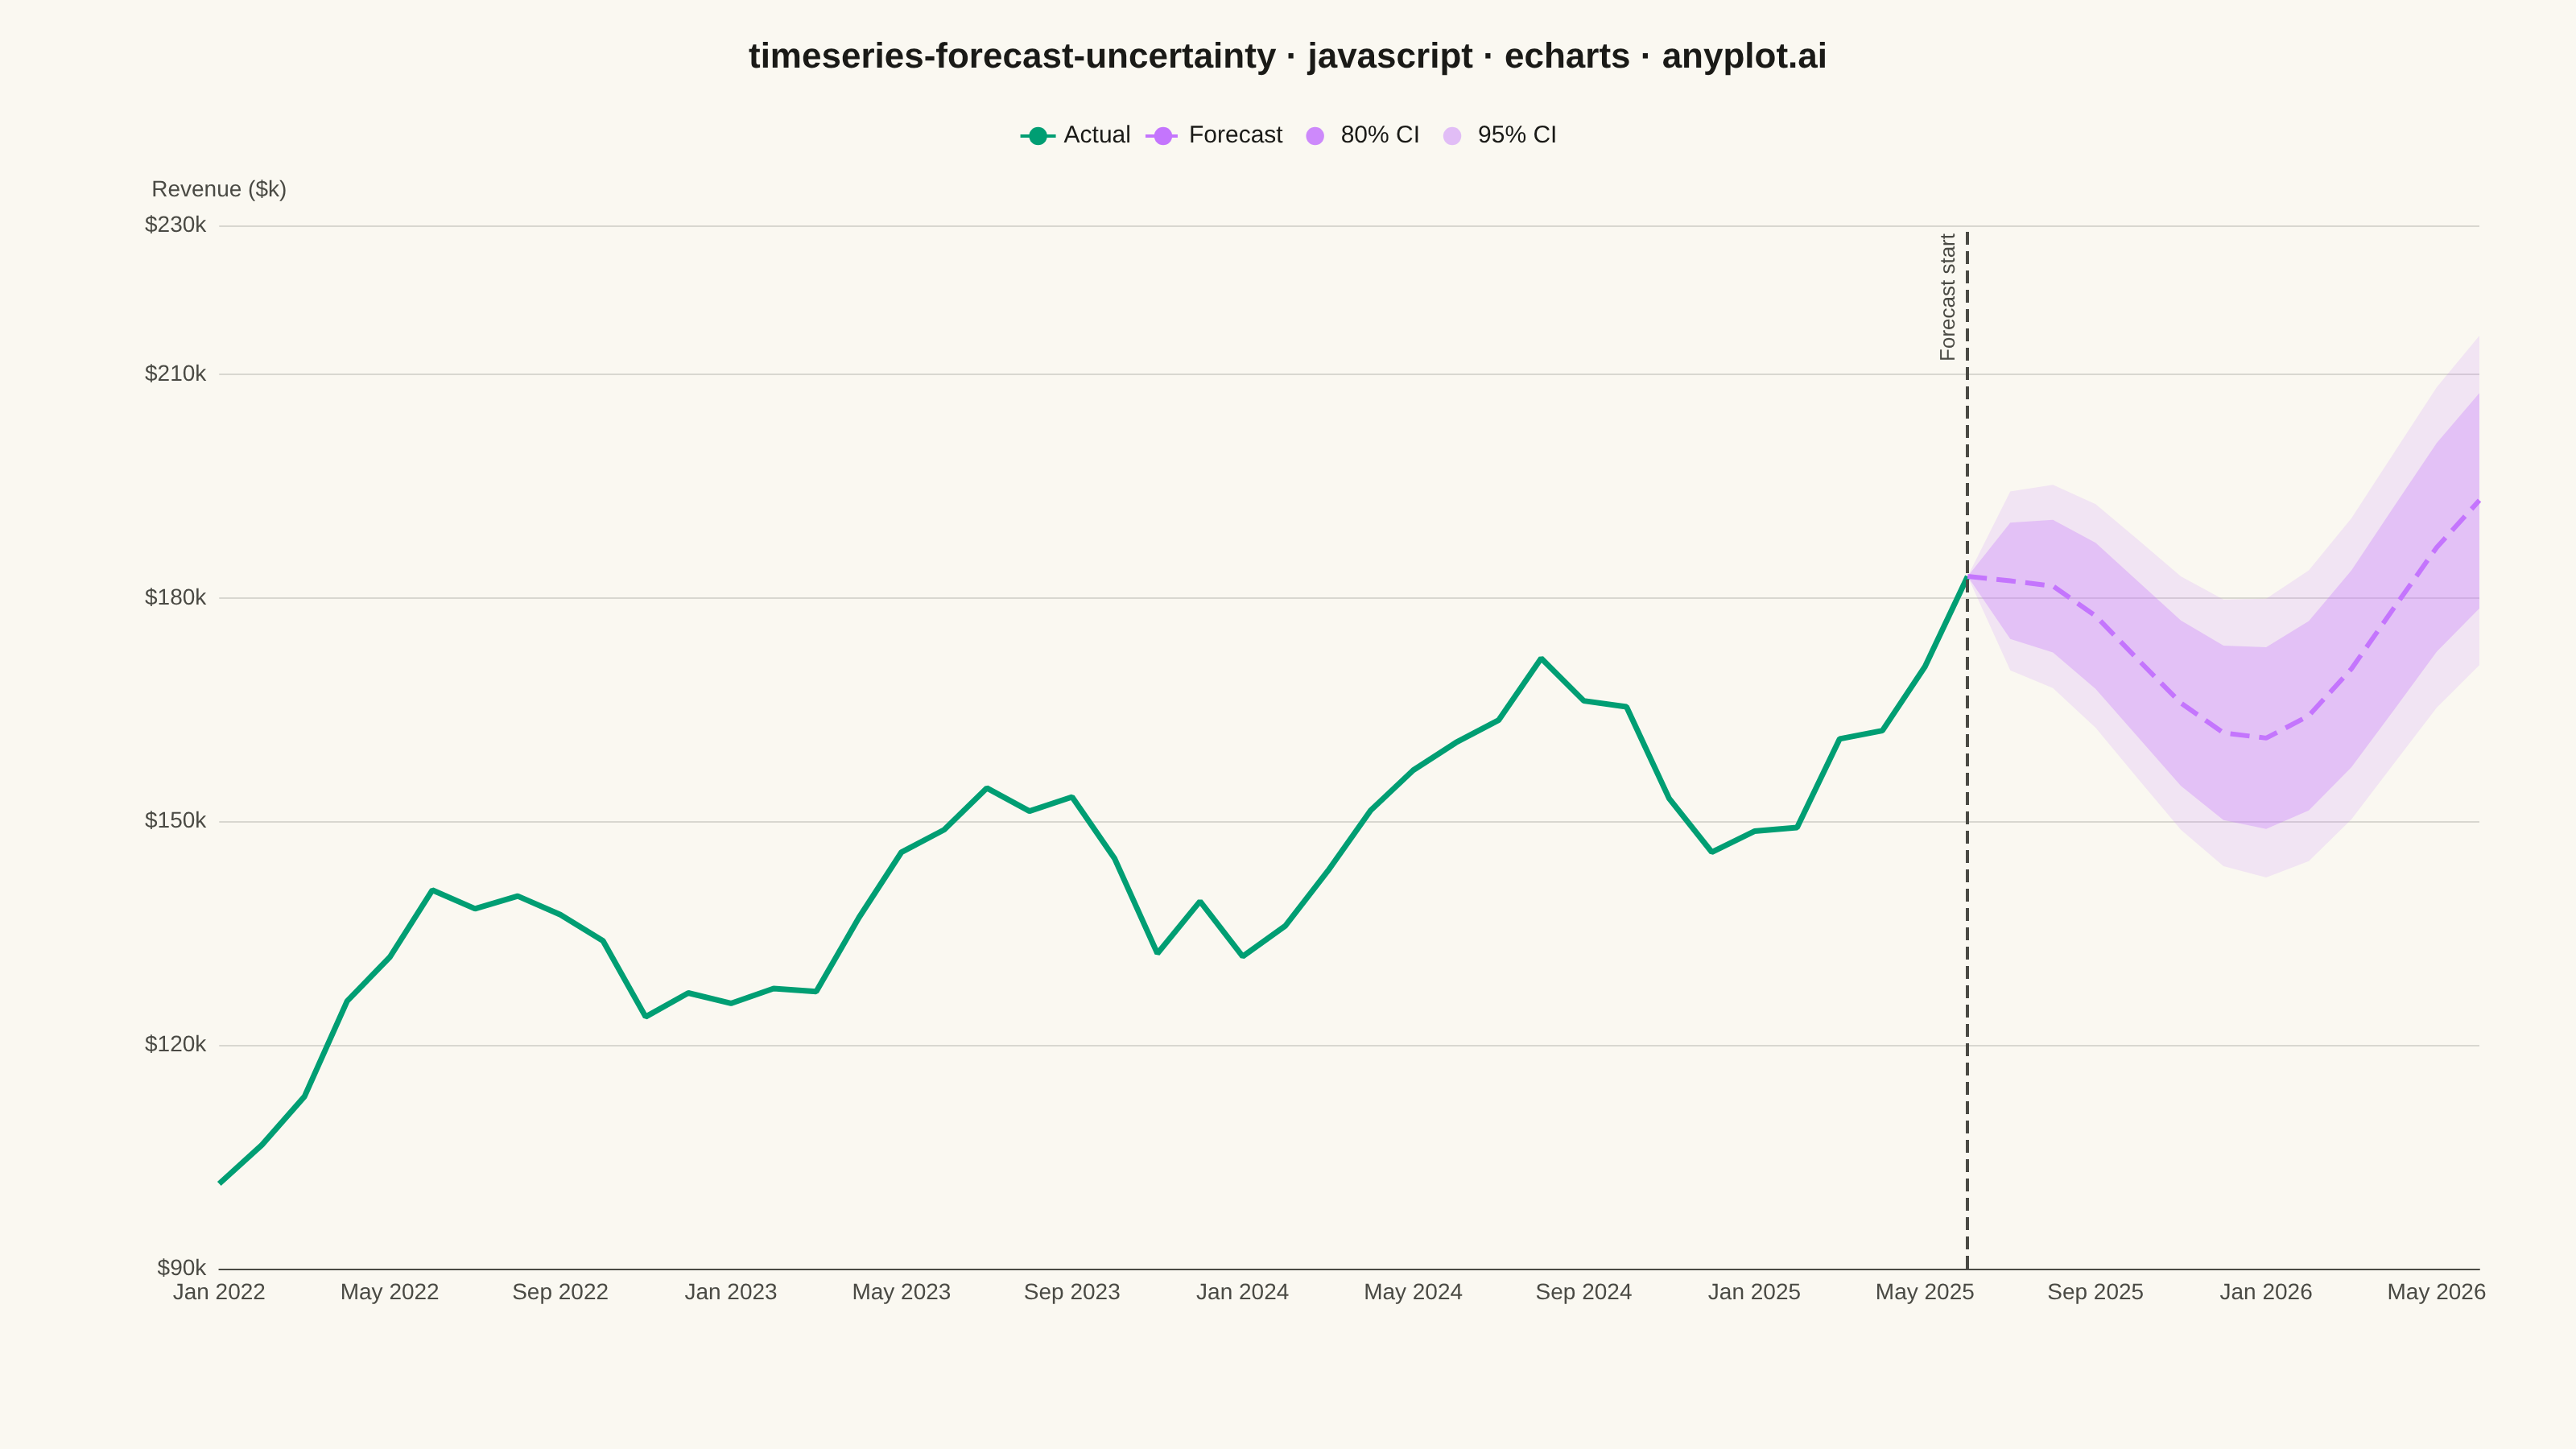
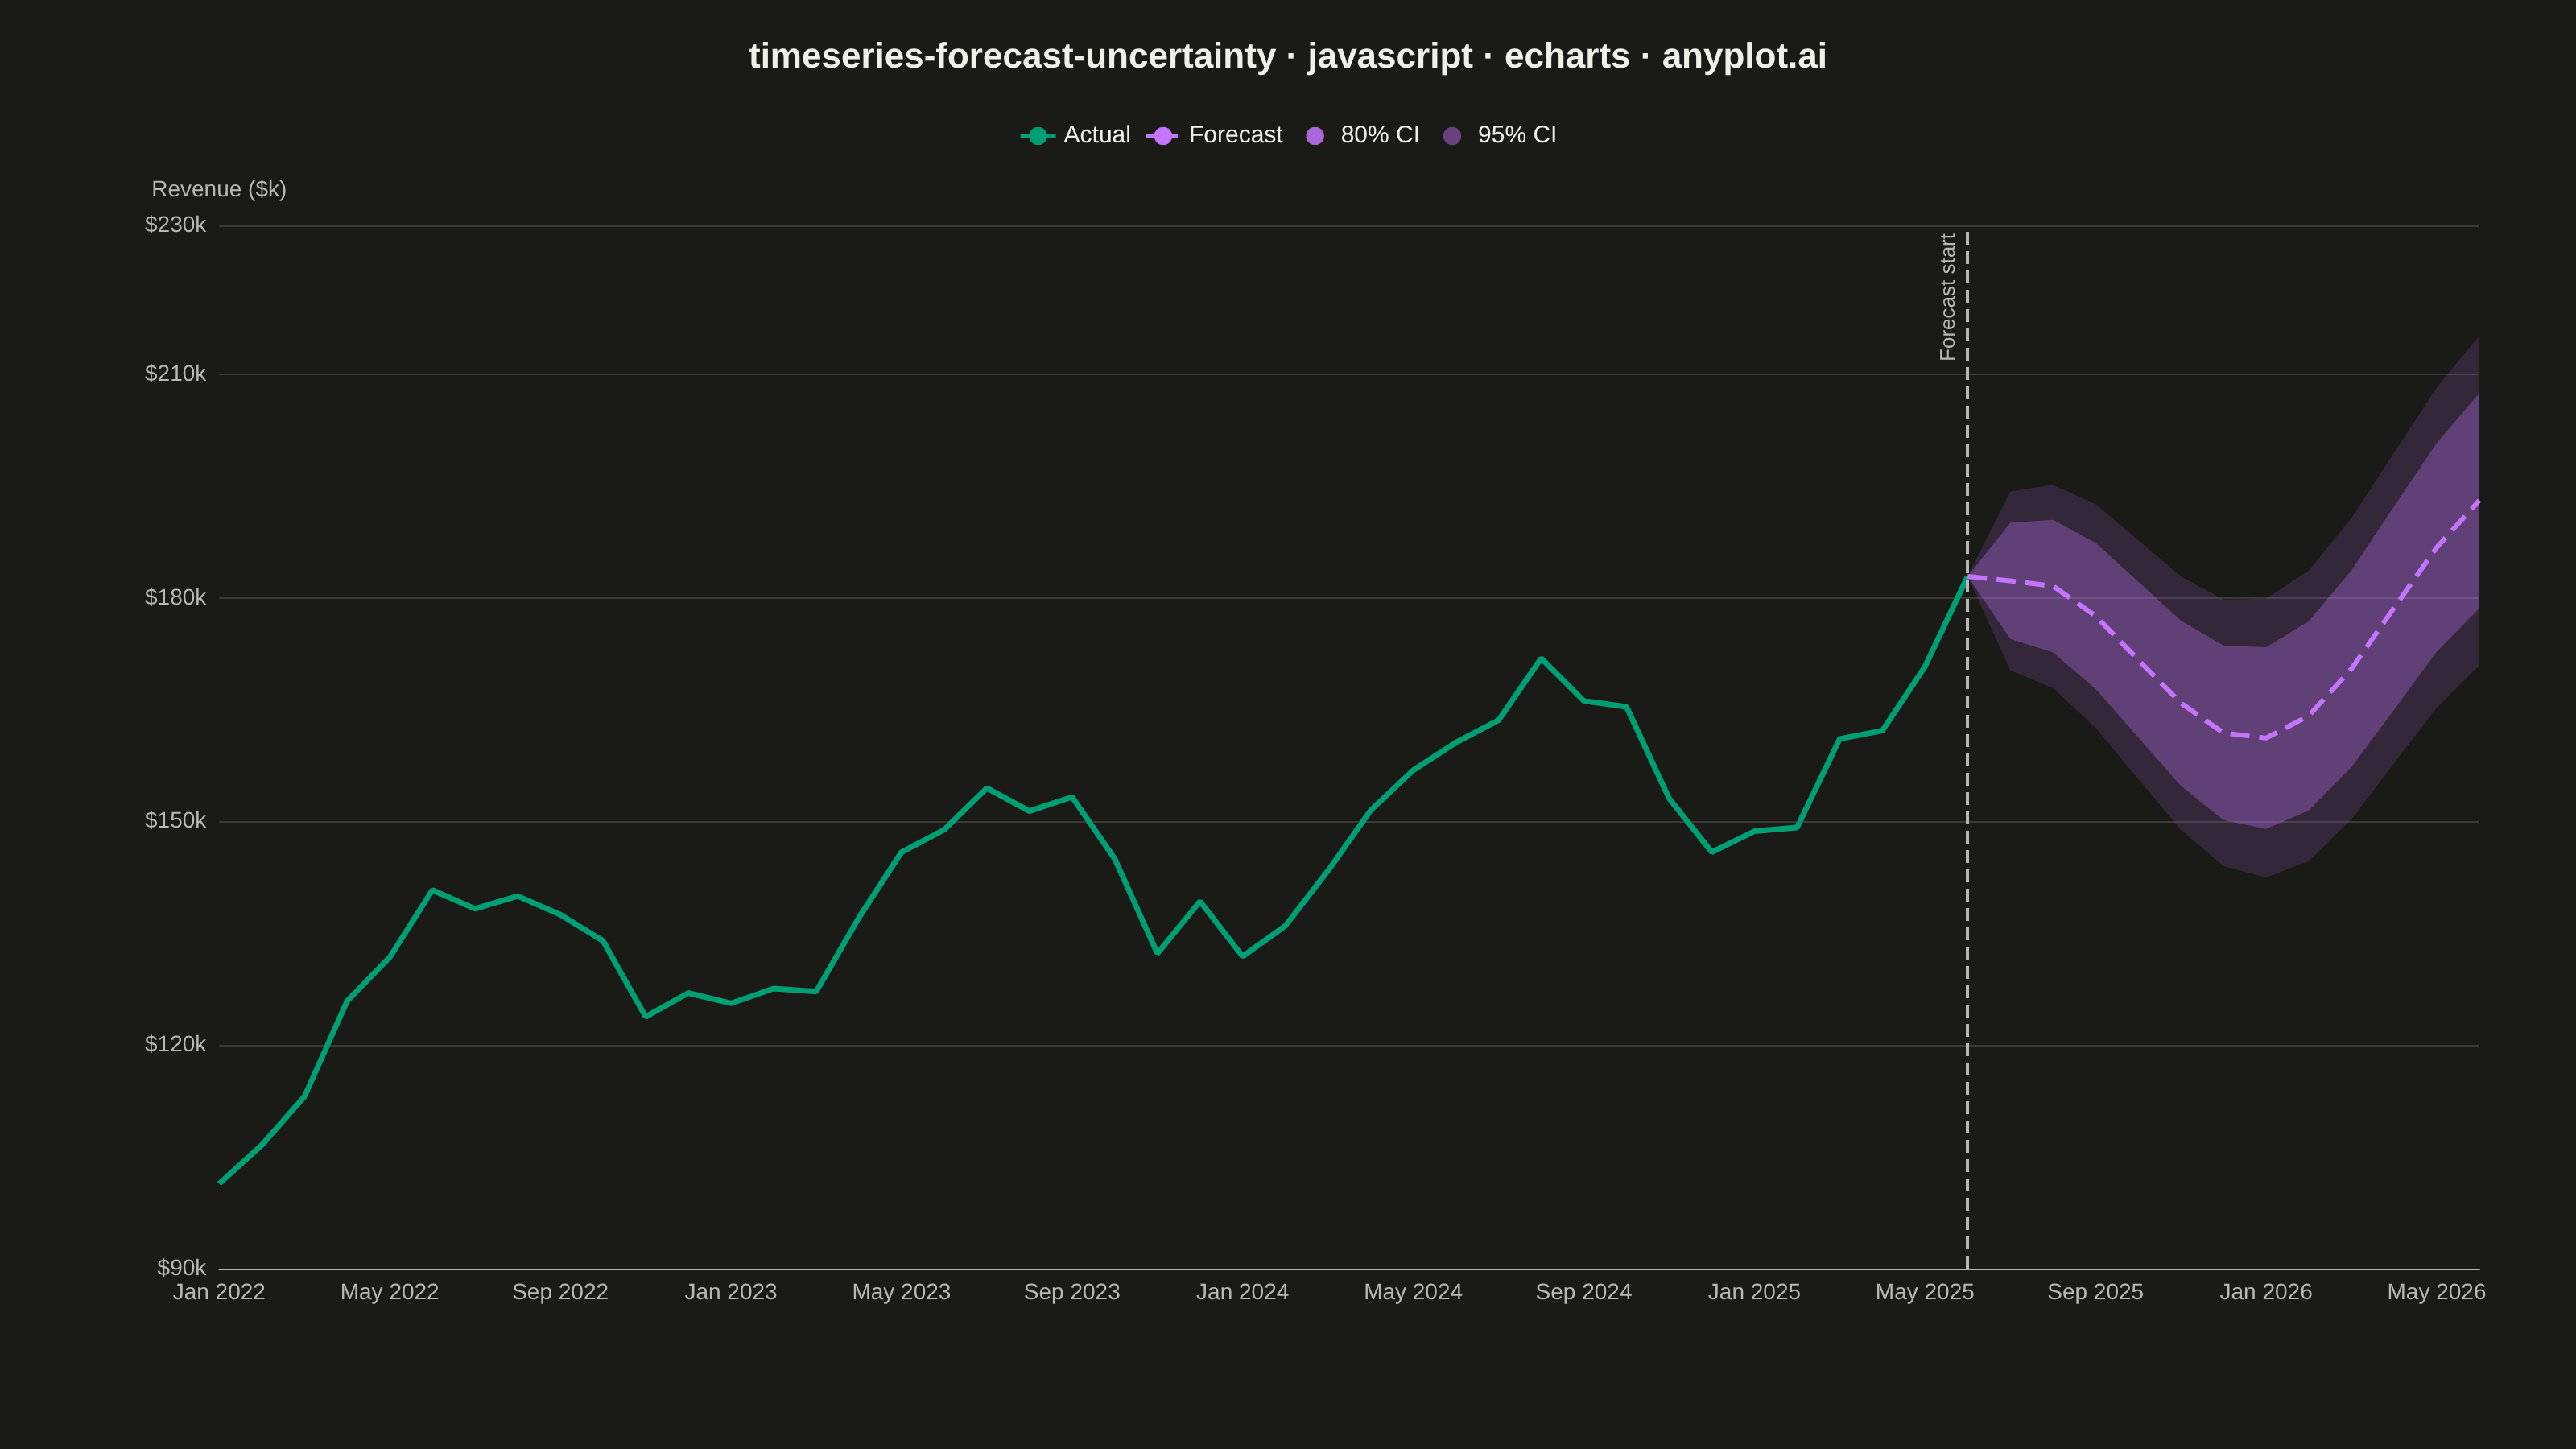
A time series plot that displays historical observed data followed by a forecast projection with confidence intervals or uncertainty bands. The plot clearly distinguishes between the historical period and the forecast period using a vertical line marker, with shaded bands representing different confidence levels (typically 80% and 95%). This visualization is essential for communicating prediction uncertainty in forecasting applications, helping stakeholders understand both the expected values and the range of possible outcomes.
Preview render from the Apache ECharts implementation.