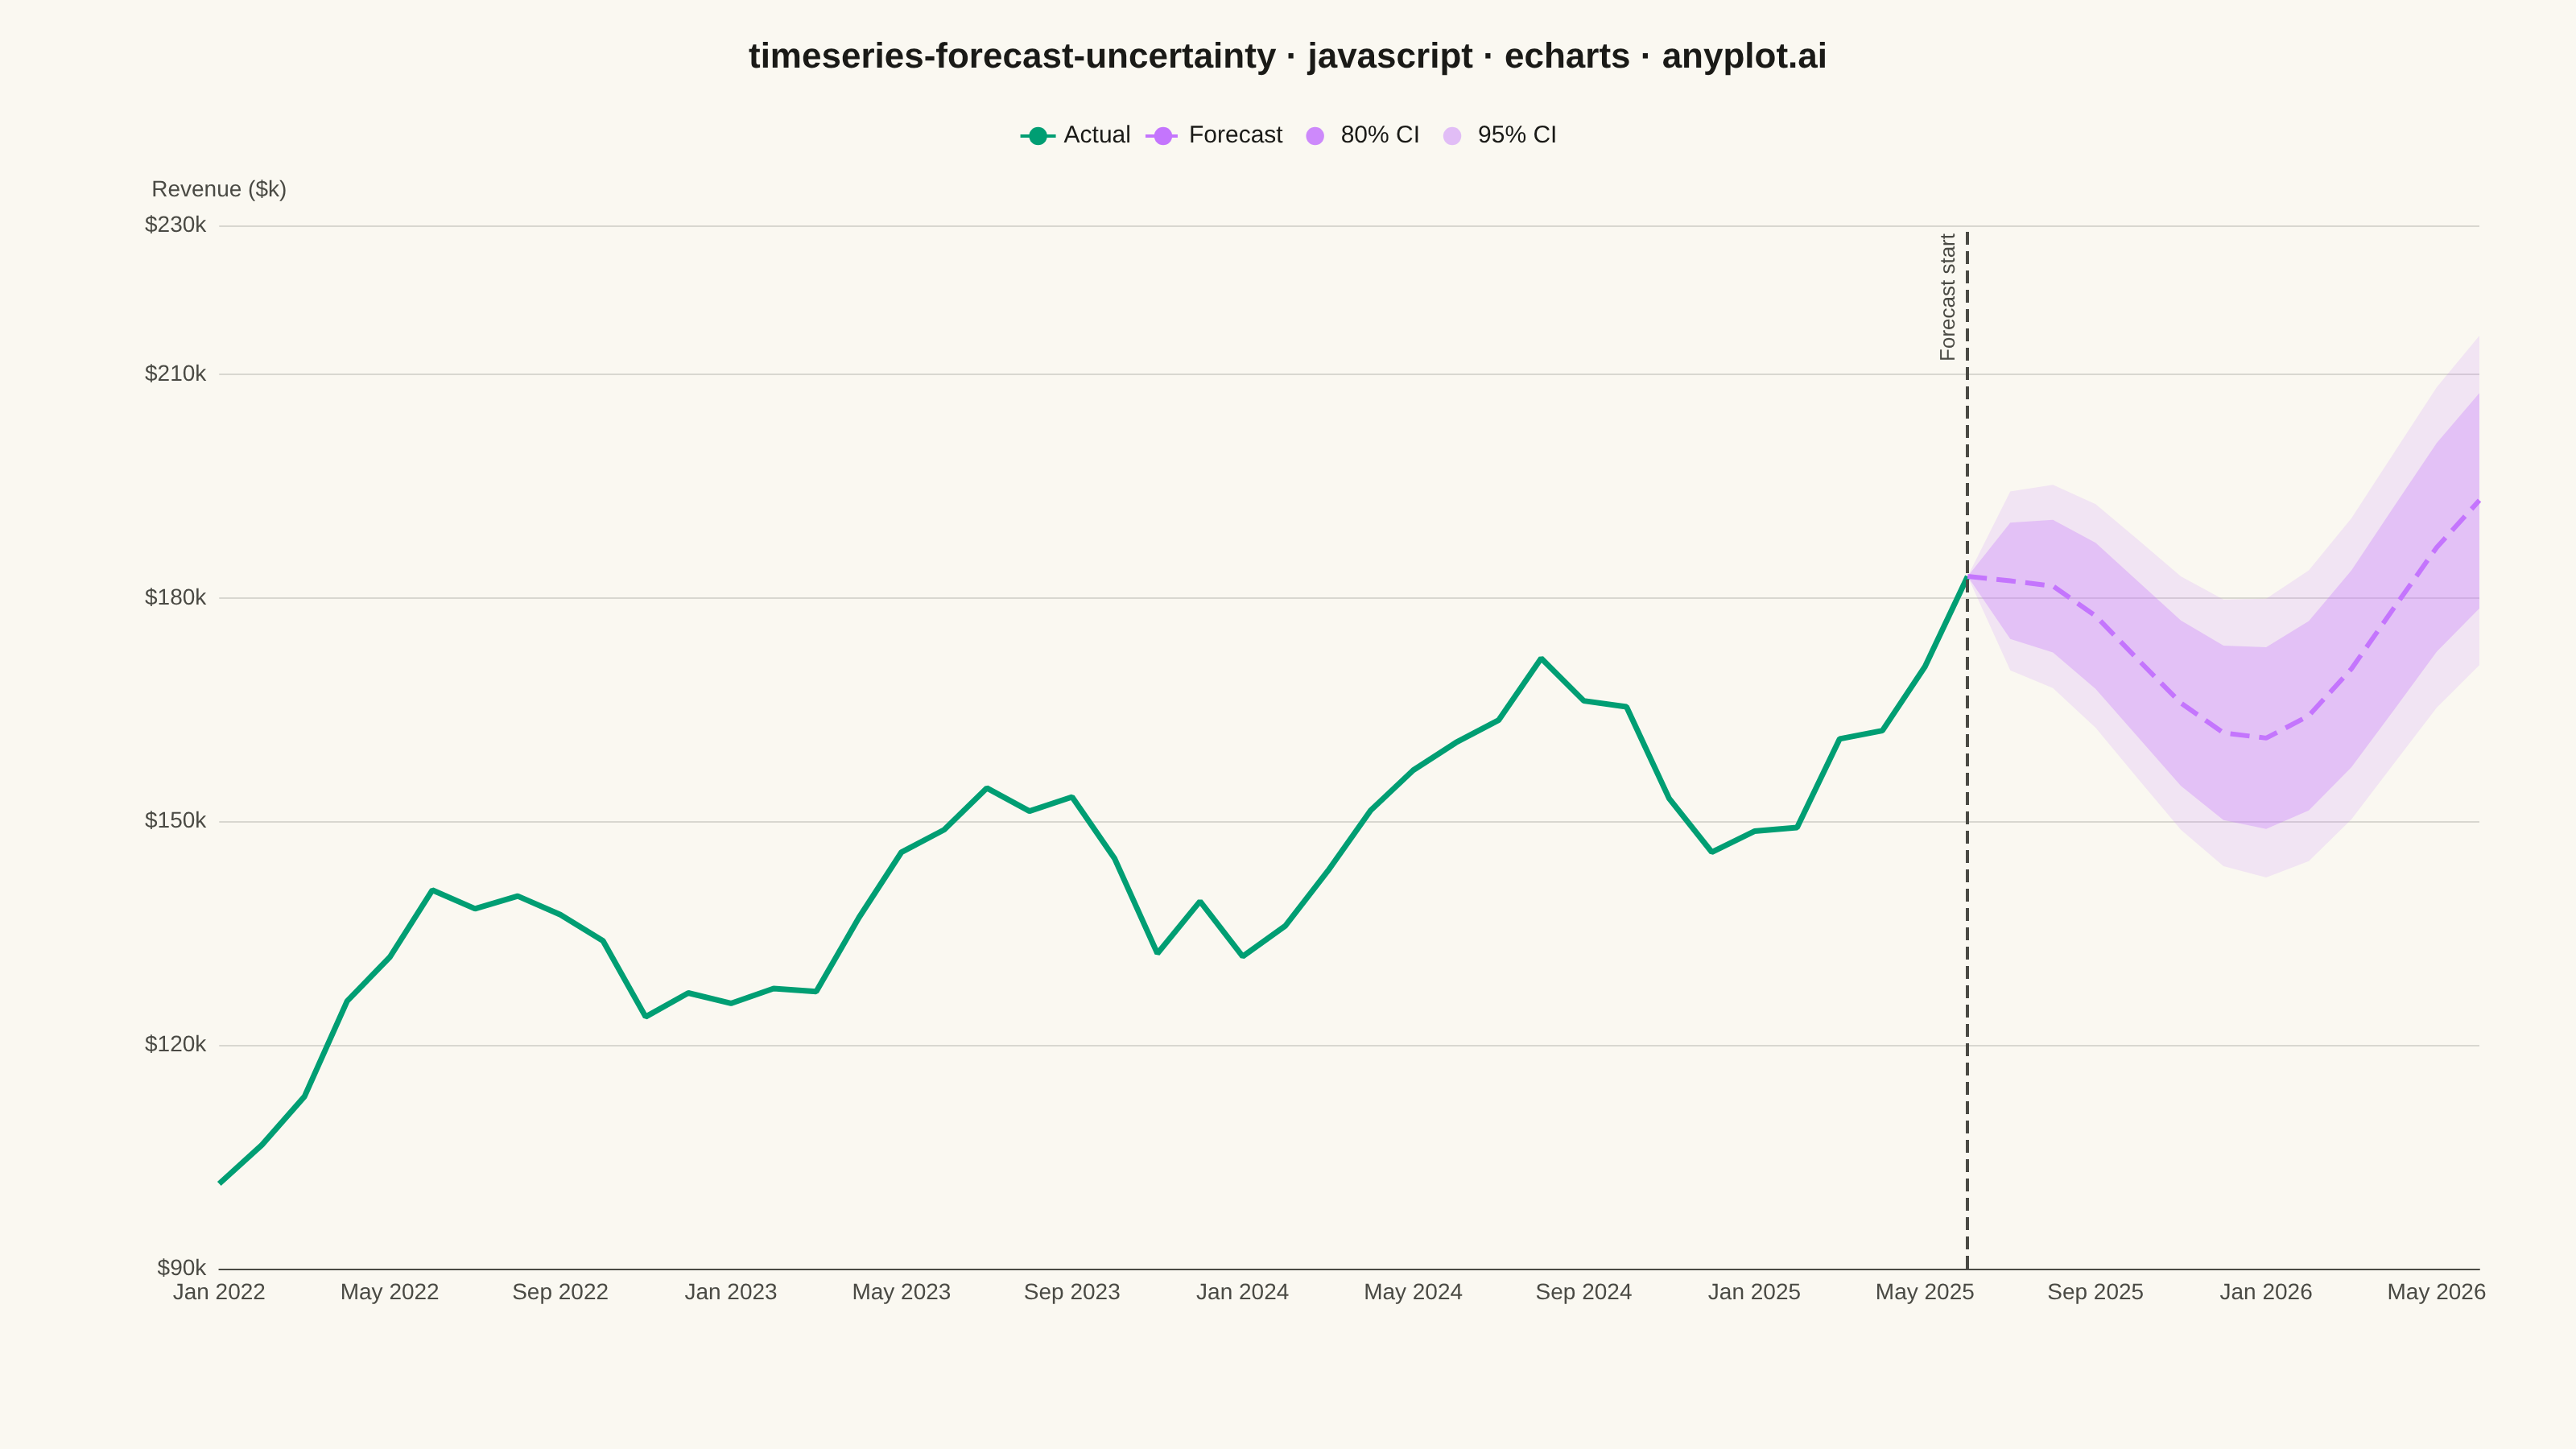
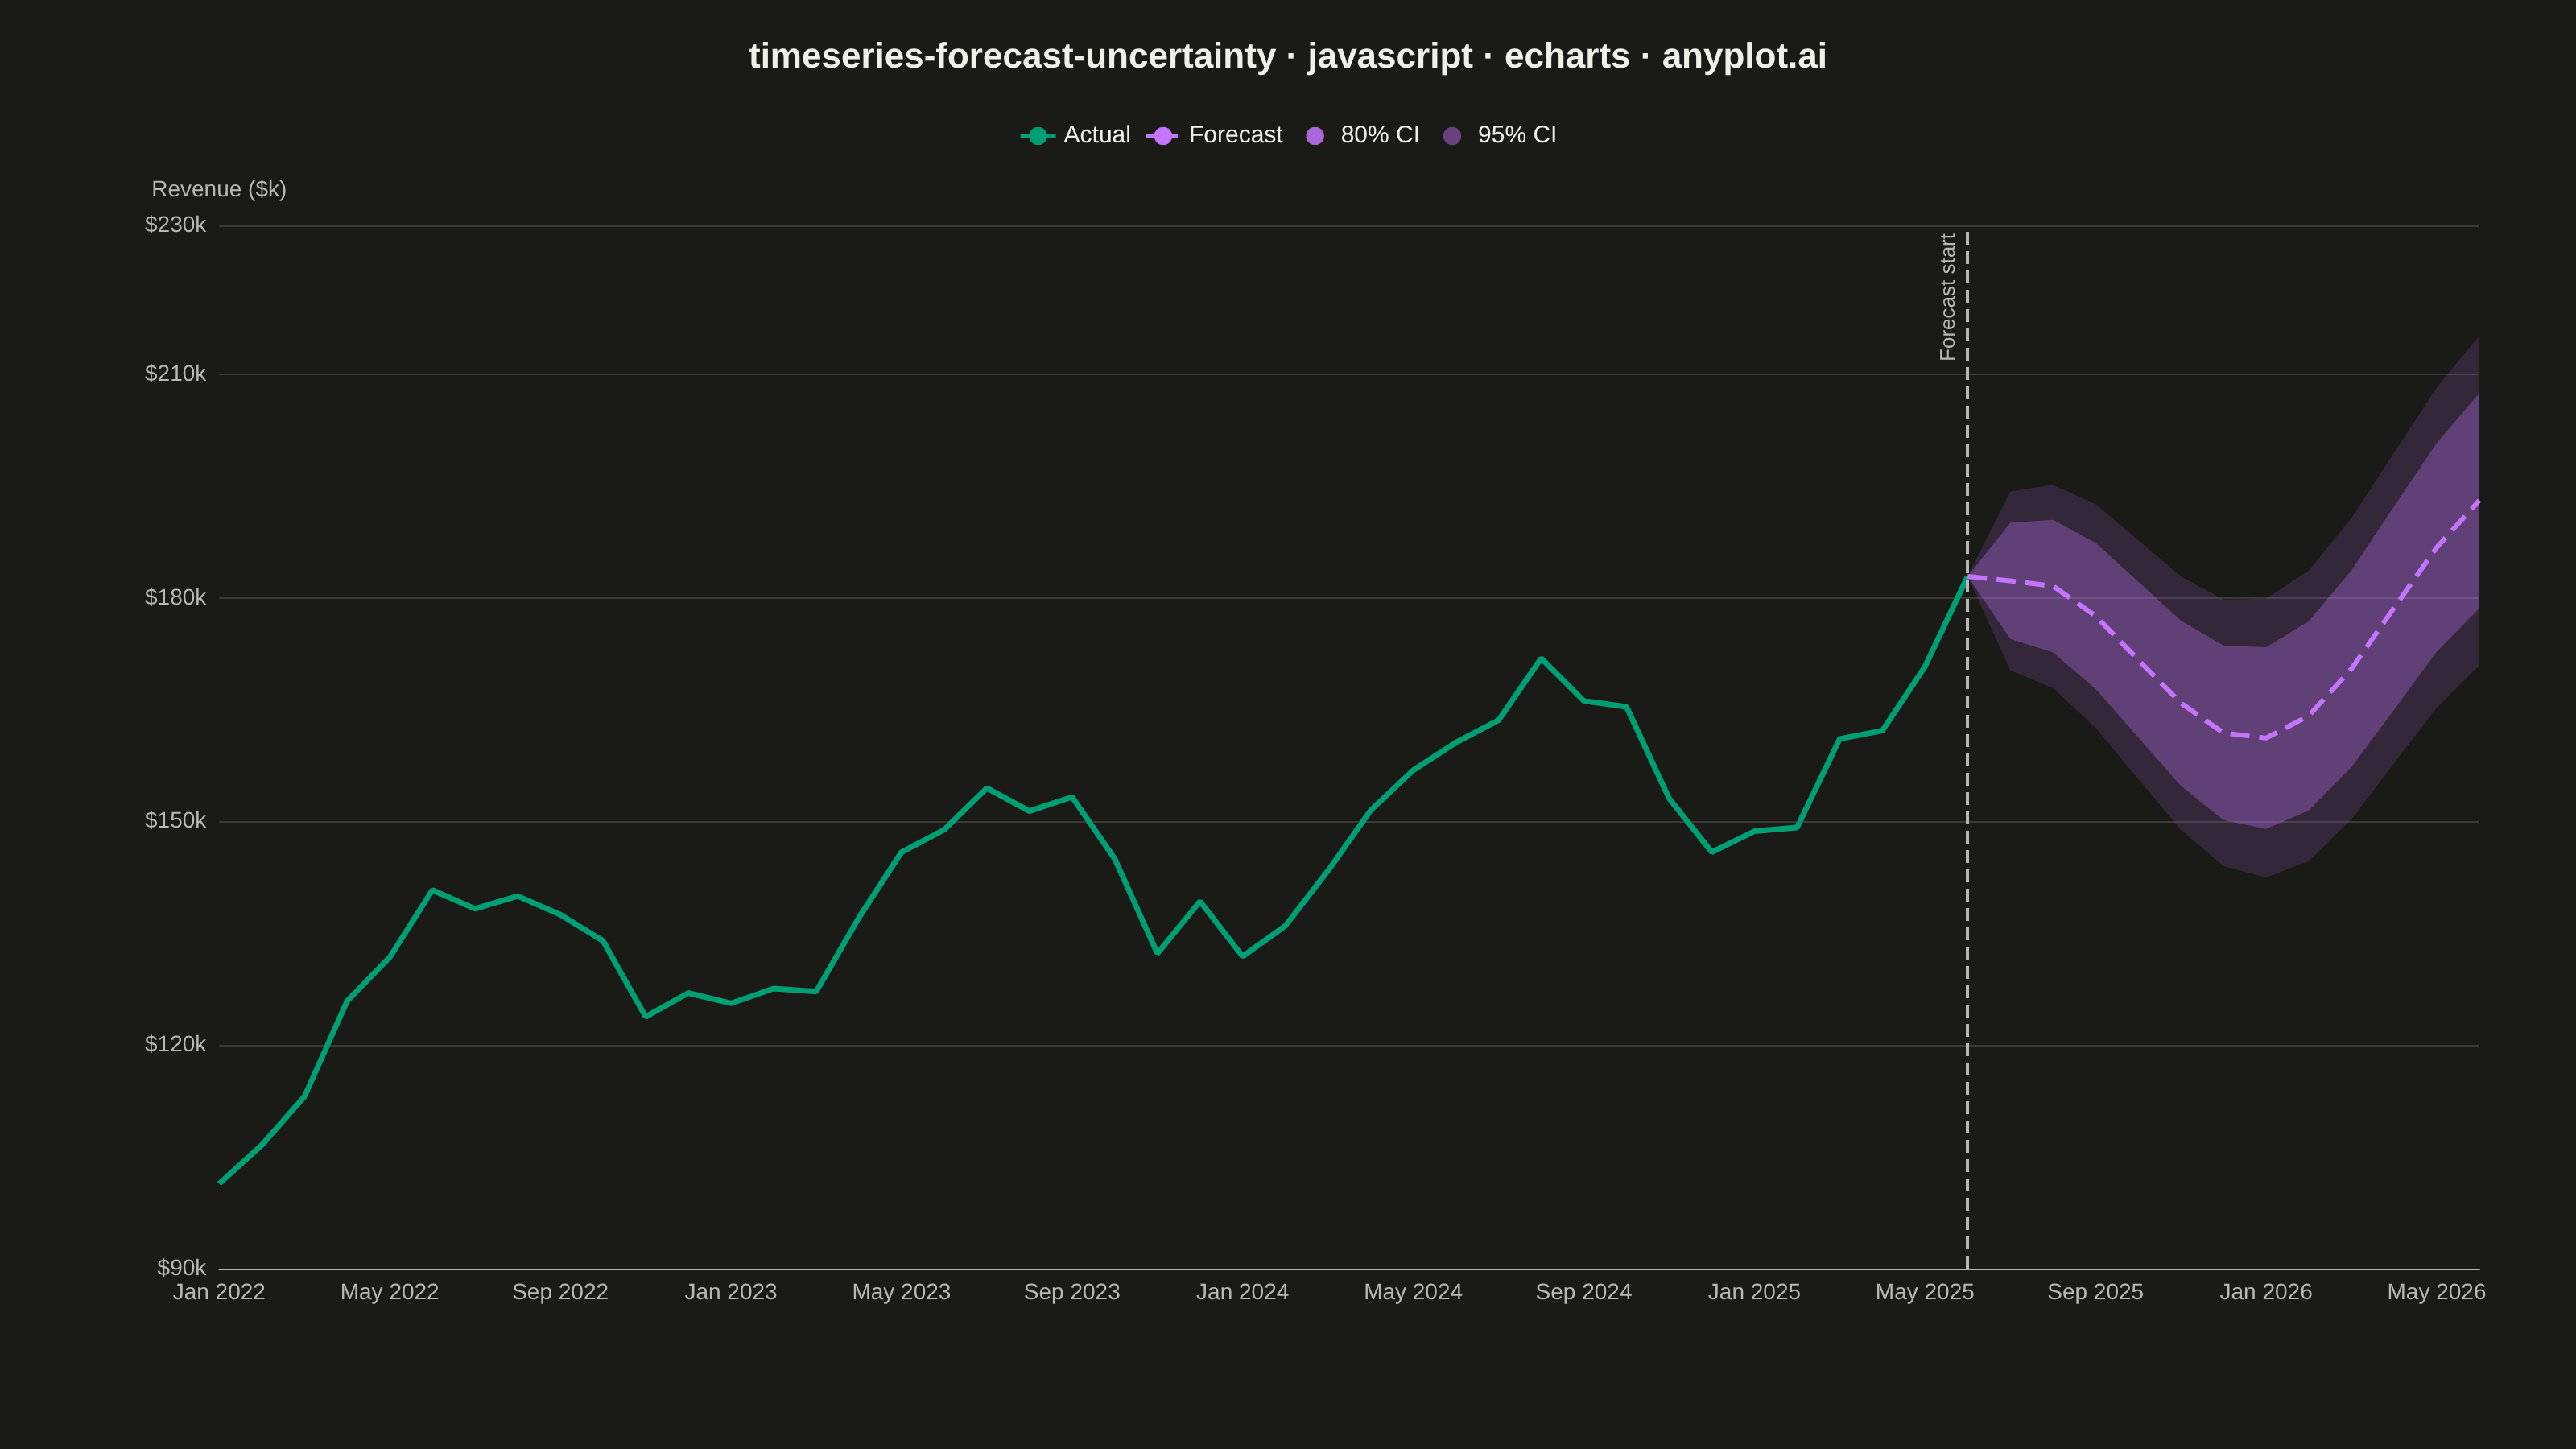
The same plot in 14 other libraries — JavaScript: Chart.js, D3.js, Highcharts, MUI X Charts; Python: Altair, Bokeh, lets-plot, Matplotlib, Plotly, plotnine, Pygal, Seaborn; R: ggplot2; Julia: Makie.jl. Compare all 15 side by side: Time Series Forecast with Uncertainty Band in Python, R, Julia and JavaScript.
A time series plot that displays historical observed data followed by a forecast projection with confidence intervals or uncertainty bands. The plot clearly distinguishes between the historical period and the forecast period using a vertical line marker, with shaded bands representing different confidence levels (typically 80% and 95%). This visualization is essential for communicating prediction uncertainty in forecasting applications, helping stakeholders understand both the expected values and the range of possible outcomes.
// anyplot.ai
// timeseries-forecast-uncertainty: Time Series Forecast with Uncertainty Band
// Library: echarts 6.1.0 | JavaScript 22.23.2
// Quality: 93/100 | Created: 2026-09-02

const t = window.ANYPLOT_TOKENS;

// --- Data (in-memory, deterministic monthly SaaS revenue forecast) ---------
// Tiny LCG so the "random" noise is reproducible without a browser RNG.
let seed = 42;
const lcg = () => {
  seed = (seed * 1103515245 + 12345) % 2147483648;
  return seed / 2147483648;
};
const gaussian = (std) => {
  const u1 = 1 - lcg();
  const u2 = lcg();
  return std * Math.sqrt(-2 * Math.log(u1)) * Math.cos(2 * Math.PI * u2);
};

const MONTH_NAMES = ["Jan", "Feb", "Mar", "Apr", "May", "Jun",
                      "Jul", "Aug", "Sep", "Oct", "Nov", "Dec"];
const HIST_MONTHS = 42;   // 3.5 years of history
const FCST_MONTHS = 12;   // 1 year forecast
const TOTAL_MONTHS = HIST_MONTHS + FCST_MONTHS;
const START_YEAR = 2022;
const START_MONTH = 0; // January

const categories = [];
for (let i = 0; i < TOTAL_MONTHS; i++) {
  const monthIndex = (START_MONTH + i) % 12;
  const year = START_YEAR + Math.floor((START_MONTH + i) / 12);
  categories.push(`${MONTH_NAMES[monthIndex]} ${year}`);
}

// Underlying model: linear growth + yearly seasonality
const trendAt = (i) => 120 + i * 1.15;
const seasonalityAt = (i) => 14 * Math.sin((2 * Math.PI * i) / 12 - Math.PI / 2);

const actual = new Array(TOTAL_MONTHS).fill(null);
const forecast = new Array(TOTAL_MONTHS).fill(null);
const lower80 = new Array(TOTAL_MONTHS).fill(null);
const upper80 = new Array(TOTAL_MONTHS).fill(null);
const lower95 = new Array(TOTAL_MONTHS).fill(null);
const upper95 = new Array(TOTAL_MONTHS).fill(null);

let lastHistoricalValue = 0;
for (let i = 0; i < HIST_MONTHS; i++) {
  const value = trendAt(i) + seasonalityAt(i) + gaussian(3.5);
  actual[i] = Math.round(value * 10) / 10;
  lastHistoricalValue = actual[i];
}

// Forecast continues the model; uncertainty widens with the horizon.
forecast[HIST_MONTHS - 1] = lastHistoricalValue; // connect the two lines
lower80[HIST_MONTHS - 1] = lastHistoricalValue;
upper80[HIST_MONTHS - 1] = lastHistoricalValue;
lower95[HIST_MONTHS - 1] = lastHistoricalValue;
upper95[HIST_MONTHS - 1] = lastHistoricalValue;

for (let h = 1; h <= FCST_MONTHS; h++) {
  const i = HIST_MONTHS - 1 + h;
  const median = trendAt(i) + seasonalityAt(i);
  const sigma = 4 + 2.1 * Math.sqrt(h);
  forecast[i] = Math.round(median * 10) / 10;
  lower80[i] = Math.round((median - 1.28 * sigma) * 10) / 10;
  upper80[i] = Math.round((median + 1.28 * sigma) * 10) / 10;
  lower95[i] = Math.round((median - 1.96 * sigma) * 10) / 10;
  upper95[i] = Math.round((median + 1.96 * sigma) * 10) / 10;
}

// Stacked-area technique: an invisible "floor" series plus a visible "span"
// series on top of it renders as a band between lower and upper bounds.
const band95 = upper95.map((u, i) => (u === null ? null : Math.round((u - lower95[i]) * 10) / 10));
const band80 = upper80.map((u, i) => (u === null ? null : Math.round((u - lower80[i]) * 10) / 10));

const hexToRgba = (hex, alpha) => {
  const r = parseInt(hex.slice(1, 3), 16);
  const g = parseInt(hex.slice(3, 5), 16);
  const b = parseInt(hex.slice(5, 7), 16);
  return `rgba(${r},${g},${b},${alpha})`;
};

// Tighten the y-axis to the actual data range instead of a fixed 0-250 span,
// which left the ~100-215 band compressed into a narrow vertical strip.
const spannedValues = [...actual, ...lower95, ...upper95].filter((v) => v !== null);
const dataMin = Math.min(...spannedValues);
const dataMax = Math.max(...spannedValues);
const yAxisMin = Math.floor((dataMin - 10) / 10) * 10;
const yAxisMax = Math.ceil((dataMax + 10) / 10) * 10;

// --- Init --------------------------------------------------------------------
const chart = echarts.init(document.getElementById("container"));

// --- Option --------------------------------------------------------------------
chart.setOption({
  animation: false,
  backgroundColor: "transparent",
  color: t.palette,
  title: {
    text: "timeseries-forecast-uncertainty · javascript · echarts · anyplot.ai",
    left: "center",
    top: 20,
    textStyle: { color: t.ink, fontSize: 22, fontWeight: 600 },
  },
  legend: {
    data: ["Actual", "Forecast", "80% CI", "95% CI"],
    top: 72,
    left: "center",
    itemWidth: 22,
    itemHeight: 14,
    textStyle: { color: t.ink, fontSize: 15 },
  },
  grid: { left: 90, right: 60, top: 140, bottom: 90, containLabel: true },
  xAxis: {
    type: "category",
    data: categories,
    boundaryGap: false,
    axisLabel: { color: t.inkSoft, fontSize: 14, interval: 3 },
    axisLine: { lineStyle: { color: t.inkSoft } },
    axisTick: { show: false },
    splitLine: { show: false },
  },
  yAxis: {
    type: "value",
    name: "Revenue ($k)",
    nameTextStyle: { color: t.inkSoft, fontSize: 14 },
    min: yAxisMin,
    max: yAxisMax,
    axisLabel: { color: t.inkSoft, fontSize: 14, formatter: "${value}k" },
    axisLine: { show: false },
    splitLine: { lineStyle: { color: t.grid } },
  },
  series: [
    // 95% CI band (widest, drawn first so it sits behind the 80% band)
    {
      name: "__lower95",
      type: "line",
      data: lower95,
      stack: "ci95",
      symbol: "none",
      silent: true,
      lineStyle: { opacity: 0 },
      tooltip: { show: false },
    },
    {
      name: "95% CI",
      type: "line",
      data: band95,
      stack: "ci95",
      symbol: "none",
      lineStyle: { opacity: 0 },
      areaStyle: { color: t.palette[1], opacity: 0.15 },
      // Legend swatch uses a higher alpha than the in-chart band so the
      // 80%/95% entries stay visually distinct at a glance.
      itemStyle: { color: hexToRgba(t.palette[1], 0.45) },
    },
    // 80% CI band (narrower, drawn on top of the 95% band)
    {
      name: "__lower80",
      type: "line",
      data: lower80,
      stack: "ci80",
      symbol: "none",
      silent: true,
      lineStyle: { opacity: 0 },
      tooltip: { show: false },
    },
    {
      name: "80% CI",
      type: "line",
      data: band80,
      stack: "ci80",
      symbol: "none",
      lineStyle: { opacity: 0 },
      areaStyle: { color: t.palette[1], opacity: 0.32 },
      itemStyle: { color: hexToRgba(t.palette[1], 0.85) },
    },
    // Historical + forecast lines on top
    {
      name: "Actual",
      type: "line",
      data: actual,
      symbol: "none",
      lineStyle: { color: t.palette[0], width: 3.5 },
      itemStyle: { color: t.palette[0] },
      markLine: {
        symbol: "none",
        silent: true,
        lineStyle: { color: t.inkSoft, type: "dashed", width: 2 },
        label: {
          formatter: "Forecast start",
          color: t.inkSoft,
          fontSize: 13,
          position: "insideEndTop",
        },
        data: [{ xAxis: HIST_MONTHS - 1.5 }],
      },
    },
    {
      name: "Forecast",
      type: "line",
      data: forecast,
      symbol: "none",
      lineStyle: { color: t.palette[1], width: 3, type: "dashed" },
      itemStyle: { color: t.palette[1] },
    },
  ],
});
Runnable source as JSON, for any HTTP client: https://api.anyplot.ai/specs/timeseries-forecast-uncertainty/echarts/code. Any spec id and library id listed in llms-full.txt fit the same URL shape; every URL below is complete and callable.
{
  "spec_id": "timeseries-forecast-uncertainty",
  "language": "javascript",
  "library": "echarts",
  "page": "https://anyplot.ai/timeseries-forecast-uncertainty/javascript/echarts",
  "hub": "https://anyplot.ai/timeseries-forecast-uncertainty",
  "code_json": "https://api.anyplot.ai/specs/timeseries-forecast-uncertainty/echarts/code",
  "spec_json": "https://api.anyplot.ai/specs/timeseries-forecast-uncertainty",
  "render_light_png": "https://storage.googleapis.com/anyplot-images/plots/timeseries-forecast-uncertainty/javascript/echarts/plot-light.png",
  "render_dark_png": "https://storage.googleapis.com/anyplot-images/plots/timeseries-forecast-uncertainty/javascript/echarts/plot-dark.png",
  "interactive_light_html": "https://storage.googleapis.com/anyplot-images/plots/timeseries-forecast-uncertainty/javascript/echarts/plot-light.html",
  "interactive_dark_html": "https://storage.googleapis.com/anyplot-images/plots/timeseries-forecast-uncertainty/javascript/echarts/plot-dark.html",
  "quality_score": 93.0,
  "license": "MIT",
  "guide": "https://anyplot.ai/llms.txt"
}
Part of Time Series Forecast with Uncertainty Band on anyplot.ai.