The same plot in 14 other libraries — JavaScript: D3.js, Apache ECharts, Highcharts, MUI X Charts; Python: Altair, Bokeh, lets-plot, Matplotlib, Plotly, plotnine, Pygal, Seaborn; R: ggplot2; Julia: Makie.jl. Compare all 15 side by side: Time Series Forecast with Uncertainty Band in Python, R, Julia and JavaScript.
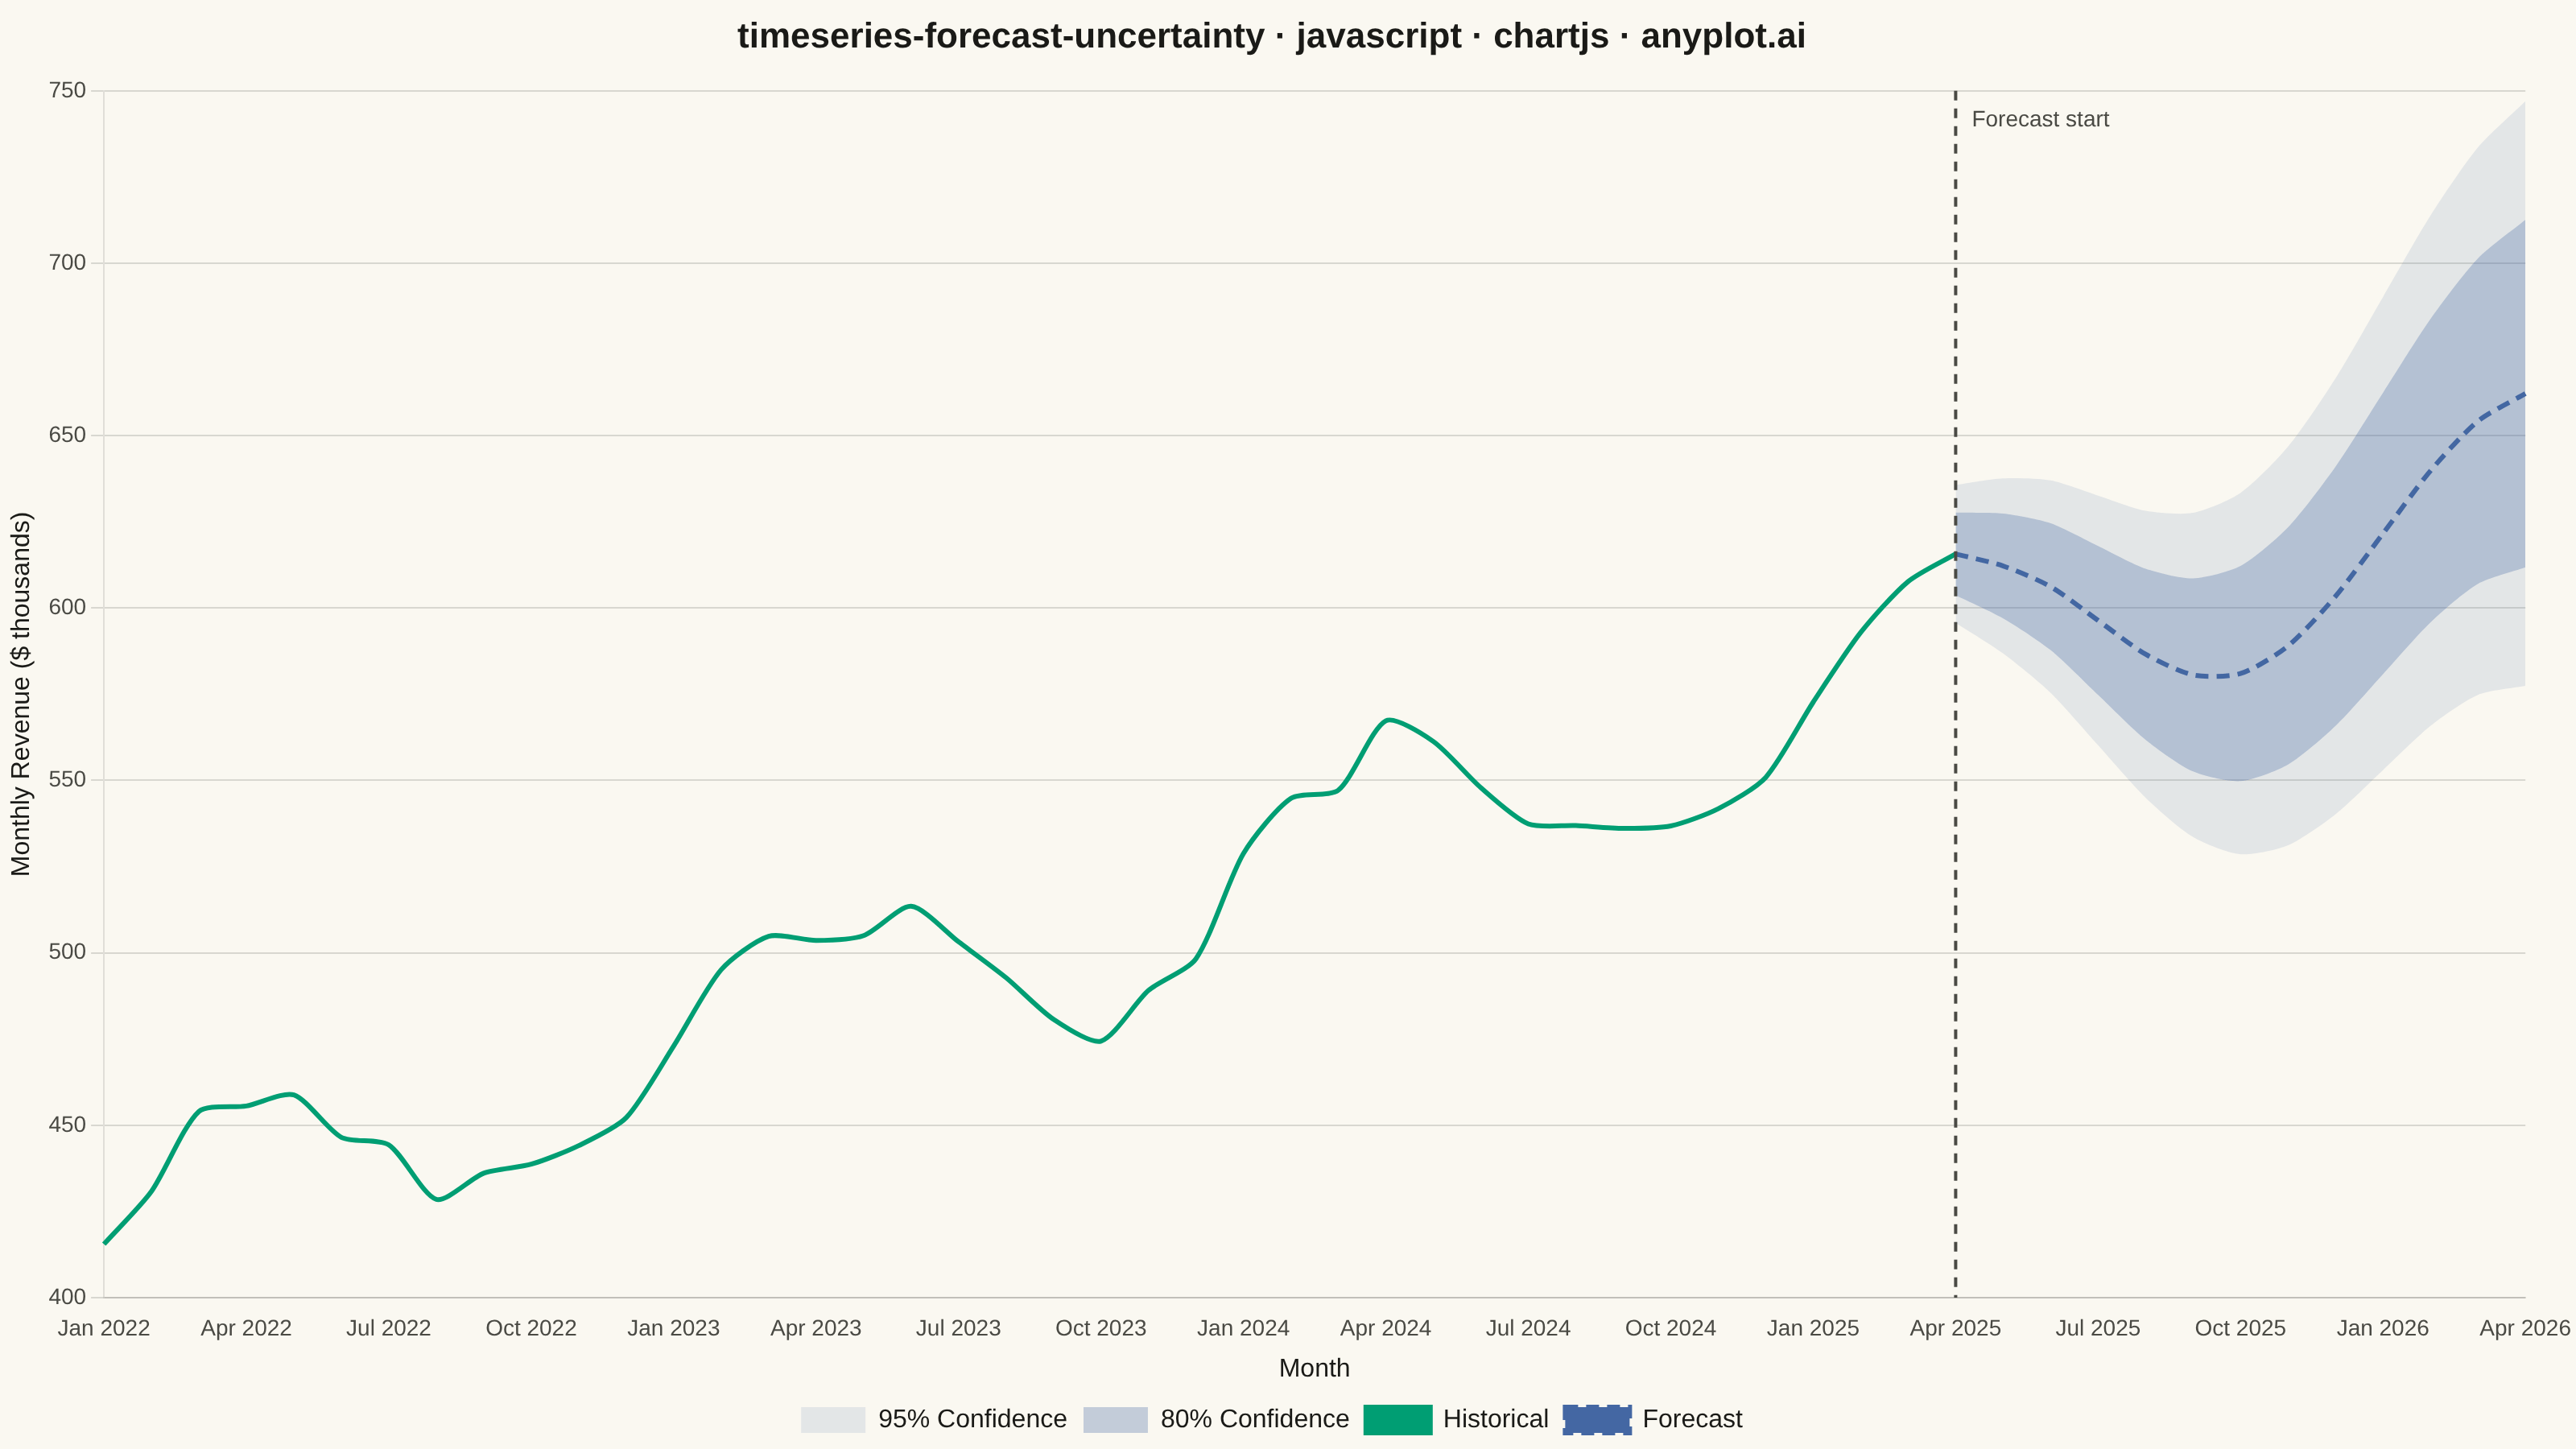
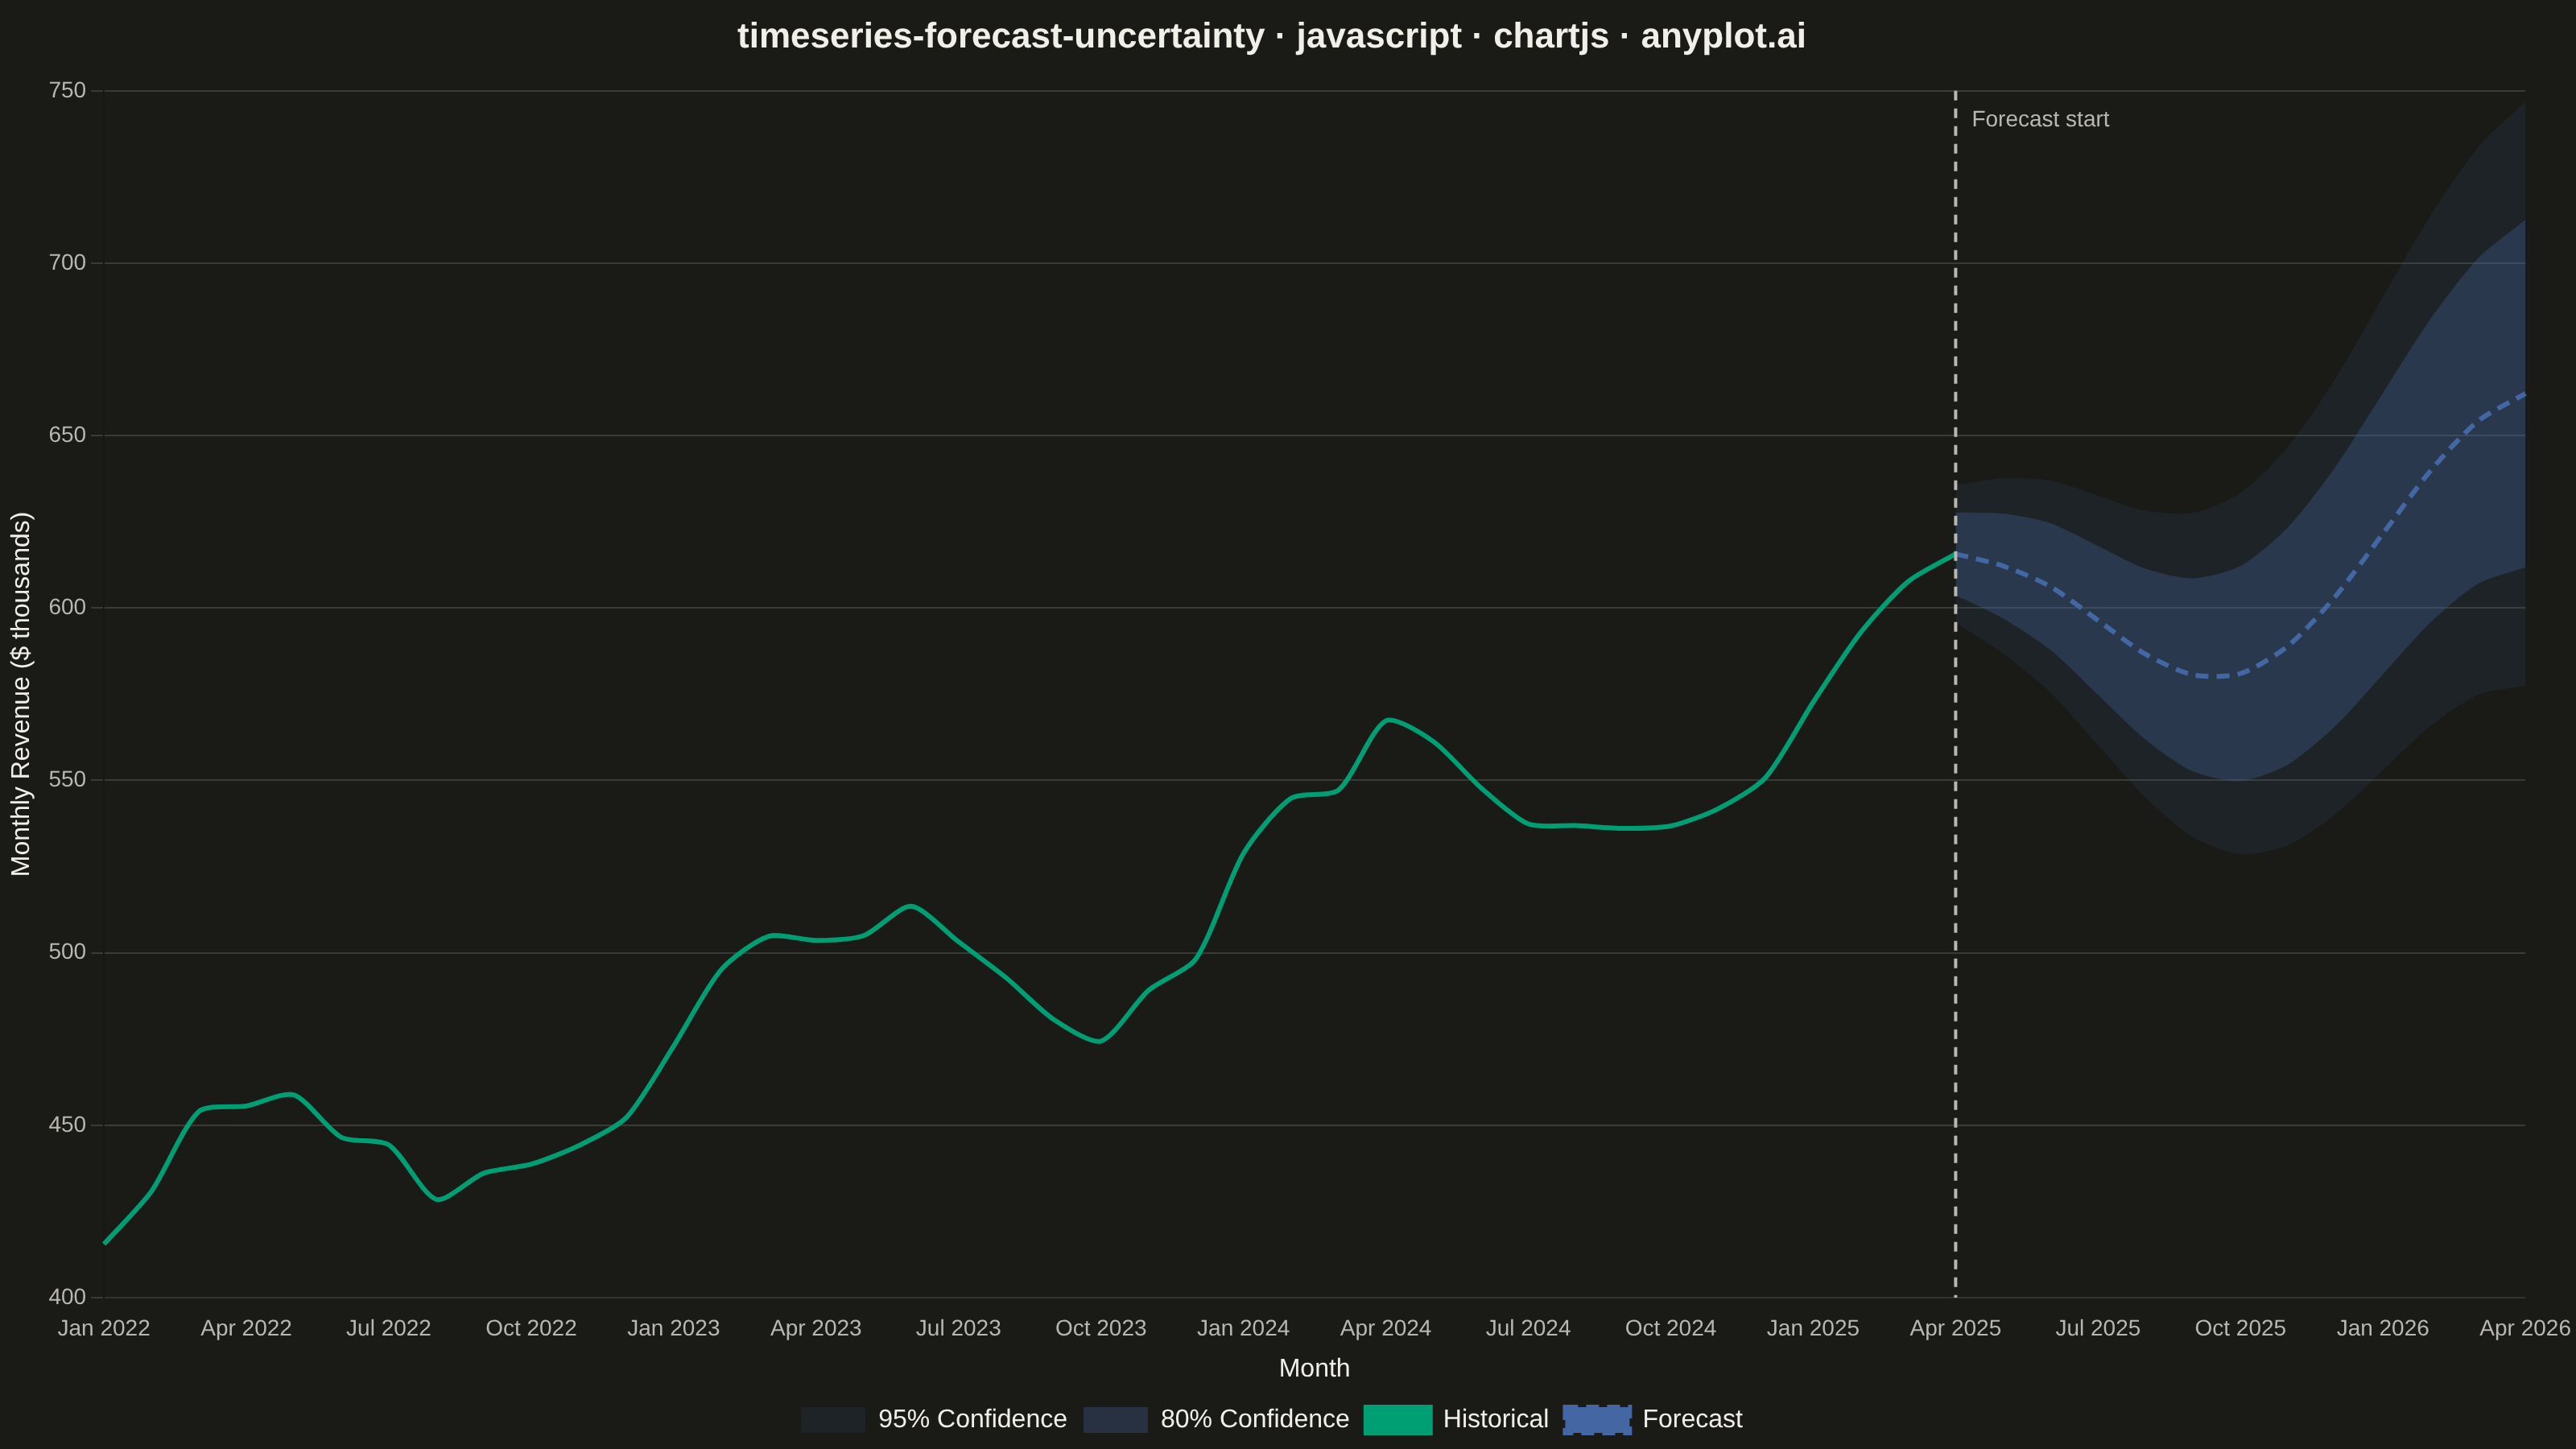
A time series plot that displays historical observed data followed by a forecast projection with confidence intervals or uncertainty bands. The plot clearly distinguishes between the historical period and the forecast period using a vertical line marker, with shaded bands representing different confidence levels (typically 80% and 95%). This visualization is essential for communicating prediction uncertainty in forecasting applications, helping stakeholders understand both the expected values and the range of possible outcomes.
// anyplot.ai
// timeseries-forecast-uncertainty: Time Series Forecast with Uncertainty Band
// Library: chartjs 4.4.7 | JavaScript 22.23.2
// Quality: 90/100 | Created: 2026-09-02

const t = window.ANYPLOT_TOKENS;

// --- Data (in-memory, deterministic LCG) ------------------------------------
function lcg(seed) {
  let state = seed;
  return () => {
    state = (state * 1664525 + 1013904223) % 4294967296;
    return state / 4294967296;
  };
}
const rand = lcg(42);

const N_HISTORY = 40;
const N_FORECAST = 12;
const N_TOTAL = N_HISTORY + N_FORECAST;
const FORECAST_START = N_HISTORY - 1; // last historical index, where forecast begins

const MONTH_NAMES = [
  "Jan",
  "Feb",
  "Mar",
  "Apr",
  "May",
  "Jun",
  "Jul",
  "Aug",
  "Sep",
  "Oct",
  "Nov",
  "Dec",
];
const START_YEAR = 2022;

const labels = [];
for (let i = 0; i < N_TOTAL; i++) {
  labels.push(`${MONTH_NAMES[i % 12]} ${START_YEAR + Math.floor(i / 12)}`);
}

// Monthly SaaS revenue ($k): trend + seasonality
const BASE = 420;
const TREND = 4.2;
const SEASONAL_AMPLITUDE = 28;
const trendValue = (i) =>
  BASE + TREND * i + SEASONAL_AMPLITUDE * Math.sin((2 * Math.PI * i) / 12);

const actual = [];
const forecast = [];
for (let i = 0; i < N_TOTAL; i++) {
  if (i < N_HISTORY) {
    const noise = (rand() - 0.5) * 18;
    actual.push(Math.round((trendValue(i) + noise) * 10) / 10);
    forecast.push(i === FORECAST_START ? actual[i] : null);
  } else {
    actual.push(null);
    forecast.push(Math.round(trendValue(i) * 10) / 10);
  }
}

// Uncertainty widens with forecast horizon
const lower80 = [];
const upper80 = [];
const lower95 = [];
const upper95 = [];
for (let i = 0; i < N_TOTAL; i++) {
  if (i < FORECAST_START) {
    lower80.push(null);
    upper80.push(null);
    lower95.push(null);
    upper95.push(null);
    continue;
  }
  const horizon = i - FORECAST_START;
  const spread80 = 12 + horizon * 3.2;
  const spread95 = 20 + horizon * 5.4;
  const center = forecast[i];
  lower80.push(Math.round((center - spread80) * 10) / 10);
  upper80.push(Math.round((center + spread80) * 10) / 10);
  lower95.push(Math.round((center - spread95) * 10) / 10);
  upper95.push(Math.round((center + spread95) * 10) / 10);
}

function hexToRgba(hex, alpha) {
  const r = parseInt(hex.slice(1, 3), 16);
  const g = parseInt(hex.slice(3, 5), 16);
  const b = parseInt(hex.slice(5, 7), 16);
  return `rgba(${r}, ${g}, ${b}, ${alpha})`;
}

const historicalColor = t.palette[0]; // #009E73 brand green — always first series
const forecastColor = t.palette[2]; // #4467A3 blue — forecast + uncertainty family

// --- Mount -------------------------------------------------------------------
const canvas = document.createElement("canvas");
document.getElementById("container").appendChild(canvas);

// Draws the forecast-start divider natively on the canvas (spec-required marker)
const forecastDividerPlugin = {
  id: "forecastDivider",
  afterDraw(chart) {
    const { ctx, chartArea, scales } = chart;
    const xPixel = scales.x.getPixelForValue(FORECAST_START);
    ctx.save();
    ctx.strokeStyle = t.inkSoft;
    ctx.lineWidth = 2;
    ctx.setLineDash([6, 5]);
    ctx.beginPath();
    ctx.moveTo(xPixel, chartArea.top);
    ctx.lineTo(xPixel, chartArea.bottom);
    ctx.stroke();
    ctx.setLineDash([]);
    ctx.fillStyle = t.inkSoft;
    ctx.font = "14px sans-serif";
    ctx.textAlign = "left";
    ctx.fillText("Forecast start", xPixel + 10, chartArea.top + 18);
    ctx.restore();
  },
};

// --- Chart ---------------------------------------------------------------
new Chart(canvas, {
  type: "line",
  data: {
    labels,
    datasets: [
      {
        label: "95% Confidence",
        data: upper95,
        borderWidth: 0,
        pointRadius: 0,
        fill: "+1",
        backgroundColor: hexToRgba(forecastColor, 0.12),
        tension: 0.25,
      },
      {
        label: "95% CI lower",
        data: lower95,
        borderWidth: 0,
        pointRadius: 0,
        fill: false,
        tension: 0.25,
      },
      {
        label: "80% Confidence",
        data: upper80,
        borderWidth: 0,
        pointRadius: 0,
        fill: "+1",
        backgroundColor: hexToRgba(forecastColor, 0.3),
        tension: 0.25,
      },
      {
        label: "80% CI lower",
        data: lower80,
        borderWidth: 0,
        pointRadius: 0,
        fill: false,
        tension: 0.25,
      },
      {
        label: "Historical",
        data: actual,
        borderColor: historicalColor,
        backgroundColor: historicalColor,
        borderWidth: 3,
        pointRadius: 0,
        fill: false,
        tension: 0.25,
      },
      {
        label: "Forecast",
        data: forecast,
        borderColor: forecastColor,
        backgroundColor: forecastColor,
        borderWidth: 3,
        borderDash: [8, 5],
        pointRadius: 0,
        fill: false,
        tension: 0.25,
      },
    ],
  },
  options: {
    responsive: true,
    maintainAspectRatio: false,
    animation: false,
    layout: { padding: { top: 10, right: 20 } },
    plugins: {
      title: {
        display: true,
        text: "timeseries-forecast-uncertainty · javascript · chartjs · anyplot.ai",
        color: t.ink,
        font: { size: 22 },
        padding: { bottom: 20 },
      },
      legend: {
        position: "bottom",
        labels: {
          color: t.ink,
          font: { size: 16 },
          filter: (item) => !item.text.includes("lower"),
        },
      },
    },
    scales: {
      x: {
        ticks: {
          color: t.inkSoft,
          font: { size: 14 },
          autoSkip: true,
          maxRotation: 0,
        },
        grid: { display: false },
        title: {
          display: true,
          text: "Month",
          color: t.ink,
          font: { size: 16 },
        },
      },
      y: {
        ticks: { color: t.inkSoft, font: { size: 14 } },
        grid: { color: t.grid },
        title: {
          display: true,
          text: "Monthly Revenue ($ thousands)",
          color: t.ink,
          font: { size: 16 },
        },
      },
    },
  },
  plugins: [forecastDividerPlugin],
});
Runnable source as JSON, for any HTTP client: https://api.anyplot.ai/specs/timeseries-forecast-uncertainty/chartjs/code. Any spec id and library id listed in llms-full.txt fit the same URL shape; every URL below is complete and callable.
{
  "spec_id": "timeseries-forecast-uncertainty",
  "language": "javascript",
  "library": "chartjs",
  "page": "https://anyplot.ai/timeseries-forecast-uncertainty/javascript/chartjs",
  "hub": "https://anyplot.ai/timeseries-forecast-uncertainty",
  "code_json": "https://api.anyplot.ai/specs/timeseries-forecast-uncertainty/chartjs/code",
  "spec_json": "https://api.anyplot.ai/specs/timeseries-forecast-uncertainty",
  "render_light_png": "https://storage.googleapis.com/anyplot-images/plots/timeseries-forecast-uncertainty/javascript/chartjs/plot-light.png",
  "render_dark_png": "https://storage.googleapis.com/anyplot-images/plots/timeseries-forecast-uncertainty/javascript/chartjs/plot-dark.png",
  "interactive_light_html": "https://storage.googleapis.com/anyplot-images/plots/timeseries-forecast-uncertainty/javascript/chartjs/plot-light.html",
  "interactive_dark_html": "https://storage.googleapis.com/anyplot-images/plots/timeseries-forecast-uncertainty/javascript/chartjs/plot-dark.html",
  "quality_score": 90.0,
  "license": "MIT",
  "guide": "https://anyplot.ai/llms.txt"
}
Part of Time Series Forecast with Uncertainty Band on anyplot.ai.