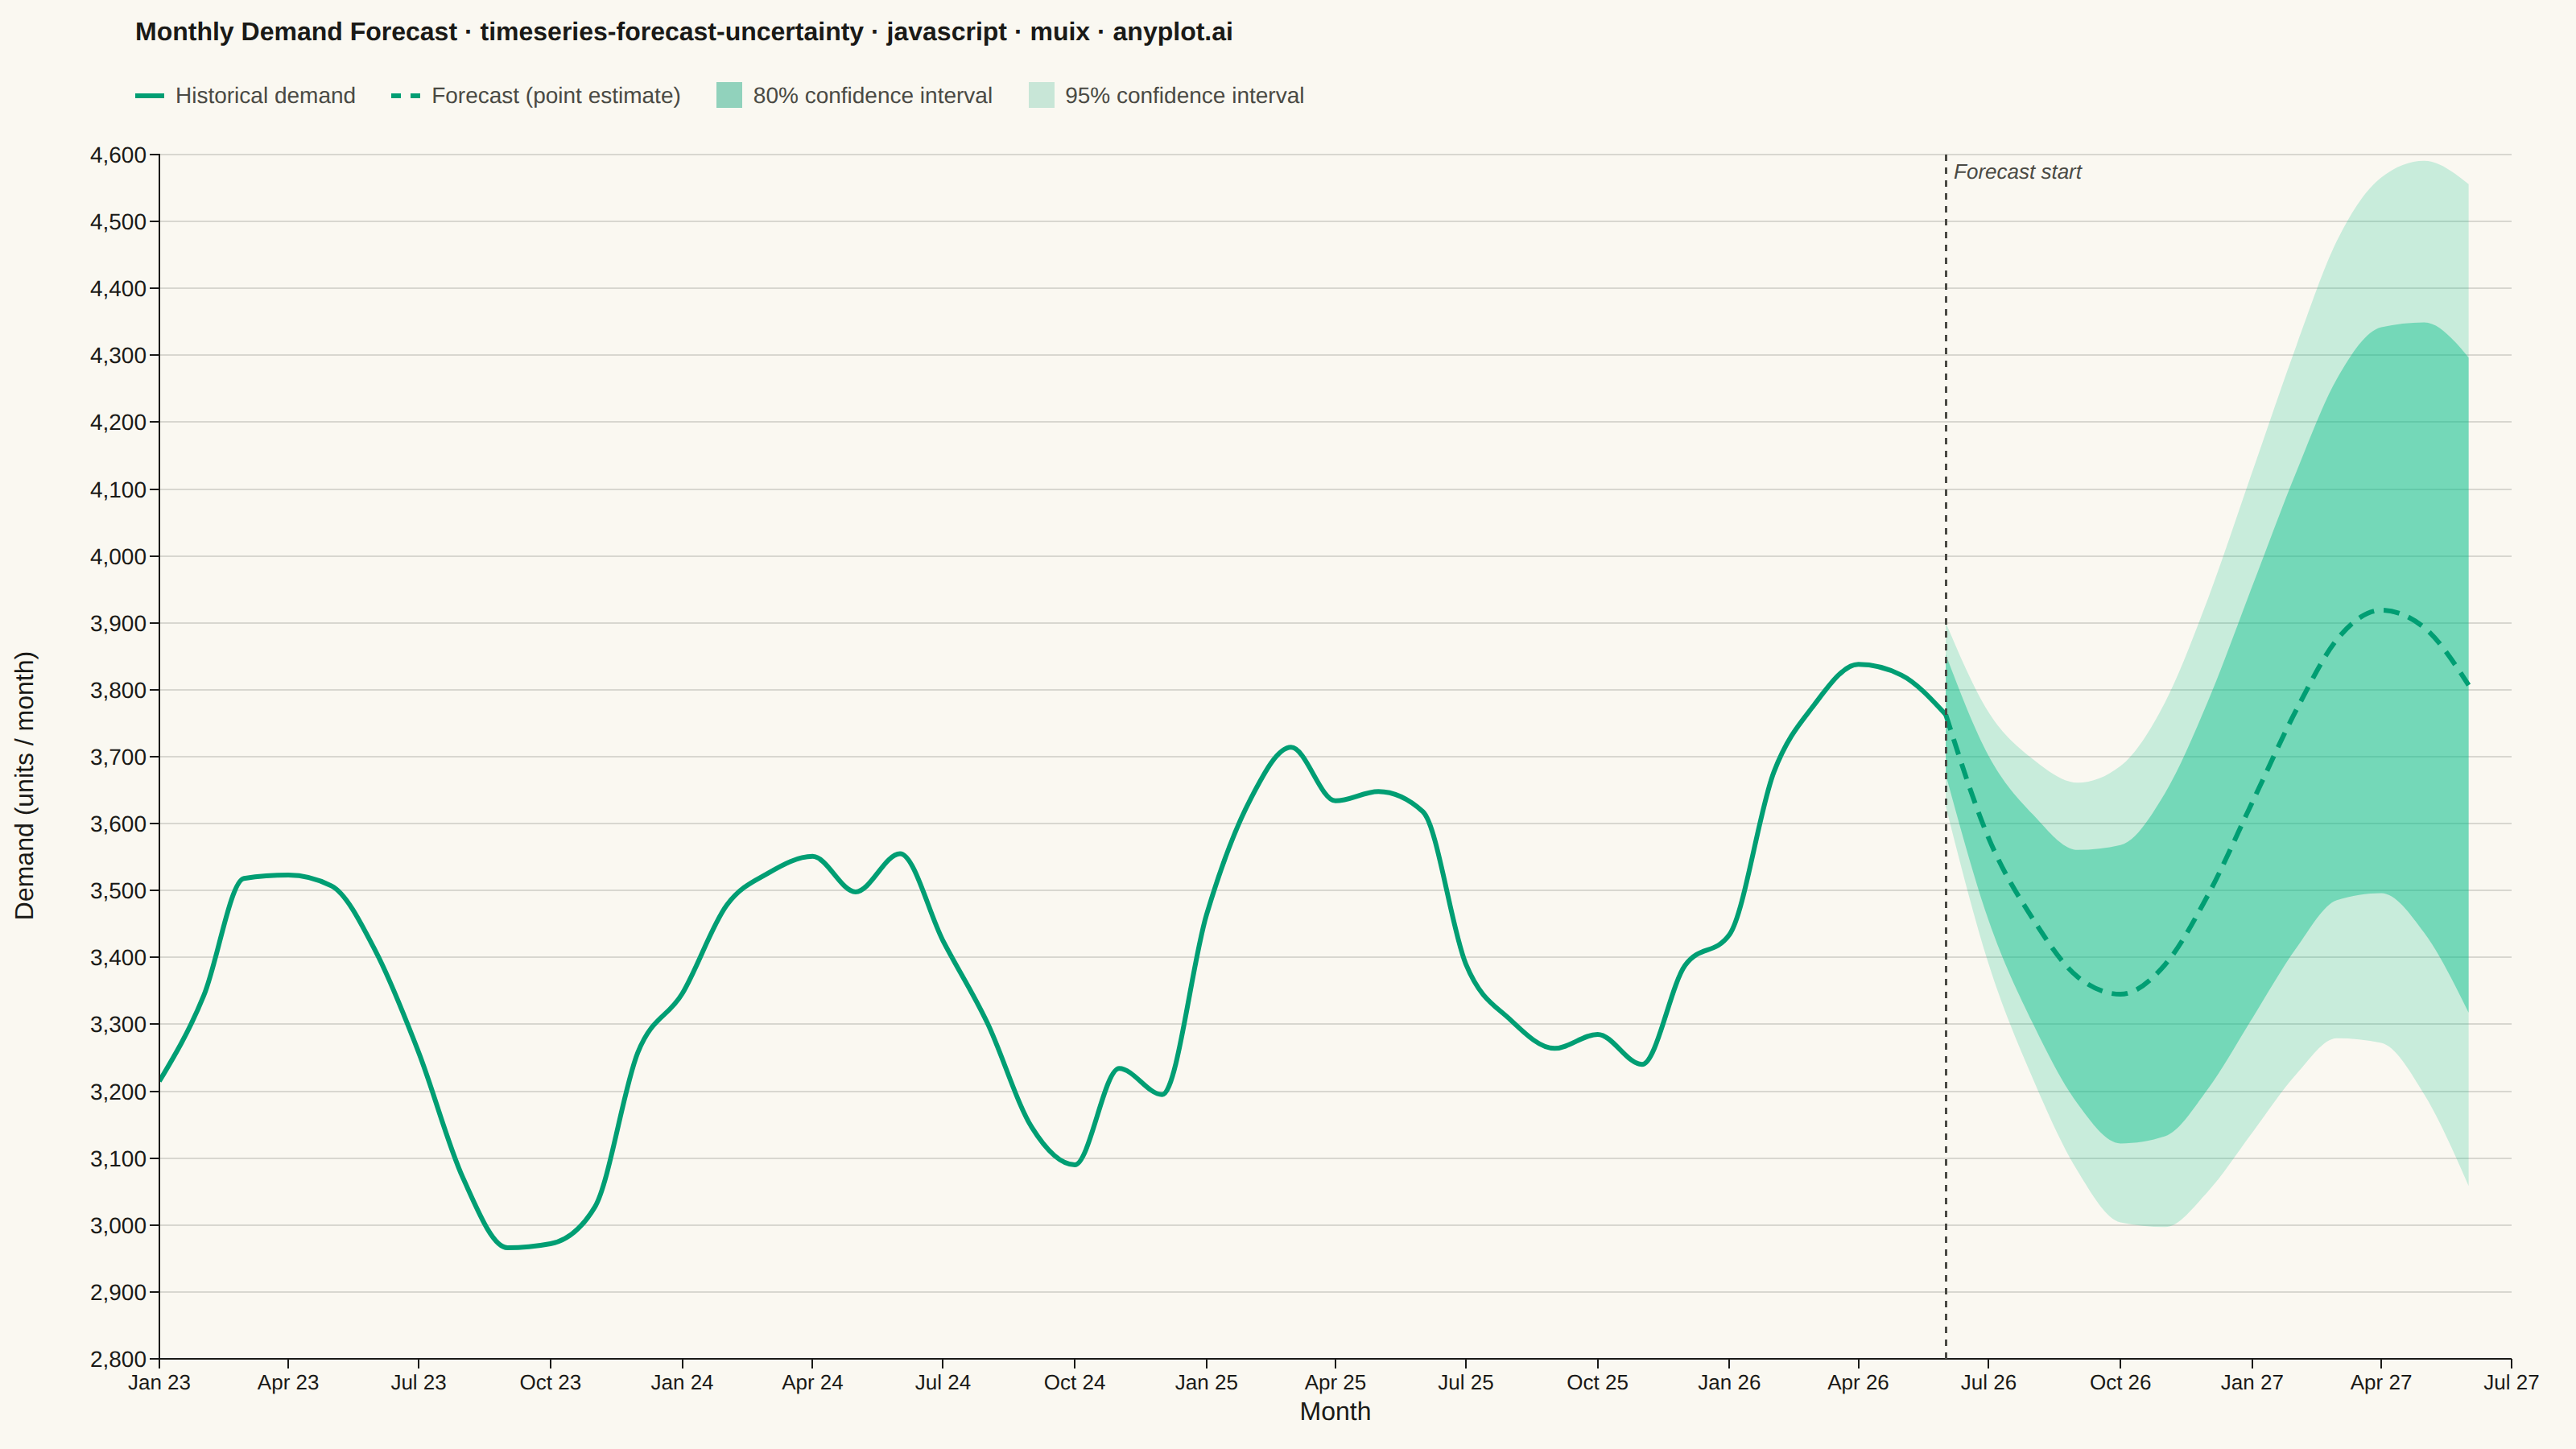
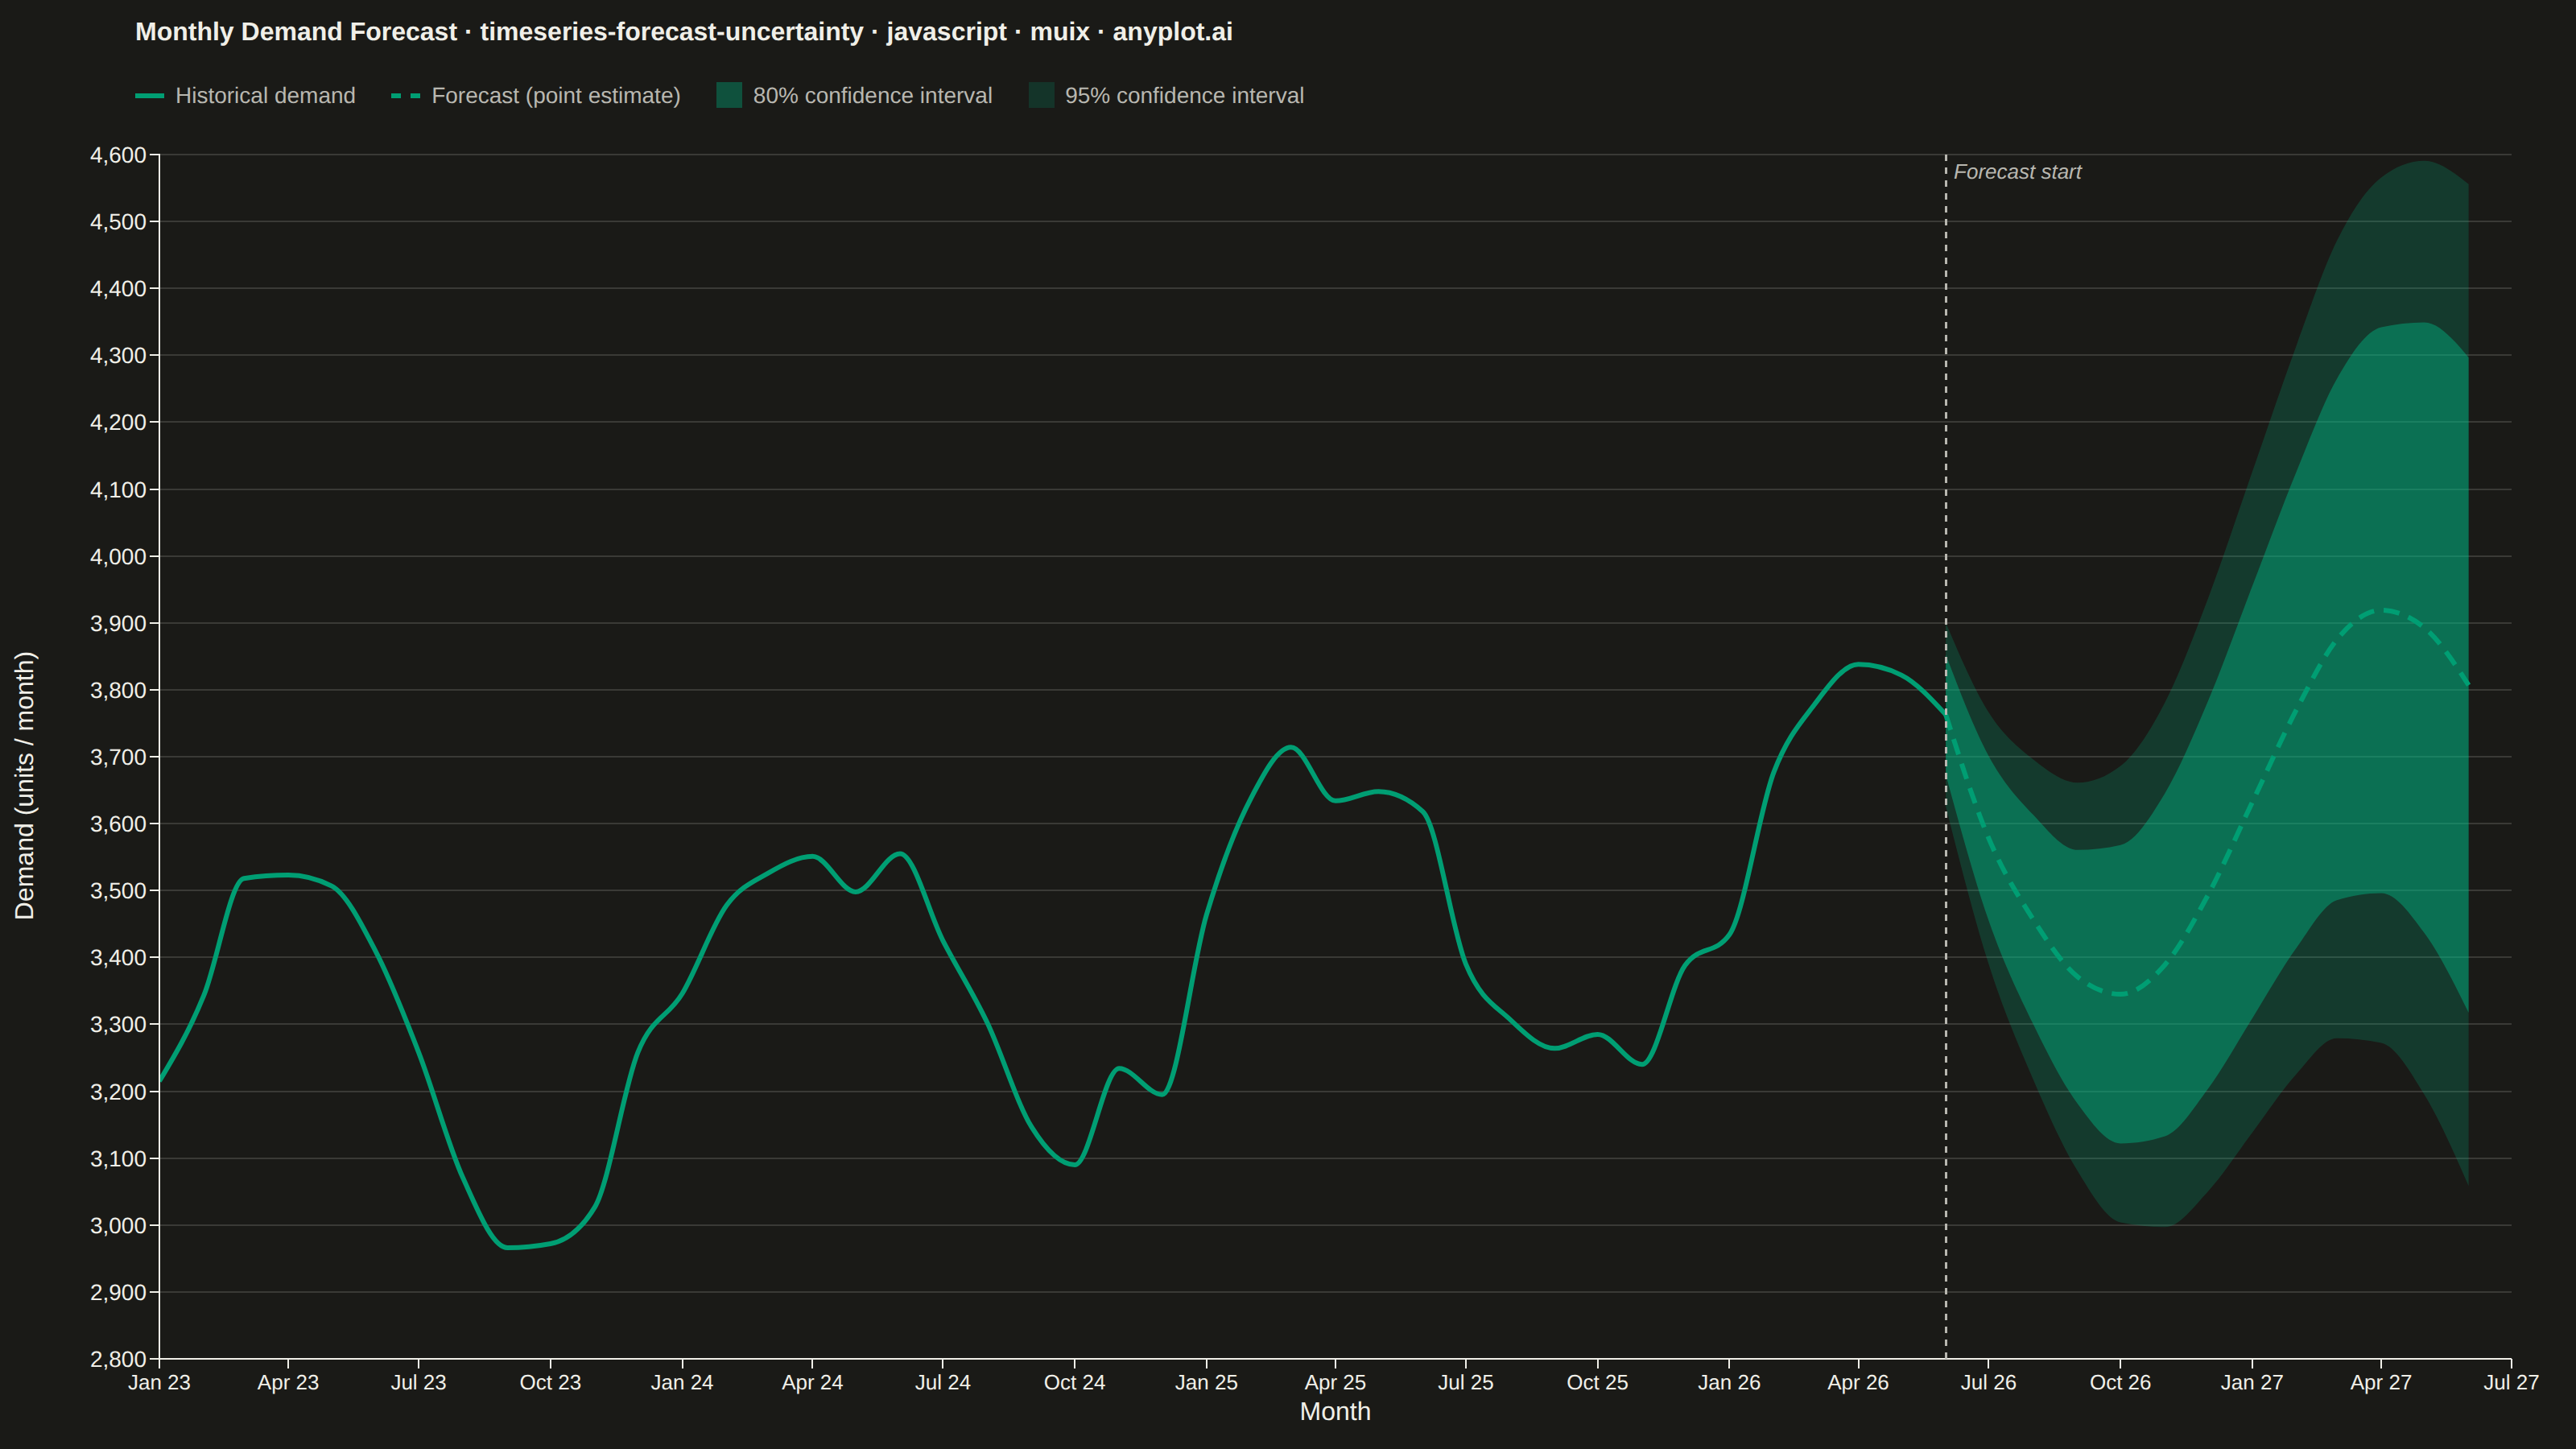
The same plot in 14 other libraries — JavaScript: Chart.js, D3.js, Apache ECharts, Highcharts; Python: Altair, Bokeh, lets-plot, Matplotlib, Plotly, plotnine, Pygal, Seaborn; R: ggplot2; Julia: Makie.jl. Compare all 15 side by side: Time Series Forecast with Uncertainty Band in Python, R, Julia and JavaScript.
A time series plot that displays historical observed data followed by a forecast projection with confidence intervals or uncertainty bands. The plot clearly distinguishes between the historical period and the forecast period using a vertical line marker, with shaded bands representing different confidence levels (typically 80% and 95%). This visualization is essential for communicating prediction uncertainty in forecasting applications, helping stakeholders understand both the expected values and the range of possible outcomes.
// anyplot.ai
// timeseries-forecast-uncertainty: Time Series Forecast with Uncertainty Band
// Library: muix 7.29.1 | JavaScript 22.23.2
// Quality: 91/100 | Created: 2026-09-02
import { LineChart } from "@mui/x-charts/LineChart";
import { ChartsReferenceLine } from "@mui/x-charts/ChartsReferenceLine";

const t = window.ANYPLOT_TOKENS;
const BRAND = t.palette[0]; // one hue for the whole series family: actual, forecast, and its own uncertainty envelope

// --- Data: 42 months of historical product demand + a 9-month-ahead forecast
// (the forecast's first point overlaps the last historical point so the two
// lines connect, per the spec). Uncertainty widens with horizon — the classic
// "fan out" of a real ARIMA/Prophet-style demand-planning forecast. ---
function lcg(seed) {
  let state = seed;
  return () => {
    state = (state * 1103515245 + 12345) % 2147483648;
    return state / 2147483648;
  };
}
const random = lcg(42);

const HIST_MONTHS = 42;
const FORECAST_HORIZON = 12;
const FORECAST_START = HIST_MONTHS - 1; // last historical index == first forecast index (overlap)
const TOTAL_MONTHS = HIST_MONTHS + FORECAST_HORIZON;

const dates = Array.from({ length: TOTAL_MONTHS }, (_, i) => new Date(2023, i, 1));

const BASE = 3200;
const TREND = 9;
const SEASON_AMP = 260;
const NOISE_AMP = 90;
const centerAt = (i) => BASE + TREND * i + SEASON_AMP * Math.sin((2 * Math.PI * i) / 12);

const actual = dates.map((_, i) =>
  i <= FORECAST_START ? Math.round(centerAt(i) + (random() - 0.5) * 2 * NOISE_AMP) : null,
);
const forecast = dates.map((_, i) => {
  if (i < FORECAST_START) return null;
  return i === FORECAST_START ? actual[FORECAST_START] : Math.round(centerAt(i));
});

// 80% / 95% normal-interval multipliers applied to a linearly growing sigma.
const Z80 = 1.2816;
const Z95 = 1.96;
const SIGMA_BASE = 70;
const SIGMA_GROWTH = 26;

const lower80 = [];
const lower95 = [];
const bandWidth80 = [];
const bandWidth95 = [];
dates.forEach((_, i) => {
  if (i < FORECAST_START) {
    lower80.push(null);
    lower95.push(null);
    bandWidth80.push(null);
    bandWidth95.push(null);
    return;
  }
  const horizon = i - FORECAST_START;
  const sigma = SIGMA_BASE + SIGMA_GROWTH * horizon;
  const half80 = Z80 * sigma;
  const half95 = Z95 * sigma;
  lower80.push(forecast[i] - half80);
  lower95.push(forecast[i] - half95);
  bandWidth80.push(2 * half80);
  bandWidth95.push(2 * half95);
});

// Stacked-band trick: an invisible series carries the lower-bound offset, and
// a second series stacked on top of it supplies only the band's own width
// (upper - lower). The visible area then spans exactly [lower, upper]. The
// wider 95% band is declared first so the narrower 80% band draws on top of
// it, giving the "darker inner / lighter outer" nesting the spec asks for.
// The base/stroke hiding below (see `sx`) depends on `@mui/x-charts`'
// internal `.MuiAreaElement-series-*` / `.MuiLineElement-series-*` class
// names, which are not part of the library's public API and could change
// on a version bump — there's no documented public hook for "stack a series
// but don't render its own line/fill" as of 7.29.1.
const series = [
  { id: "lower95-base", data: lower95, stack: "ci95", showMark: false, color: t.pageBg },
  {
    id: "band95",
    label: "95% confidence interval",
    data: bandWidth95,
    stack: "ci95",
    area: true,
    showMark: false,
    color: BRAND,
  },
  { id: "lower80-base", data: lower80, stack: "ci80", showMark: false, color: t.pageBg },
  {
    id: "band80",
    label: "80% confidence interval",
    data: bandWidth80,
    stack: "ci80",
    area: true,
    showMark: false,
    color: BRAND,
  },
  {
    id: "actual",
    label: "Historical demand",
    data: actual,
    showMark: false,
    color: BRAND,
    curve: "monotoneX",
  },
  {
    id: "forecast",
    label: "Forecast (point estimate)",
    data: forecast,
    showMark: false,
    color: BRAND,
    curve: "monotoneX",
  },
];

// Tight y-axis floor: pad just below the lowest plotted value (across the
// historical line and the wide 95% band) instead of a hand-picked constant,
// so the margin below the data stays proportional as FORECAST_HORIZON changes.
const plottedLows = [...actual, ...lower95].filter((v) => v !== null);
const yMin = Math.floor((Math.min(...plottedLows) - 150) / 100) * 100;

const TITLE = "Monthly Demand Forecast · timeseries-forecast-uncertainty · javascript · muix · anyplot.ai";
const TITLE_FONT_DEFAULT = 22;
const titleFontSize =
  TITLE.length > 67 ? Math.round(TITLE_FONT_DEFAULT * (67 / TITLE.length)) : TITLE_FONT_DEFAULT;
const TITLE_H = 42;
const LEGEND_H = 34;

// Hand-rolled legend: MUI X's built-in legend renders a flat, full-opacity
// swatch per series, which can't show the 80%-vs-95% band nesting or the
// solid-vs-dashed line distinction the spec calls for.
function Legend() {
  const items = [
    { label: "Historical demand", kind: "line-solid" },
    { label: "Forecast (point estimate)", kind: "line-dashed" },
    { label: "80% confidence interval", kind: "fill", opacity: 0.42 },
    { label: "95% confidence interval", kind: "fill", opacity: 0.2 },
  ];
  return (
    <div style={{ height: LEGEND_H, display: "flex", alignItems: "center", gap: "22px", flexWrap: "wrap" }}>
      {items.map((it) => (
        <div key={it.label} style={{ display: "flex", alignItems: "center", gap: "7px" }}>
          {it.kind === "fill" ? (
            <span style={{ width: "16px", height: "16px", backgroundColor: BRAND, opacity: it.opacity, display: "inline-block" }} />
          ) : (
            <span
              style={{
                width: "18px",
                height: 0,
                borderTop: `3px ${it.kind === "line-dashed" ? "dashed" : "solid"} ${BRAND}`,
                display: "inline-block",
              }}
            />
          )}
          <span style={{ fontSize: "14px", color: t.inkSoft }}>{it.label}</span>
        </div>
      ))}
    </div>
  );
}

// --- Chart (default-exported component — the harness mounts it) ------------
export default function Chart() {
  const { width, height } = window.ANYPLOT_SIZE;
  const chartHeight = height - TITLE_H - LEGEND_H;
  const Y_LABEL_W = 34;
  const chartWidth = width - Y_LABEL_W;

  return (
    <div style={{ width, height, display: "flex", flexDirection: "column", backgroundColor: t.pageBg }}>
      <div style={{ paddingLeft: "84px" }}>
        <div
          style={{
            height: `${TITLE_H}px`,
            lineHeight: `${TITLE_H}px`,
            fontSize: `${titleFontSize}px`,
            fontWeight: 600,
            color: t.ink,
          }}
        >
          {TITLE}
        </div>
        <Legend />
      </div>
      <div style={{ display: "flex", width, height: chartHeight }}>
        <div style={{ width: Y_LABEL_W, display: "flex", alignItems: "center", justifyContent: "center" }}>
          <span
            style={{
              display: "inline-block",
              transform: "rotate(-90deg)",
              whiteSpace: "nowrap",
              fontSize: "16px",
              color: t.ink,
            }}
          >
            Demand (units / month)
          </span>
        </div>
        <LineChart
          width={chartWidth}
          height={chartHeight}
          skipAnimation
          grid={{ horizontal: true }}
          xAxis={[
            {
              data: dates,
              scaleType: "time",
              valueFormatter: (date) => date.toLocaleDateString("en-US", { month: "short", year: "2-digit" }),
              tickNumber: 10,
              label: "Month",
              labelStyle: { fontSize: 16 },
              tickLabelStyle: { fontSize: 13 },
            },
          ]}
          yAxis={[
            {
              min: yMin,
              tickLabelStyle: { fontSize: 14 },
              valueFormatter: (v) => v.toLocaleString("en-US"),
            },
          ]}
          series={series}
          margin={{ top: 20, right: 40, bottom: 56, left: 65 }}
          slotProps={{ legend: { hidden: true } }}
          sx={{
            "& .MuiAreaElement-series-band95": { fillOpacity: 0.2 },
            "& .MuiAreaElement-series-band80": { fillOpacity: 0.42 },
            "& .MuiLineElement-series-lower95-base": { display: "none" },
            "& .MuiLineElement-series-lower80-base": { display: "none" },
            "& .MuiLineElement-series-band95": { stroke: "none" },
            "& .MuiLineElement-series-band80": { stroke: "none" },
            "& .MuiLineElement-series-forecast": { strokeDasharray: "10 6" },
            "& .MuiLineElement-root": { strokeWidth: 3 },
            "& .MuiChartsAxis-tickLabel": { fill: t.inkSoft },
            "& .MuiChartsAxis-line": { stroke: t.inkSoft },
            "& .MuiChartsGrid-line": { stroke: t.grid, strokeWidth: 1 },
          }}
        >
          <ChartsReferenceLine
            x={dates[FORECAST_START]}
            label="Forecast start"
            labelAlign="start"
            lineStyle={{ stroke: t.inkSoft, strokeDasharray: "4 4", strokeWidth: 1.5 }}
            labelStyle={{ fontSize: 13, fill: t.inkSoft, fontStyle: "italic" }}
          />
        </LineChart>
      </div>
    </div>
  );
}
Runnable source as JSON, for any HTTP client: https://api.anyplot.ai/specs/timeseries-forecast-uncertainty/muix/code. Any spec id and library id listed in llms-full.txt fit the same URL shape; every URL below is complete and callable.
{
  "spec_id": "timeseries-forecast-uncertainty",
  "language": "javascript",
  "library": "muix",
  "page": "https://anyplot.ai/timeseries-forecast-uncertainty/javascript/muix",
  "hub": "https://anyplot.ai/timeseries-forecast-uncertainty",
  "code_json": "https://api.anyplot.ai/specs/timeseries-forecast-uncertainty/muix/code",
  "spec_json": "https://api.anyplot.ai/specs/timeseries-forecast-uncertainty",
  "render_light_png": "https://storage.googleapis.com/anyplot-images/plots/timeseries-forecast-uncertainty/javascript/muix/plot-light.png",
  "render_dark_png": "https://storage.googleapis.com/anyplot-images/plots/timeseries-forecast-uncertainty/javascript/muix/plot-dark.png",
  "interactive_light_html": "https://storage.googleapis.com/anyplot-images/plots/timeseries-forecast-uncertainty/javascript/muix/plot-light.html",
  "interactive_dark_html": "https://storage.googleapis.com/anyplot-images/plots/timeseries-forecast-uncertainty/javascript/muix/plot-dark.html",
  "quality_score": 91.0,
  "license": "MIT",
  "guide": "https://anyplot.ai/llms.txt"
}
Part of Time Series Forecast with Uncertainty Band on anyplot.ai.