The same plot in 14 other libraries — JavaScript: D3.js, Apache ECharts, Highcharts, MUI X Charts; Python: Altair, Bokeh, lets-plot, Matplotlib, Plotly, plotnine, Pygal, Seaborn; R: ggplot2; Julia: Makie.jl. Compare all 15 side by side: Venn Diagram in Python, R, Julia and JavaScript.
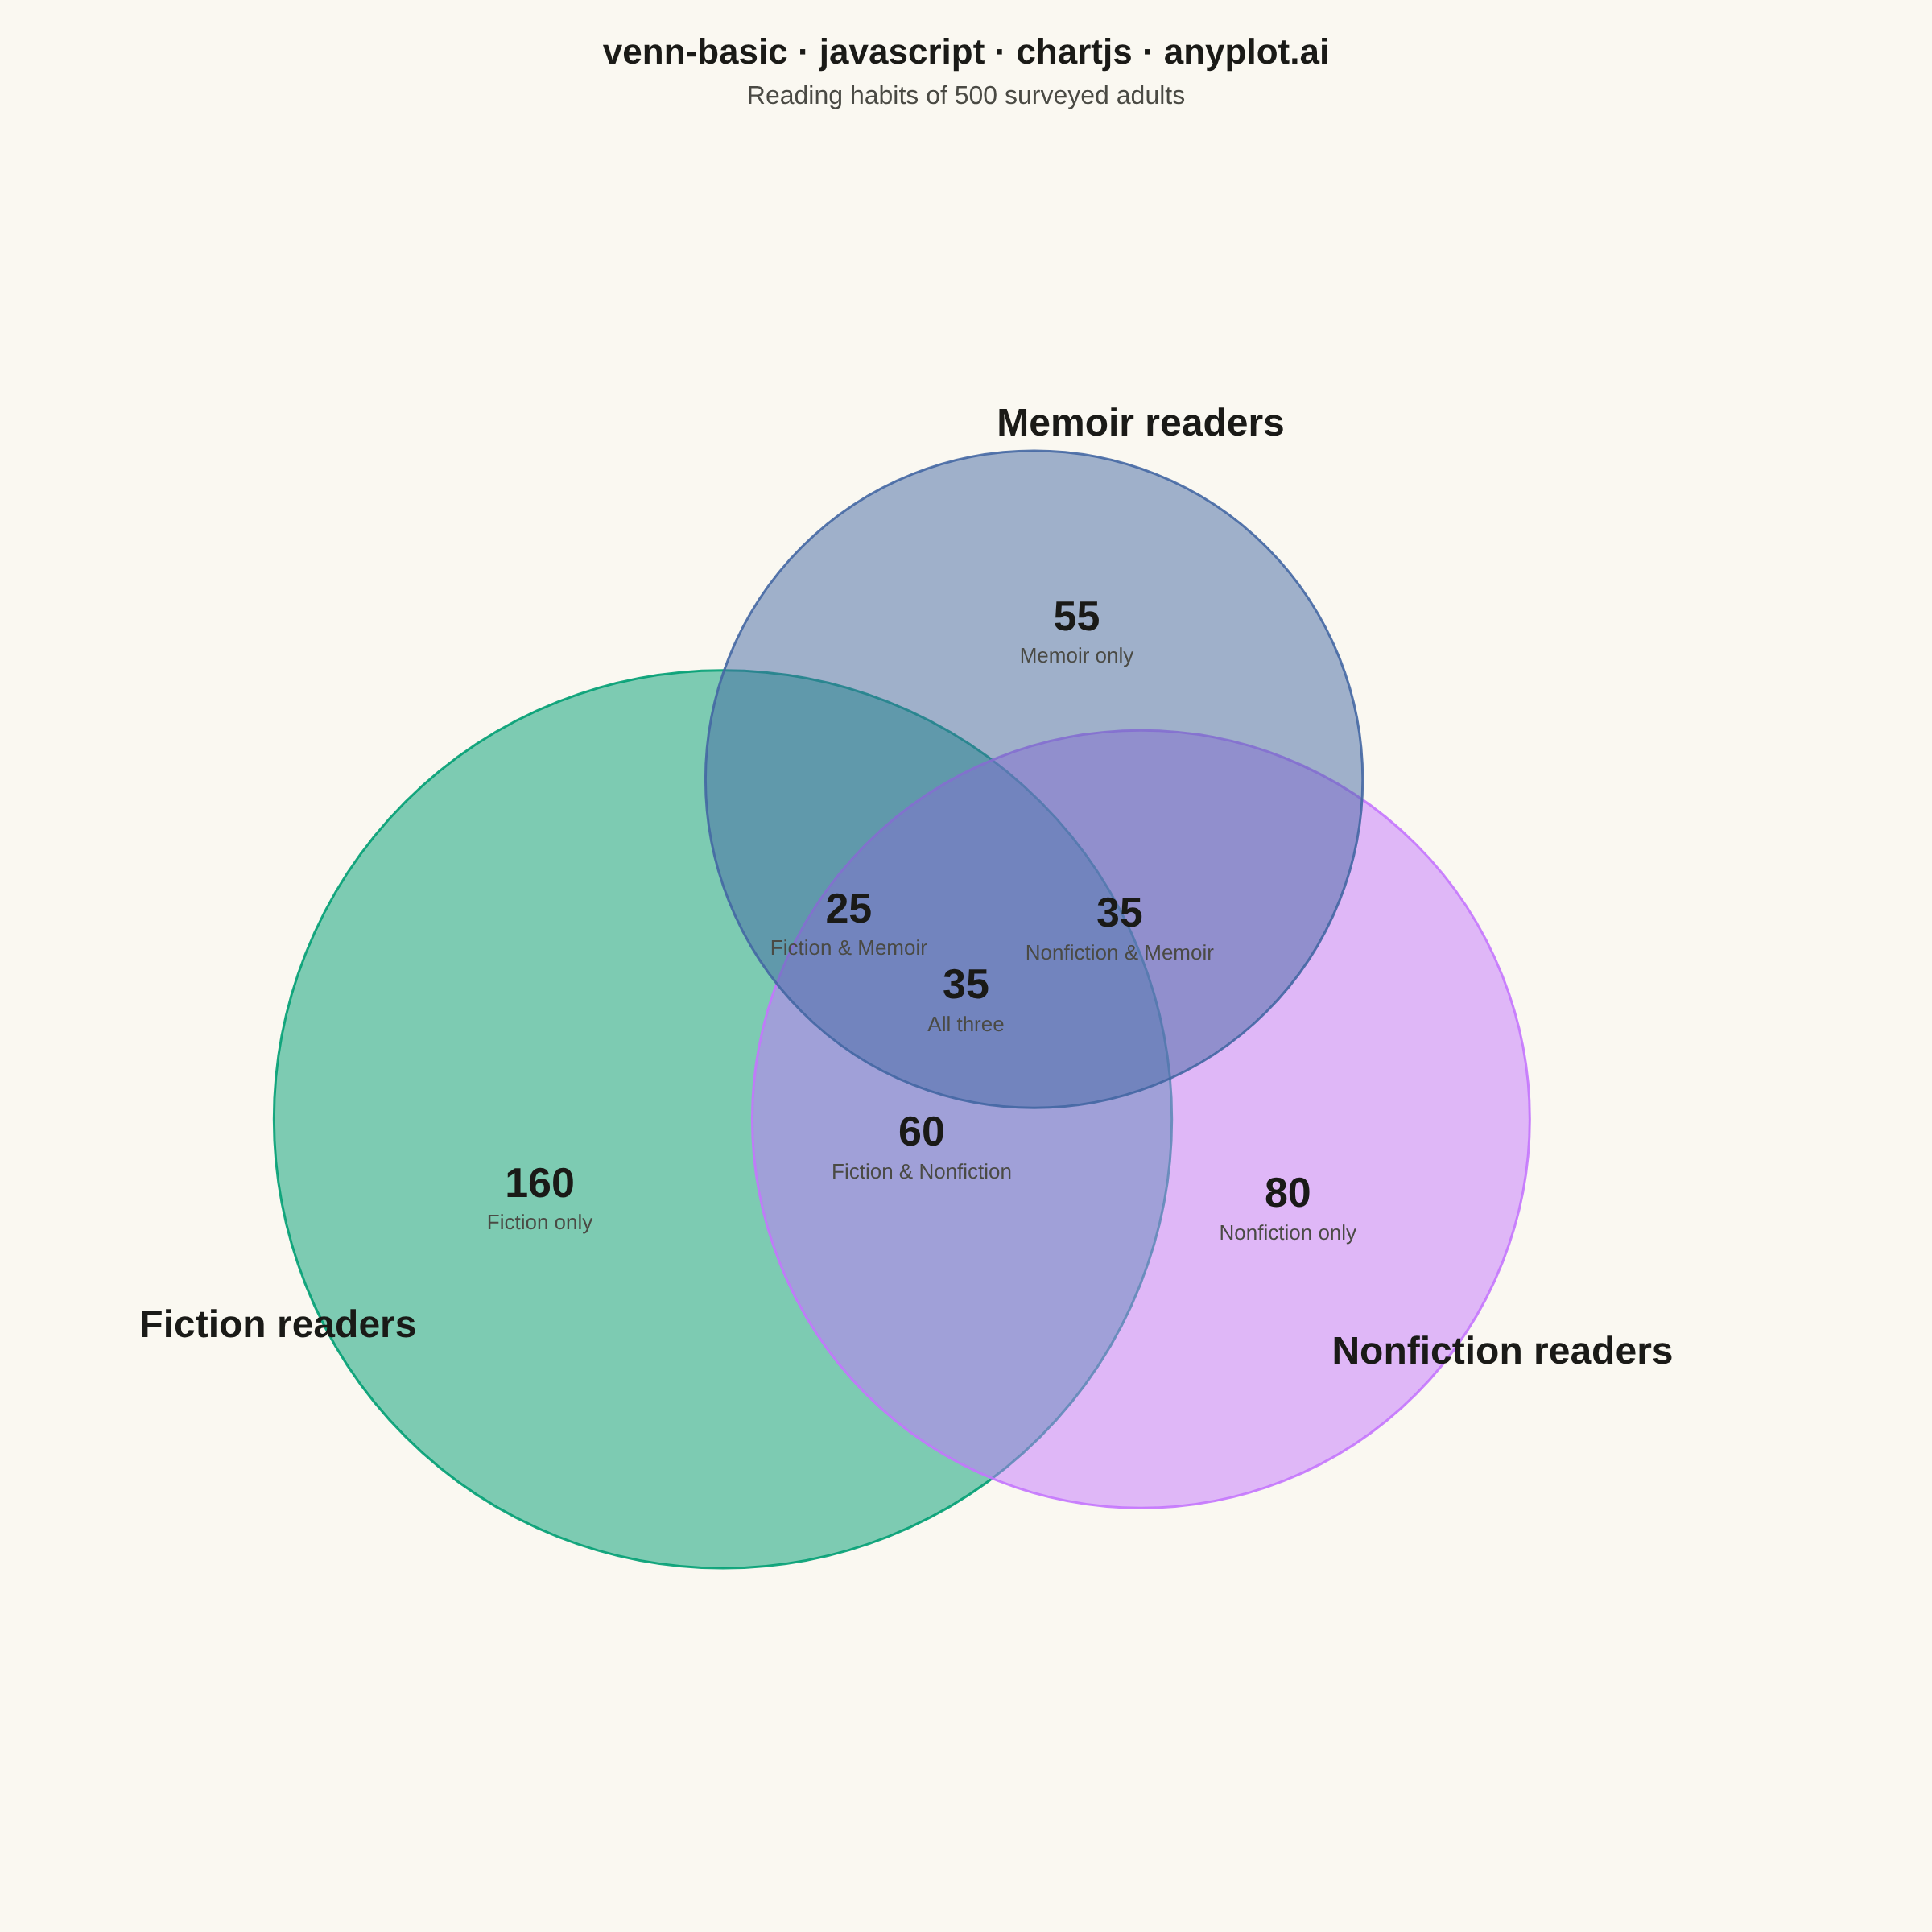
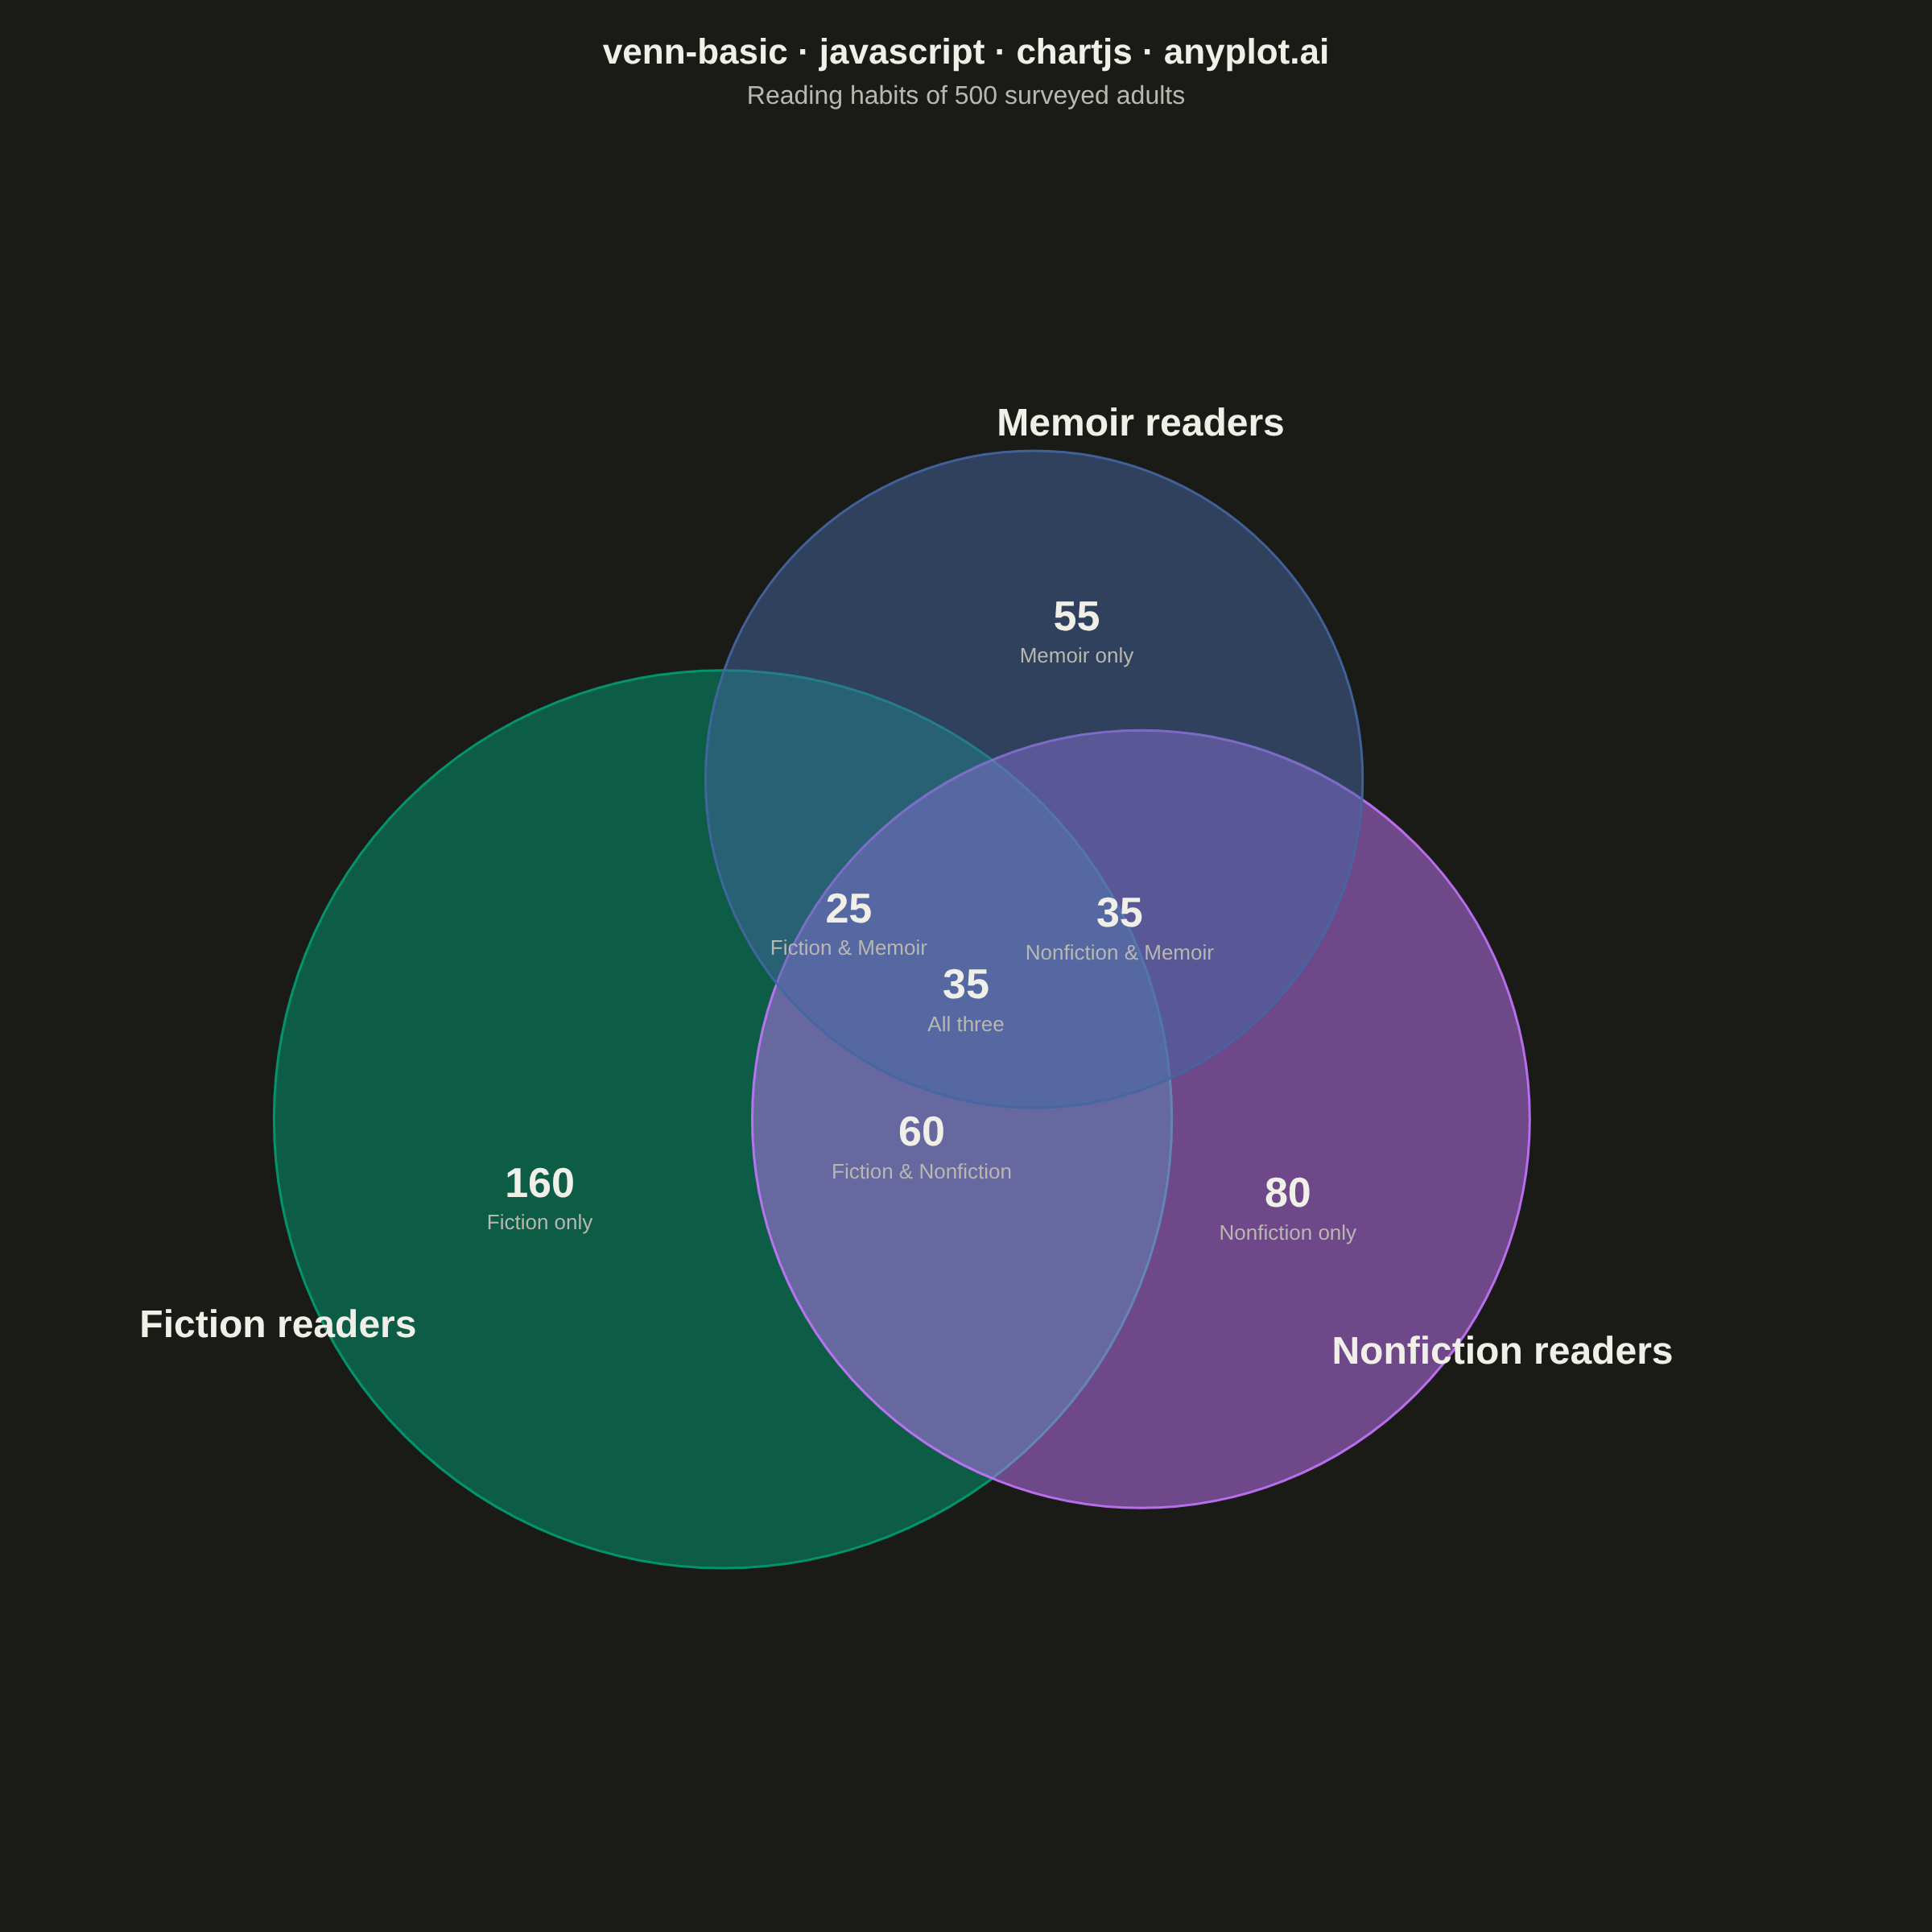
A Venn diagram visualizes the logical relationships between two or three sets using overlapping circles. Each circle represents a set, and overlapping regions show elements shared between sets. This classic visualization is ideal for showing intersections, unions, and exclusive memberships, making abstract set relationships immediately intuitive.
// anyplot.ai
// venn-basic: Venn Diagram
// Library: chartjs 4.4.7 | JavaScript 22.23.2
// Quality: 93/100 | Created: 2026-09-09

//# anyplot-orientation: square
const t = window.ANYPLOT_TOKENS;

// --- Data (in-memory, deterministic) ----------------------------------------
// Reading-habit survey of 500 adults: which genres they read regularly.
// Respondents may read more than one genre, so the three sets overlap.
const totalReaders = 500;
const fictionTotal = 280;
const nonfictionTotal = 210;
const memoirTotal = 150;

// Pairwise totals (each includes the triple-overlap readers, standard
// inclusion-exclusion convention) plus the triple overlap itself.
const fictionNonfiction = 95;
const fictionMemoir = 60;
const nonfictionMemoir = 70;
const allThree = 35;

const sets = [
  { name: "Fiction readers", total: fictionTotal, color: t.palette[0] },
  { name: "Nonfiction readers", total: nonfictionTotal, color: t.palette[1] },
  { name: "Memoir readers", total: memoirTotal, color: t.palette[2] },
];

// Exclusive region counts, derived from the pairwise/triple totals above.
const onlyFiction = fictionTotal - fictionNonfiction - fictionMemoir + allThree;
const onlyNonfiction = nonfictionTotal - fictionNonfiction - nonfictionMemoir + allThree;
const onlyMemoir = memoirTotal - fictionMemoir - nonfictionMemoir + allThree;
const onlyFictionNonfiction = fictionNonfiction - allThree;
const onlyFictionMemoir = fictionMemoir - allThree;
const onlyNonfictionMemoir = nonfictionMemoir - allThree;

function withAlpha(hex, alpha) {
  const n = parseInt(hex.slice(1), 16);
  const r = (n >> 16) & 255;
  const g = (n >> 8) & 255;
  const b = n & 255;
  return `rgba(${r}, ${g}, ${b}, ${alpha})`;
}

// --- Proportional-Venn geometry ----------------------------------------------
// Circle-circle lens (intersection) area for radii r1, r2 with center
// distance d — the standard two-circle-lens formula.
function lensArea(r1, r2, d) {
  if (d >= r1 + r2) return 0;
  if (d <= Math.abs(r1 - r2)) return Math.PI * Math.min(r1, r2) ** 2;
  const r1sq = r1 * r1;
  const r2sq = r2 * r2;
  const dsq = d * d;
  const alpha = Math.acos((dsq + r1sq - r2sq) / (2 * d * r1));
  const beta = Math.acos((dsq + r2sq - r1sq) / (2 * d * r2));
  const triangleTerm =
    0.5 * Math.sqrt((-d + r1 + r2) * (d + r1 - r2) * (d - r1 + r2) * (d + r1 + r2));
  return r1sq * alpha + r2sq * beta - triangleTerm;
}

// Binary-search the center distance that makes lensArea(r1, r2, d) equal
// targetArea — lensArea is monotonically decreasing in d, so bisection works.
function solveDistanceForArea(r1, r2, targetArea) {
  const maxArea = Math.PI * Math.min(r1, r2) ** 2;
  if (targetArea >= maxArea) return Math.abs(r1 - r2) + 1e-3;
  if (targetArea <= 0) return r1 + r2;
  let lo = Math.abs(r1 - r2) + 1e-6;
  let hi = r1 + r2 - 1e-6;
  for (let i = 0; i < 50; i++) {
    const mid = (lo + hi) / 2;
    if (lensArea(r1, r2, mid) > targetArea) lo = mid;
    else hi = mid;
  }
  return (lo + hi) / 2;
}

function normalize(vx, vy) {
  const len = Math.hypot(vx, vy) || 1e-6;
  return [vx / len, vy / len];
}

// --- Venn diagram plugin -------------------------------------------------------
// Chart.js has no native Venn geometry. A "bubble" dataset sized to the real
// circle radius would work in principle, but Chart.js auto-reserves layout
// padding equal to the largest point radius on every side (so large bubbles
// never clip) — at this scale that padding eats almost the whole chart area.
// Instead the dataset stays a near-invisible placeholder (keeps `new Chart`
// idiomatic) and this plugin draws the three circles and their region labels
// directly onto the canvas, sized from `chart.chartArea` (native Chart.js
// plugin API — not an external library).
//
// Circle radii scale with sqrt(set total) (area proportional to size). Each
// pairwise center distance is then solved so the two-circle lens area
// matches that pair's real overlap count at the same area-per-reader scale
// — a true proportional derivation, not a fixed geometric factor. The third
// circle is triangulated from the two solved pairwise distances to its
// neighbors, so all three pairwise overlaps are simultaneously exact; the
// resulting triple-overlap lens is the geometric consequence of that
// triangle, and its label reports the real data-derived count.
const vennDiagram = {
  id: "vennDiagram",
  afterDatasetsDraw(chart) {
    const { ctx, chartArea: area } = chart;
    const width = area.right - area.left;
    const height = area.bottom - area.top;
    const cxMid = area.left + width / 2;
    const cyMid = area.top + height / 2;

    // Radii proportional to sqrt(total) so circle area scales with set size.
    const rFiction0 = height * 0.34;
    const k = rFiction0 / Math.sqrt(fictionTotal);
    const radii = sets.map((s) => k * Math.sqrt(s.total));
    const areaPerReader = Math.PI * k * k;

    const dAB = solveDistanceForArea(radii[0], radii[1], areaPerReader * fictionNonfiction);
    const dAC = solveDistanceForArea(radii[0], radii[2], areaPerReader * fictionMemoir);
    const dBC = solveDistanceForArea(radii[1], radii[2], areaPerReader * nonfictionMemoir);

    // Triangulate: A at origin, B on the x-axis at distance dAB, C placed so
    // its distances to A and B match dAC and dBC (standard trilateration).
    const localA = { x: 0, y: 0 };
    const localB = { x: dAB, y: 0 };
    const cx = (dAC * dAC - dBC * dBC + dAB * dAB) / (2 * dAB);
    const cy = Math.sqrt(Math.max(dAC * dAC - cx * cx, 0));
    const localC = { x: cx, y: cy };

    const centroid = {
      x: (localA.x + localB.x + localC.x) / 3,
      y: (localA.y + localB.y + localC.y) / 3,
    };
    const local = [localA, localB, localC].map((p) => ({ x: p.x - centroid.x, y: p.y - centroid.y }));

    // Fit the triangle + circles inside the chart area, leaving room for
    // set-name labels above/around the cluster.
    const labelMargin = 170;
    let minX = Infinity, maxX = -Infinity, minY = Infinity, maxY = -Infinity;
    local.forEach((p, i) => {
      minX = Math.min(minX, p.x - radii[i]);
      maxX = Math.max(maxX, p.x + radii[i]);
      minY = Math.min(minY, p.y - radii[i]);
      maxY = Math.max(maxY, p.y + radii[i]);
    });
    const bboxW = maxX - minX;
    const bboxH = maxY - minY;
    const fitScale = Math.min(
      (width - 2 * labelMargin) / bboxW,
      (height - 2 * labelMargin) / bboxH,
      1
    );

    // Canvas y grows downward; local y was built "up positive", so flip it.
    const centers = local.map((p, i) => ({
      x: cxMid + p.x * fitScale,
      y: cyMid - p.y * fitScale,
      r: radii[i] * fitScale,
    }));

    ctx.save();

    // Circles — drawn with translucent fill so overlaps blend visibly.
    centers.forEach((c, i) => {
      ctx.beginPath();
      ctx.arc(c.x, c.y, c.r, 0, Math.PI * 2);
      ctx.fillStyle = withAlpha(sets[i].color, 0.5);
      ctx.fill();
      ctx.lineWidth = 1.5;
      ctx.strokeStyle = withAlpha(sets[i].color, 0.9);
      ctx.stroke();
    });

    // Set names, placed radially outward from the cluster center so they
    // clear the neighboring circles regardless of triangle shape.
    ctx.textAlign = "center";
    ctx.textBaseline = "middle";
    sets.forEach((s, i) => {
      const c = centers[i];
      const [dx, dy] = normalize(c.x - cxMid, c.y - cyMid);
      const lx = c.x + dx * (c.r + 26);
      const ly = c.y + dy * (c.r + 26);
      ctx.fillStyle = t.ink;
      ctx.font = "bold 24px -apple-system, sans-serif";
      ctx.fillText(s.name, lx, ly);
    });

    // Region counts: one-per-set exclusive regions, the three pairwise-only
    // regions, and the triple overlap at the triangle centroid.
    const mid = (p, q) => ({ x: (p.x + q.x) / 2, y: (p.y + q.y) / 2 });
    const [A, B, C] = centers;
    const midAB = mid(A, B);
    const midAC = mid(A, C);
    const midBC = mid(B, C);
    const [dirAB_x, dirAB_y] = normalize(midAB.x - C.x, midAB.y - C.y);
    const [dirAC_x, dirAC_y] = normalize(midAC.x - B.x, midAC.y - B.y);
    const [dirBC_x, dirBC_y] = normalize(midBC.x - A.x, midBC.y - A.y);
    const [dirA_x, dirA_y] = normalize(A.x - cxMid, A.y - cyMid);
    const [dirB_x, dirB_y] = normalize(B.x - cxMid, B.y - cyMid);
    const [dirC_x, dirC_y] = normalize(C.x - cxMid, C.y - cyMid);

    const regions = [
      { count: onlyFiction, label: "Fiction only", x: A.x + dirA_x * A.r * 0.45, y: A.y + dirA_y * A.r * 0.45 },
      { count: onlyNonfiction, label: "Nonfiction only", x: B.x + dirB_x * B.r * 0.45, y: B.y + dirB_y * B.r * 0.45 },
      { count: onlyMemoir, label: "Memoir only", x: C.x + dirC_x * C.r * 0.45, y: C.y + dirC_y * C.r * 0.45 },
      { count: onlyFictionNonfiction, label: "Fiction & Nonfiction", x: midAB.x + dirAB_x * 22, y: midAB.y + dirAB_y * 22 },
      { count: onlyFictionMemoir, label: "Fiction & Memoir", x: midAC.x + dirAC_x * 22, y: midAC.y + dirAC_y * 22 },
      { count: onlyNonfictionMemoir, label: "Nonfiction & Memoir", x: midBC.x + dirBC_x * 22, y: midBC.y + dirBC_y * 22 },
      { count: allThree, label: "All three", x: cxMid, y: cyMid },
    ];
    regions.forEach((r) => {
      ctx.fillStyle = t.ink;
      ctx.font = "bold 26px -apple-system, sans-serif";
      ctx.fillText(String(r.count), r.x, r.y - 12);
      ctx.fillStyle = t.inkSoft;
      ctx.font = "13px -apple-system, sans-serif";
      ctx.fillText(r.label, r.x, r.y + 12);
    });

    ctx.restore();
  },
};

// --- Mount -------------------------------------------------------------------
const canvas = document.createElement("canvas");
document.getElementById("container").appendChild(canvas);

// --- Chart ---------------------------------------------------------------------
new Chart(canvas, {
  type: "bubble",
  data: {
    // Invisible placeholder points — the visible circles are hand-drawn by
    // vennDiagram above, sized to the actual chart area instead of Chart.js's
    // radius-based auto-padding.
    datasets: sets.map((s) => ({
      label: s.name,
      data: [{ x: 0, y: 0, r: 1 }],
      backgroundColor: "transparent",
      borderWidth: 0,
    })),
  },
  options: {
    responsive: true,
    maintainAspectRatio: false,
    animation: false,
    layout: { padding: { top: 20, bottom: 40, left: 40, right: 40 } },
    plugins: {
      title: {
        display: true,
        text: "venn-basic · javascript · chartjs · anyplot.ai",
        color: t.ink,
        font: { size: 22 },
        padding: { bottom: 4 },
      },
      subtitle: {
        display: true,
        text: `Reading habits of ${totalReaders} surveyed adults`,
        color: t.inkSoft,
        font: { size: 16 },
        padding: { bottom: 20 },
      },
      legend: { display: false },
      tooltip: { enabled: false },
    },
    scales: {
      x: { display: false, min: -1, max: 1 },
      y: { display: false, min: -1, max: 1 },
    },
  },
  plugins: [vennDiagram],
});
Runnable source as JSON, for any HTTP client: https://api.anyplot.ai/specs/venn-basic/chartjs/code. Any spec id and library id listed in llms-full.txt fit the same URL shape; every URL below is complete and callable.
{
  "spec_id": "venn-basic",
  "language": "javascript",
  "library": "chartjs",
  "page": "https://anyplot.ai/venn-basic/javascript/chartjs",
  "hub": "https://anyplot.ai/venn-basic",
  "code_json": "https://api.anyplot.ai/specs/venn-basic/chartjs/code",
  "spec_json": "https://api.anyplot.ai/specs/venn-basic",
  "render_light_png": "https://storage.googleapis.com/anyplot-images/plots/venn-basic/javascript/chartjs/plot-light.png",
  "render_dark_png": "https://storage.googleapis.com/anyplot-images/plots/venn-basic/javascript/chartjs/plot-dark.png",
  "interactive_light_html": "https://storage.googleapis.com/anyplot-images/plots/venn-basic/javascript/chartjs/plot-light.html",
  "interactive_dark_html": "https://storage.googleapis.com/anyplot-images/plots/venn-basic/javascript/chartjs/plot-dark.html",
  "quality_score": 93.0,
  "license": "MIT",
  "guide": "https://anyplot.ai/llms.txt"
}
Part of Venn Diagram on anyplot.ai.