The same plot in 14 other libraries — JavaScript: Chart.js, D3.js, Highcharts, MUI X Charts; Python: Altair, Bokeh, lets-plot, Matplotlib, Plotly, plotnine, Pygal, Seaborn; R: ggplot2; Julia: Makie.jl. Compare all 15 side by side: Venn Diagram in Python, R, Julia and JavaScript.
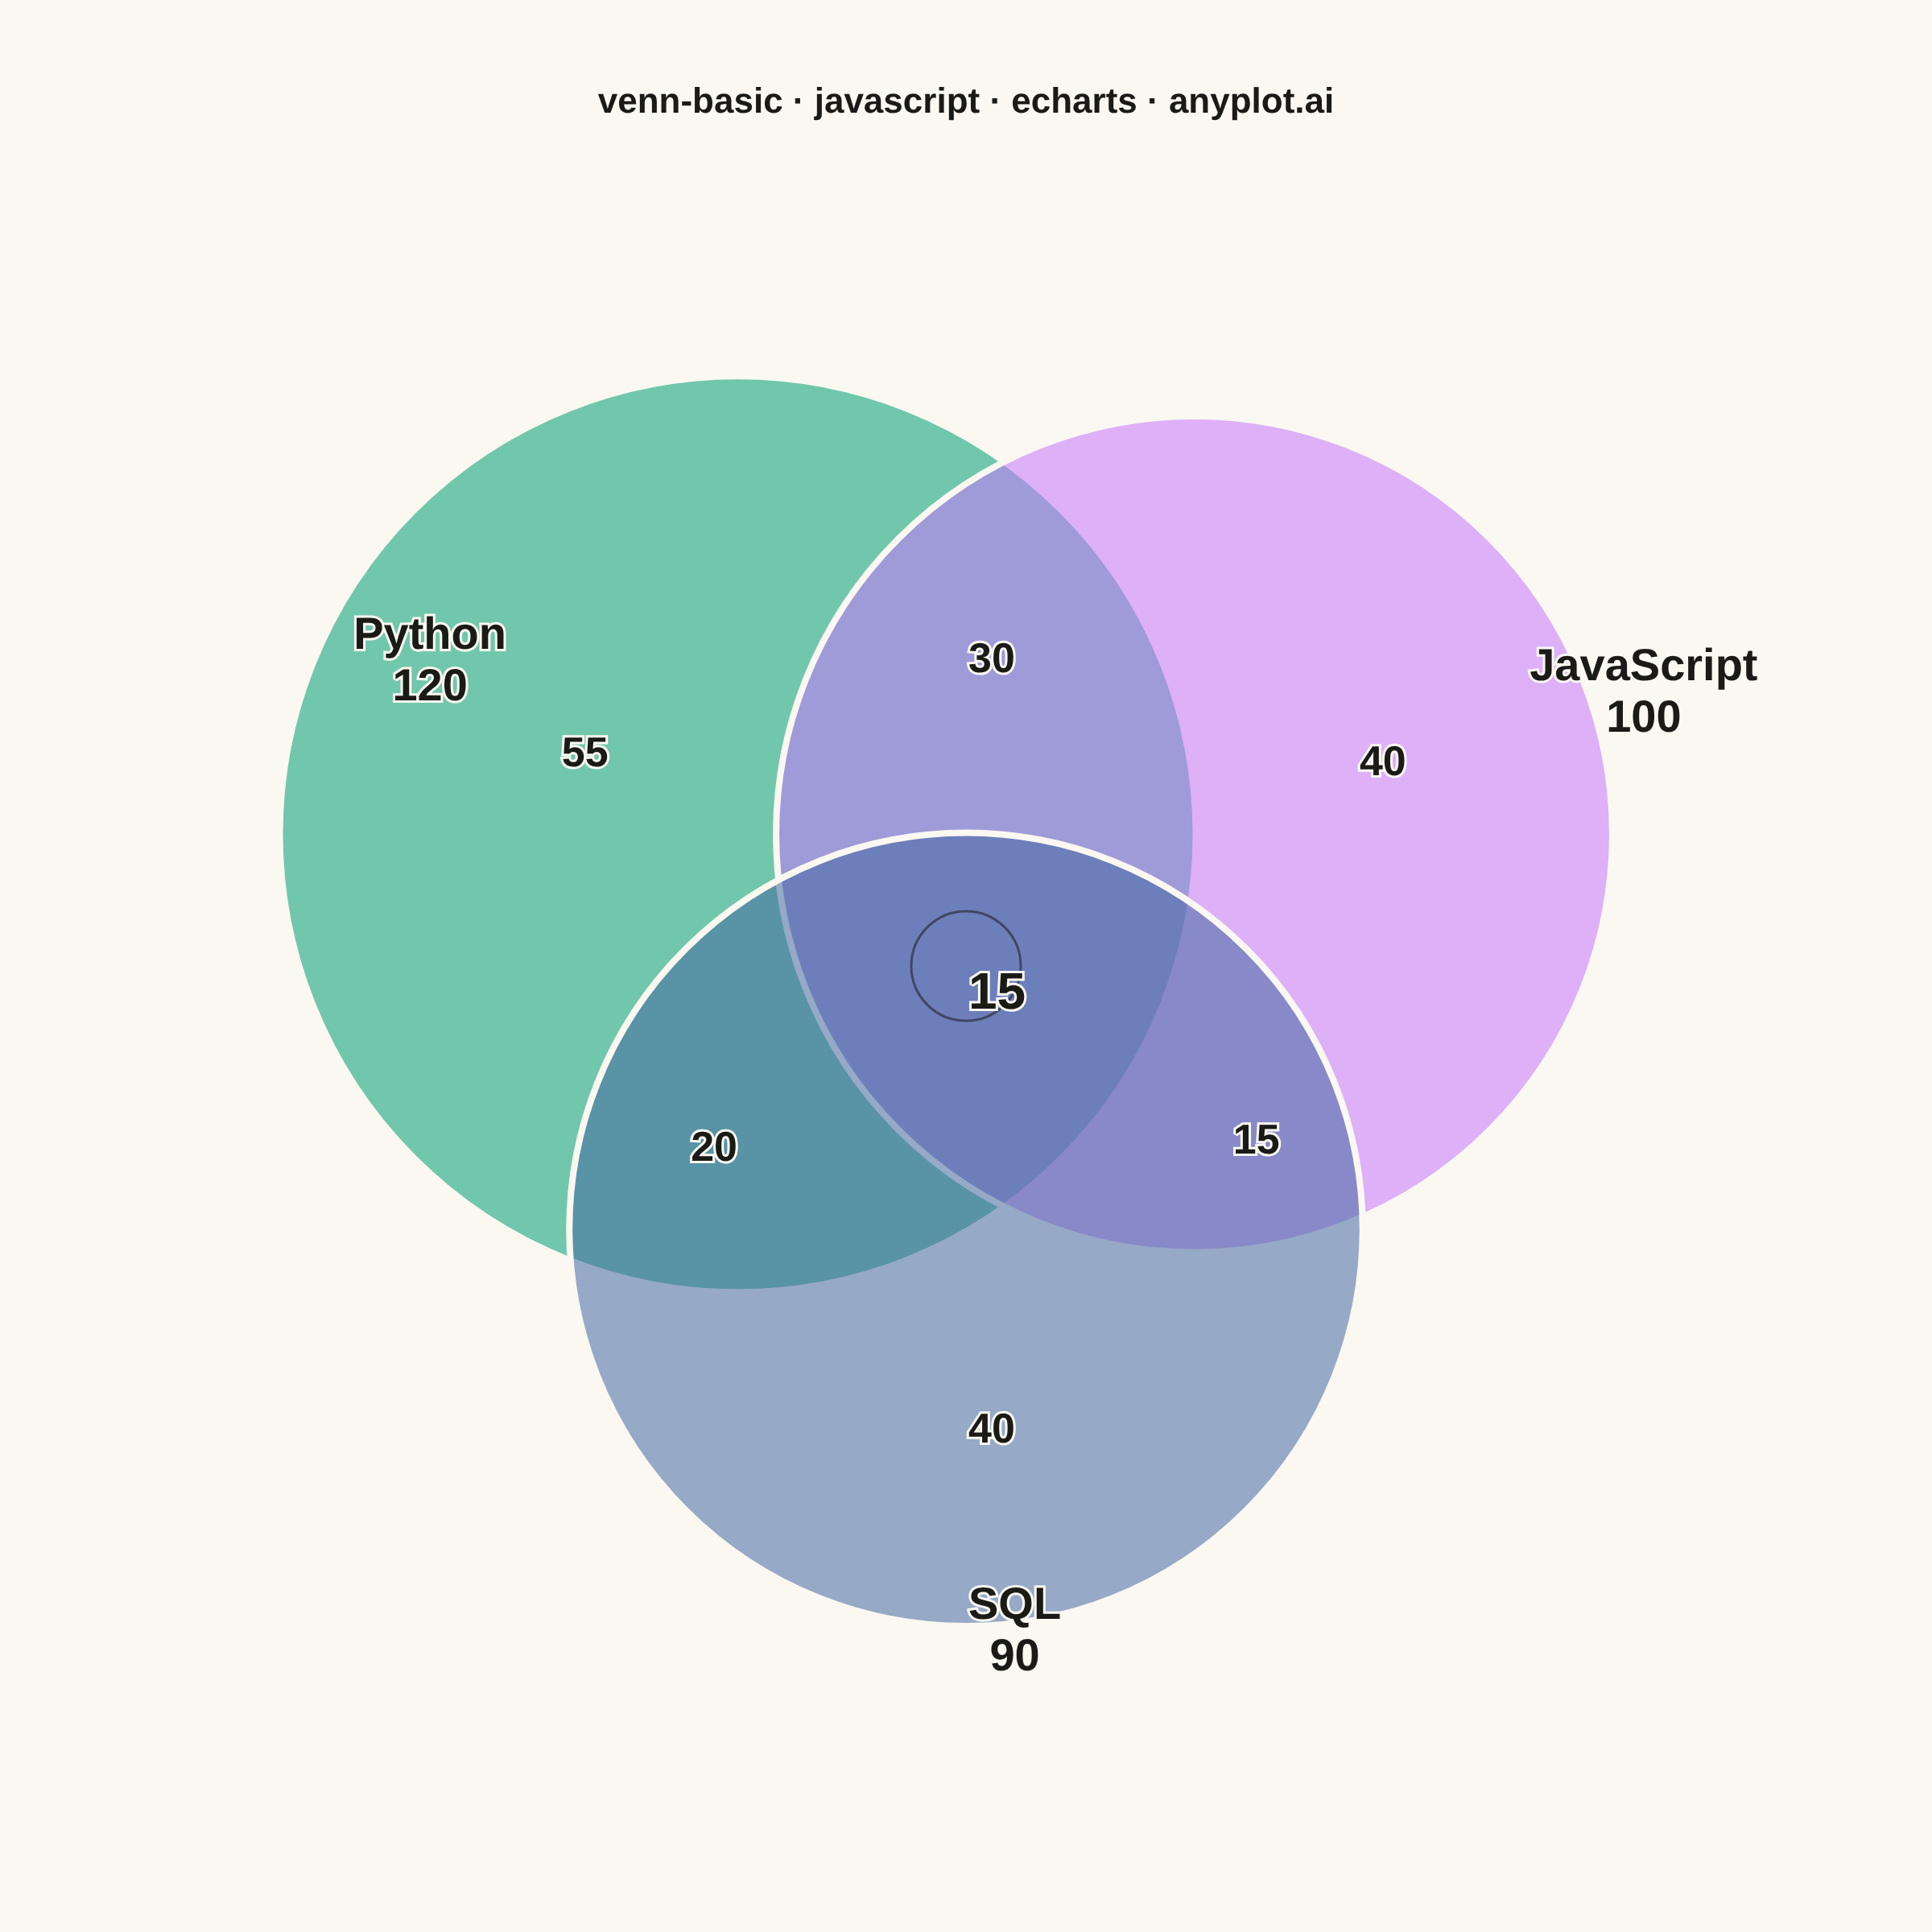
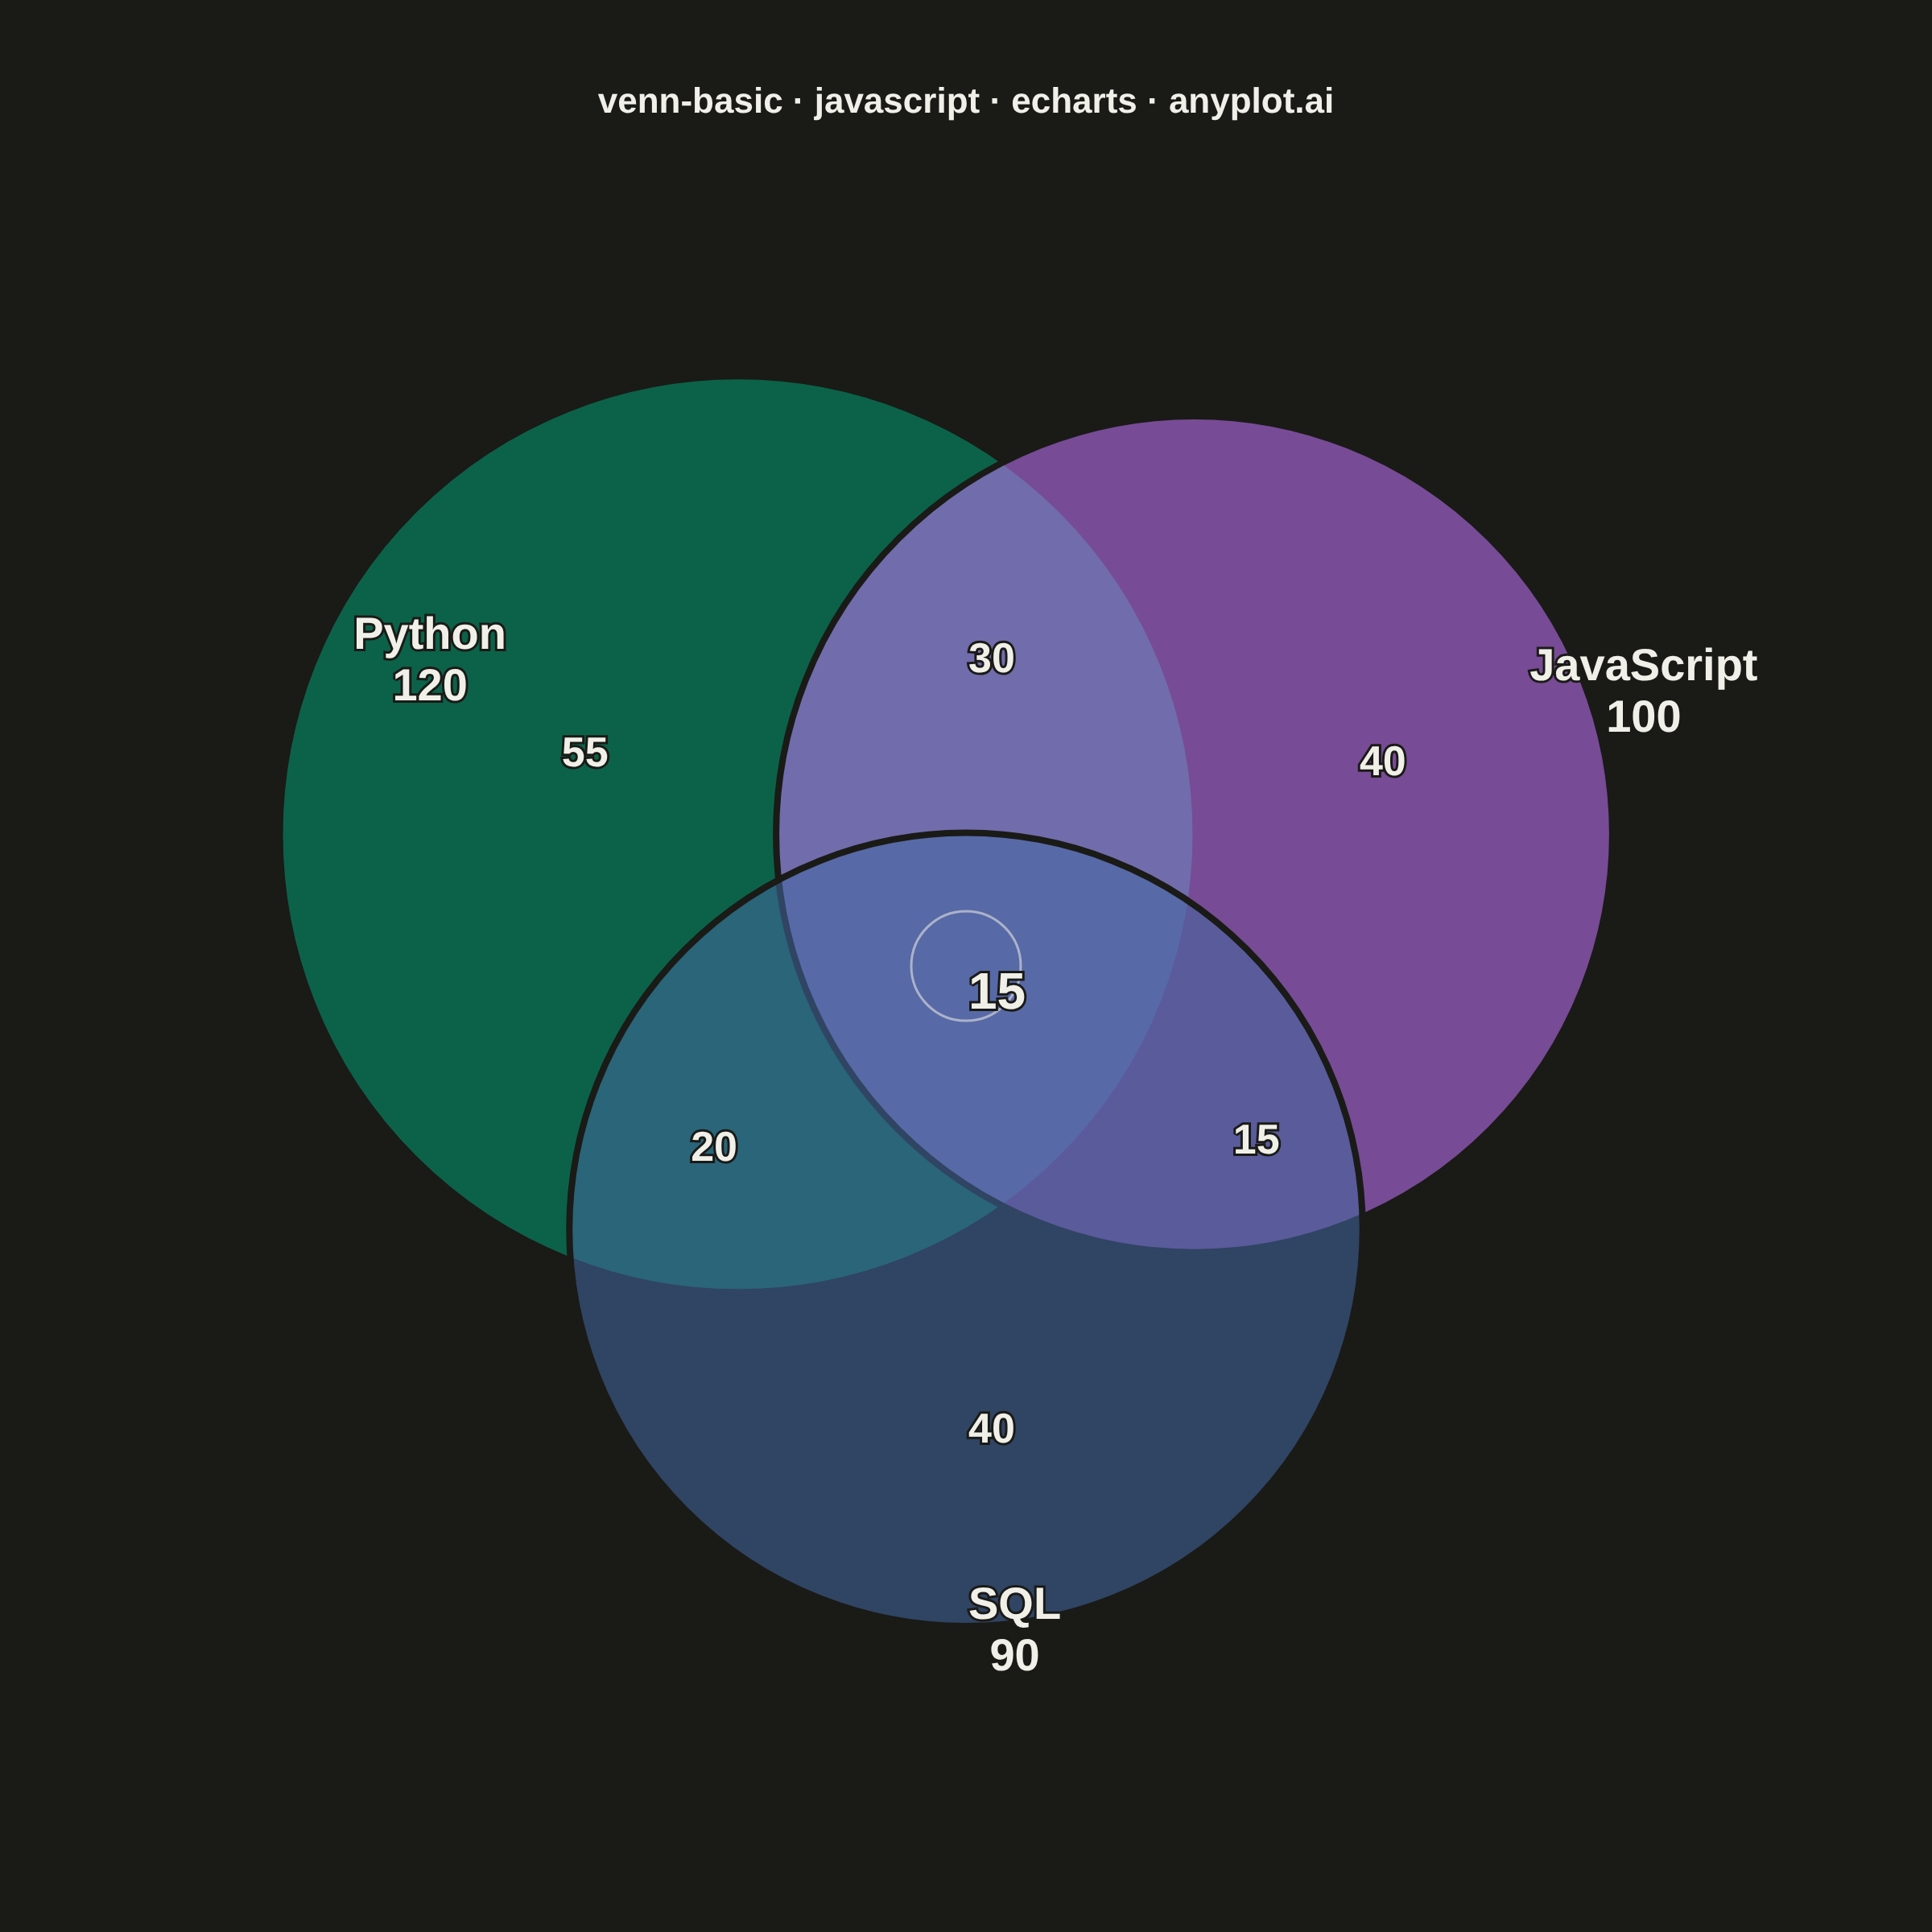
A Venn diagram visualizes the logical relationships between two or three sets using overlapping circles. Each circle represents a set, and overlapping regions show elements shared between sets. This classic visualization is ideal for showing intersections, unions, and exclusive memberships, making abstract set relationships immediately intuitive.
// anyplot.ai
// venn-basic: Venn Diagram
// Library: echarts 6.1.0 | JavaScript 22.23.2
// Quality: 94/100 | Created: 2026-09-09
//# anyplot-orientation: square

const t = window.ANYPLOT_TOKENS;
const { width, height } = window.ANYPLOT_SIZE;

// --- Data (in-memory, deterministic) ----------------------------------------
// Primary programming languages reported by software engineers in a skills
// survey. Each set is the total engineers who know that language; the
// overlap counts are the engineers who know two or all three.
const SET_A = { name: "Python", total: 120, color: t.palette[0] };
const SET_B = { name: "JavaScript", total: 100, color: t.palette[1] };
const SET_C = { name: "SQL", total: 90, color: t.palette[2] };

const REGIONS = {
  aOnly: 55,
  bOnly: 40,
  cOnly: 40,
  abOnly: 30,
  acOnly: 20,
  bcOnly: 15,
  abc: 15,
};

// --- Geometry -----------------------------------------------------------
// Symmetric 3-circle layout: centers sit on a small circle around the
// canvas center, 120 degrees apart. Each circle's radius is scaled by
// sqrt(set total / average total) so the diagram visually hints at the
// differing set sizes (proportional/Euler-style approximation) instead of
// three identical circles. Region labels are placed along the same radial
// directions at hand-tuned radii - scaled to each region's own circle(s)
// so they still land inside the intended lens/petal without touching
// neighbors now that radii differ.
const cx = width / 2;
const cy = height / 2;
const r = Math.min(width, height) * 0.22;
const centerOffset = r * 0.62;

const AVG_TOTAL = (SET_A.total + SET_B.total + SET_C.total) / 3;
const radiusFor = (total) => r * Math.sqrt(total / AVG_TOTAL);
const RADIUS_A = radiusFor(SET_A.total);
const RADIUS_B = radiusFor(SET_B.total);
const RADIUS_C = radiusFor(SET_C.total);
const RADII = [RADIUS_A, RADIUS_B, RADIUS_C];

const polar = (angleDeg, radius) => ({
  x: cx + radius * Math.cos((angleDeg * Math.PI) / 180),
  y: cy - radius * Math.sin((angleDeg * Math.PI) / 180),
});

const ANGLE_A = 150;
const ANGLE_B = 30;
const ANGLE_C = 270;
const ANGLE_AB = 90;
const ANGLE_AC = 210;
const ANGLE_BC = 330;

const CIRCLE_A = polar(ANGLE_A, centerOffset);
const CIRCLE_B = polar(ANGLE_B, centerOffset);
const CIRCLE_C = polar(ANGLE_C, centerOffset);

const onlyLabelRadiusFor = (radius) => centerOffset + radius * 0.45;
const pairLabelRadiusFor = (radiusI, radiusJ) => ((radiusI + radiusJ) / 2) * 0.75;

// Nudged up from the canonical 0.5 midpoint so each additional overlapping
// circle adds more opacity - single/double/triple regions stay distinct by
// lightness alone, which keeps them distinguishable under CVD simulation
// even when the blended hues are hard to tell apart.
const OVERLAP_ALPHA = 0.55;

const hexToRgba = (hex, alpha) => {
  const n = parseInt(hex.slice(1), 16);
  const red = (n >> 16) & 255;
  const green = (n >> 8) & 255;
  const blue = n & 255;
  return `rgba(${red}, ${green}, ${blue}, ${alpha})`;
};

// --- Title --------------------------------------------------------------
const TITLE = "venn-basic · javascript · echarts · anyplot.ai";
const titleFontSize = TITLE.length > 67 ? Math.round(22 * (67 / TITLE.length)) : 22;

// --- Graphic elements -----------------------------------------------------
const circles = [SET_A, SET_B, SET_C].map((set, i) => {
  const centerPoint = [CIRCLE_A, CIRCLE_B, CIRCLE_C][i];
  return {
    type: "circle",
    shape: { cx: centerPoint.x, cy: centerPoint.y, r: RADII[i] },
    style: {
      fill: hexToRgba(set.color, OVERLAP_ALPHA),
      stroke: t.pageBg,
      lineWidth: 4,
    },
    z: 2,
  };
});

const setLabels = [SET_A, SET_B, SET_C].map((set, i) => {
  const angle = [ANGLE_A, ANGLE_B, ANGLE_C][i];
  const pos = polar(angle, RADII[i] * 1.55);
  return {
    type: "text",
    left: pos.x,
    top: pos.y,
    style: {
      text: `${set.name}\n${set.total}`,
      fill: t.ink,
      stroke: t.pageBg,
      lineWidth: 3,
      font: "bold 28px sans-serif",
      textAlign: "center",
      textVerticalAlign: "middle",
      lineHeight: 32,
    },
    z: 5,
  };
});

const regionLabelSpecs = [
  { count: REGIONS.aOnly, pos: polar(ANGLE_A, onlyLabelRadiusFor(RADIUS_A)) },
  { count: REGIONS.bOnly, pos: polar(ANGLE_B, onlyLabelRadiusFor(RADIUS_B)) },
  { count: REGIONS.cOnly, pos: polar(ANGLE_C, onlyLabelRadiusFor(RADIUS_C)) },
  { count: REGIONS.abOnly, pos: polar(ANGLE_AB, pairLabelRadiusFor(RADIUS_A, RADIUS_B)) },
  { count: REGIONS.acOnly, pos: polar(ANGLE_AC, pairLabelRadiusFor(RADIUS_A, RADIUS_C)) },
  { count: REGIONS.bcOnly, pos: polar(ANGLE_BC, pairLabelRadiusFor(RADIUS_B, RADIUS_C)) },
];

const regionLabels = regionLabelSpecs.map((region) => ({
  type: "text",
  left: region.pos.x,
  top: region.pos.y,
  style: {
    text: String(region.count),
    fill: t.ink,
    stroke: t.pageBg,
    lineWidth: 3,
    font: "bold 26px sans-serif",
    textAlign: "center",
    textVerticalAlign: "middle",
  },
  z: 5,
}));

// Focal point: the triple-overlap is the smallest and most noteworthy
// relationship (engineers who know all three languages) - a subtle ring
// plus a larger, bolder count gives it visual weight instead of treating
// all seven regions identically.
const abcRing = {
  type: "circle",
  shape: { cx, cy, r: 34 },
  style: { fill: "transparent", stroke: t.ink, lineWidth: 1.5, opacity: 0.55 },
  z: 4,
};

const abcLabel = {
  type: "text",
  left: cx,
  top: cy,
  style: {
    text: String(REGIONS.abc),
    fill: t.ink,
    stroke: t.pageBg,
    lineWidth: 3,
    font: "bold 32px sans-serif",
    textAlign: "center",
    textVerticalAlign: "middle",
  },
  z: 6,
};

// --- Init + option ------------------------------------------------------
const chart = echarts.init(document.getElementById("container"));

chart.setOption({
  animation: false,
  backgroundColor: "transparent",
  title: {
    text: TITLE,
    left: "center",
    top: height * 0.04,
    textStyle: { color: t.ink, fontSize: titleFontSize },
  },
  graphic: {
    elements: [...circles, ...setLabels, ...regionLabels, abcRing, abcLabel],
  },
});
Runnable source as JSON, for any HTTP client: https://api.anyplot.ai/specs/venn-basic/echarts/code. Any spec id and library id listed in llms-full.txt fit the same URL shape; every URL below is complete and callable.
{
  "spec_id": "venn-basic",
  "language": "javascript",
  "library": "echarts",
  "page": "https://anyplot.ai/venn-basic/javascript/echarts",
  "hub": "https://anyplot.ai/venn-basic",
  "code_json": "https://api.anyplot.ai/specs/venn-basic/echarts/code",
  "spec_json": "https://api.anyplot.ai/specs/venn-basic",
  "render_light_png": "https://storage.googleapis.com/anyplot-images/plots/venn-basic/javascript/echarts/plot-light.png",
  "render_dark_png": "https://storage.googleapis.com/anyplot-images/plots/venn-basic/javascript/echarts/plot-dark.png",
  "interactive_light_html": "https://storage.googleapis.com/anyplot-images/plots/venn-basic/javascript/echarts/plot-light.html",
  "interactive_dark_html": "https://storage.googleapis.com/anyplot-images/plots/venn-basic/javascript/echarts/plot-dark.html",
  "quality_score": 94.0,
  "license": "MIT",
  "guide": "https://anyplot.ai/llms.txt"
}
Part of Venn Diagram on anyplot.ai.