The same plot in 14 other libraries — JavaScript: Chart.js, D3.js, Apache ECharts, Highcharts; Python: Altair, Bokeh, lets-plot, Matplotlib, Plotly, plotnine, Pygal, Seaborn; R: ggplot2; Julia: Makie.jl. Compare all 15 side by side: Venn Diagram in Python, R, Julia and JavaScript.
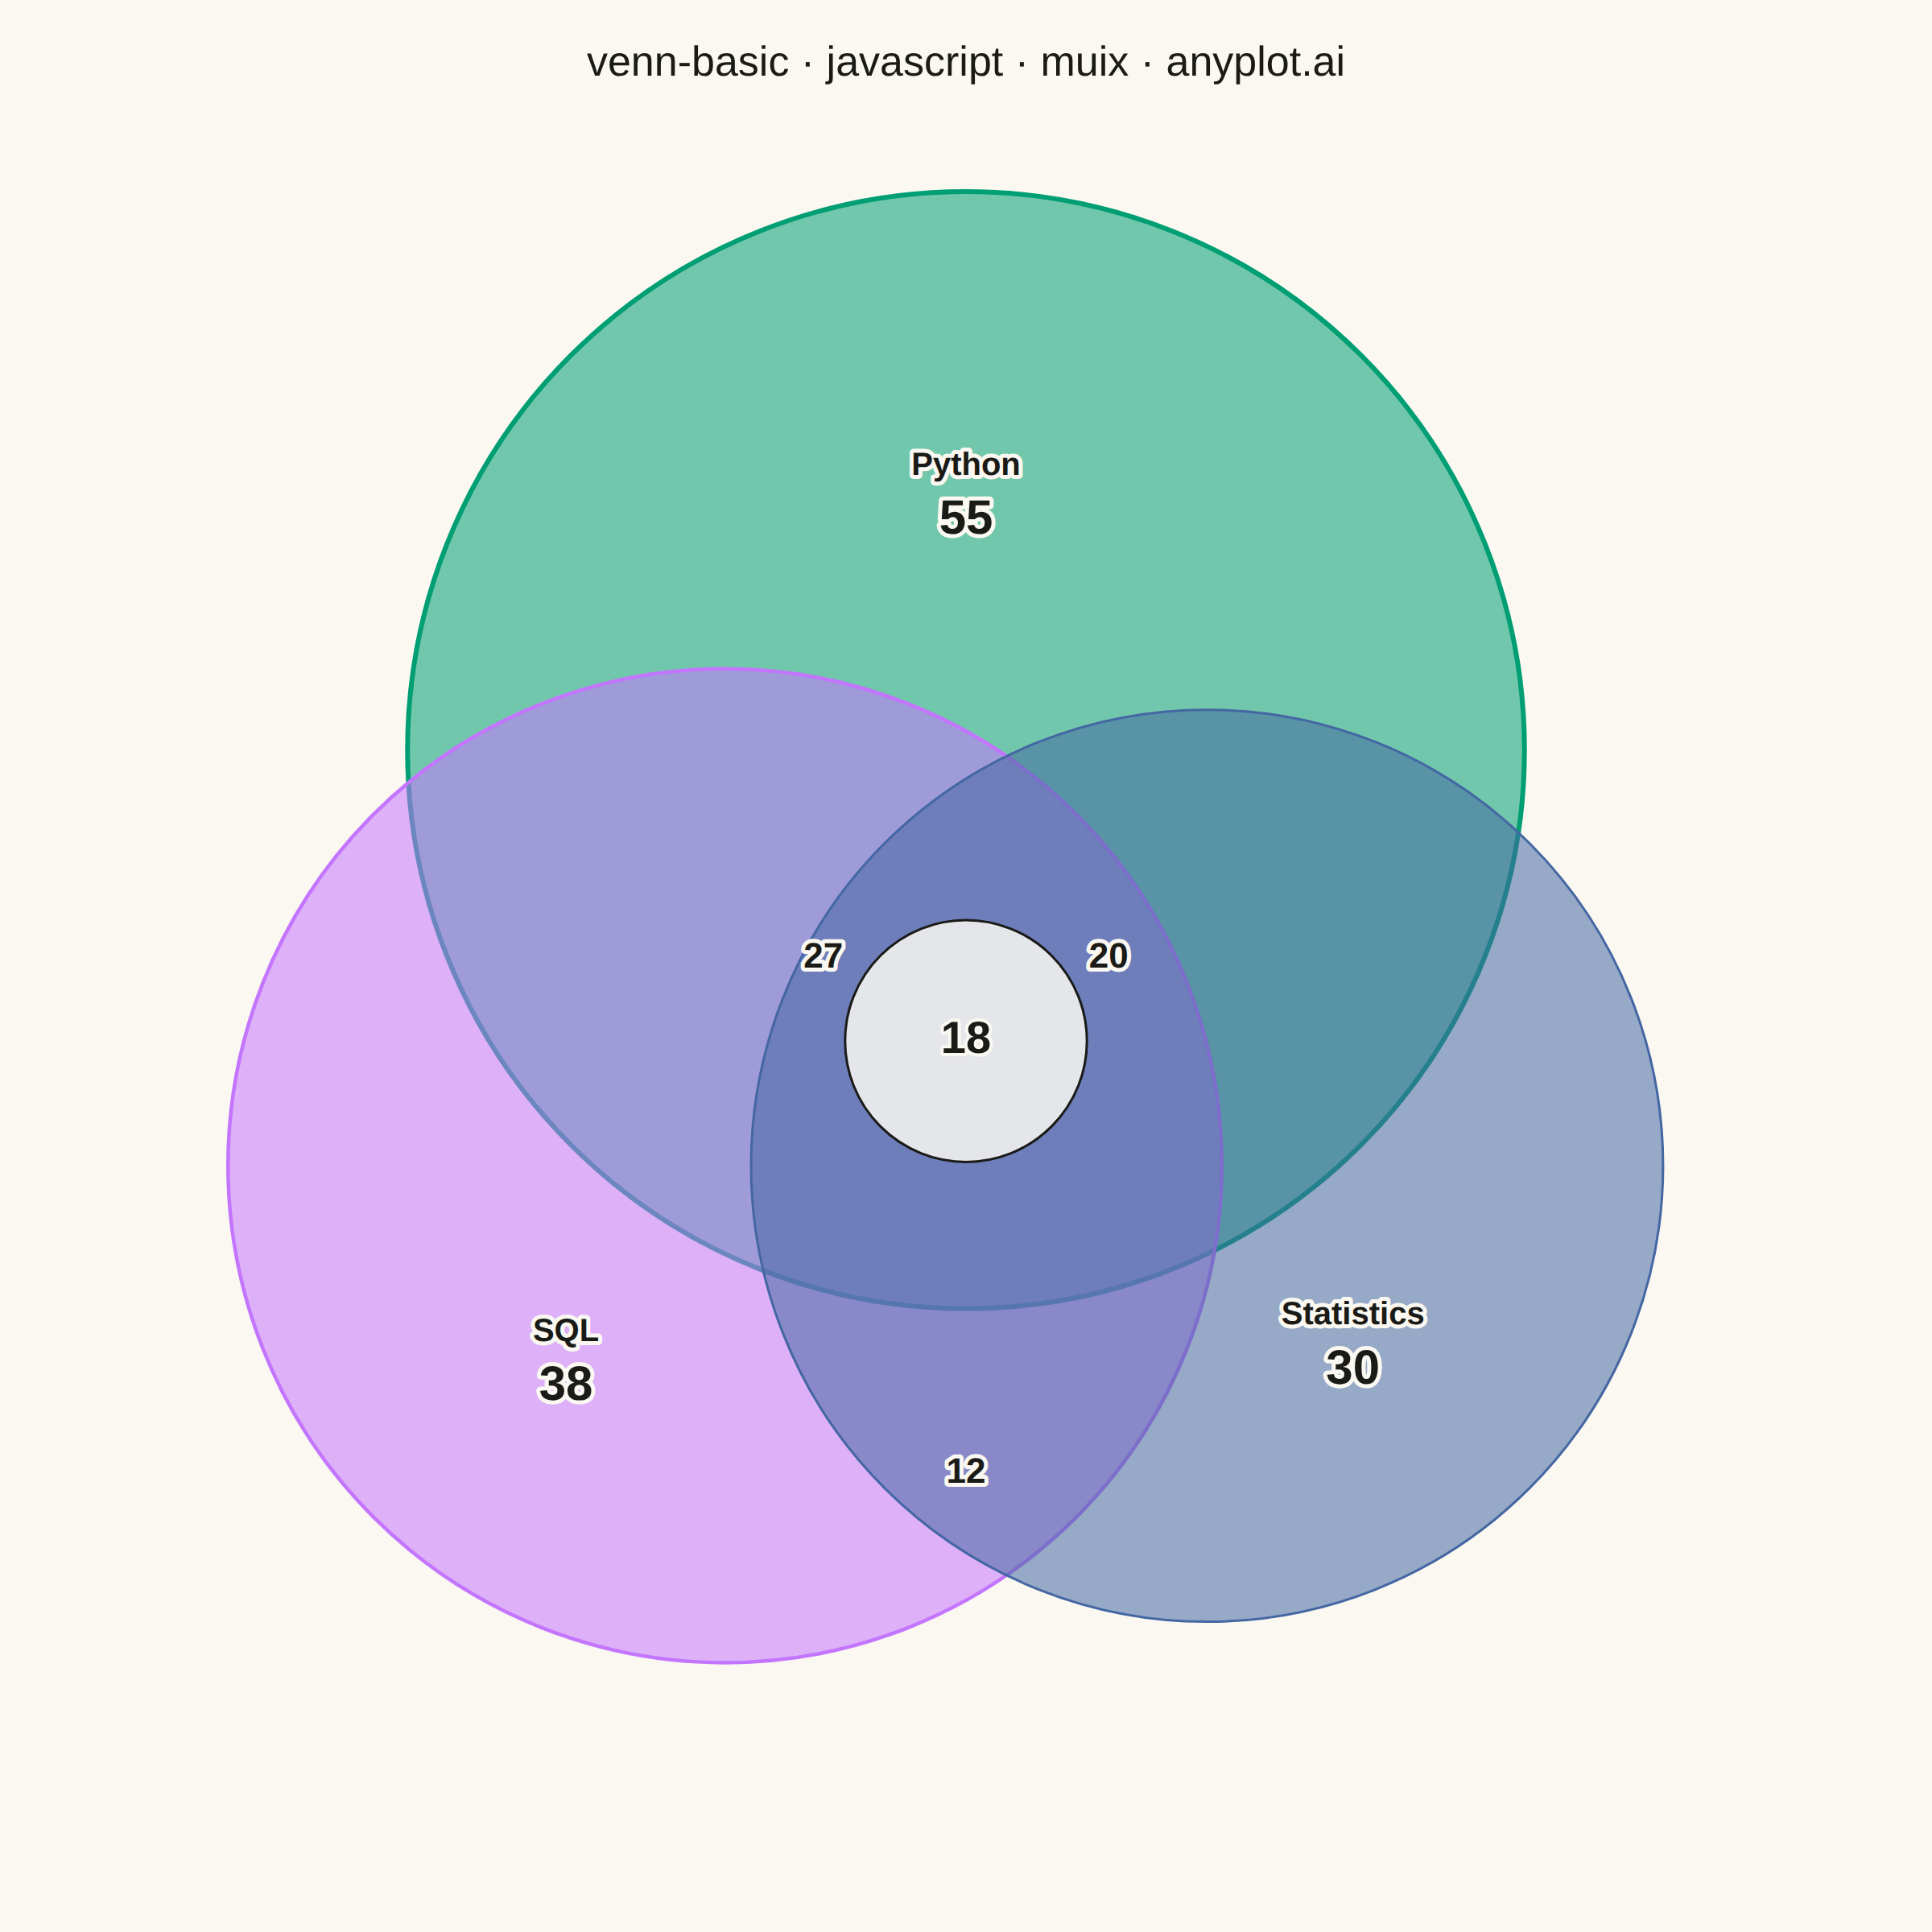
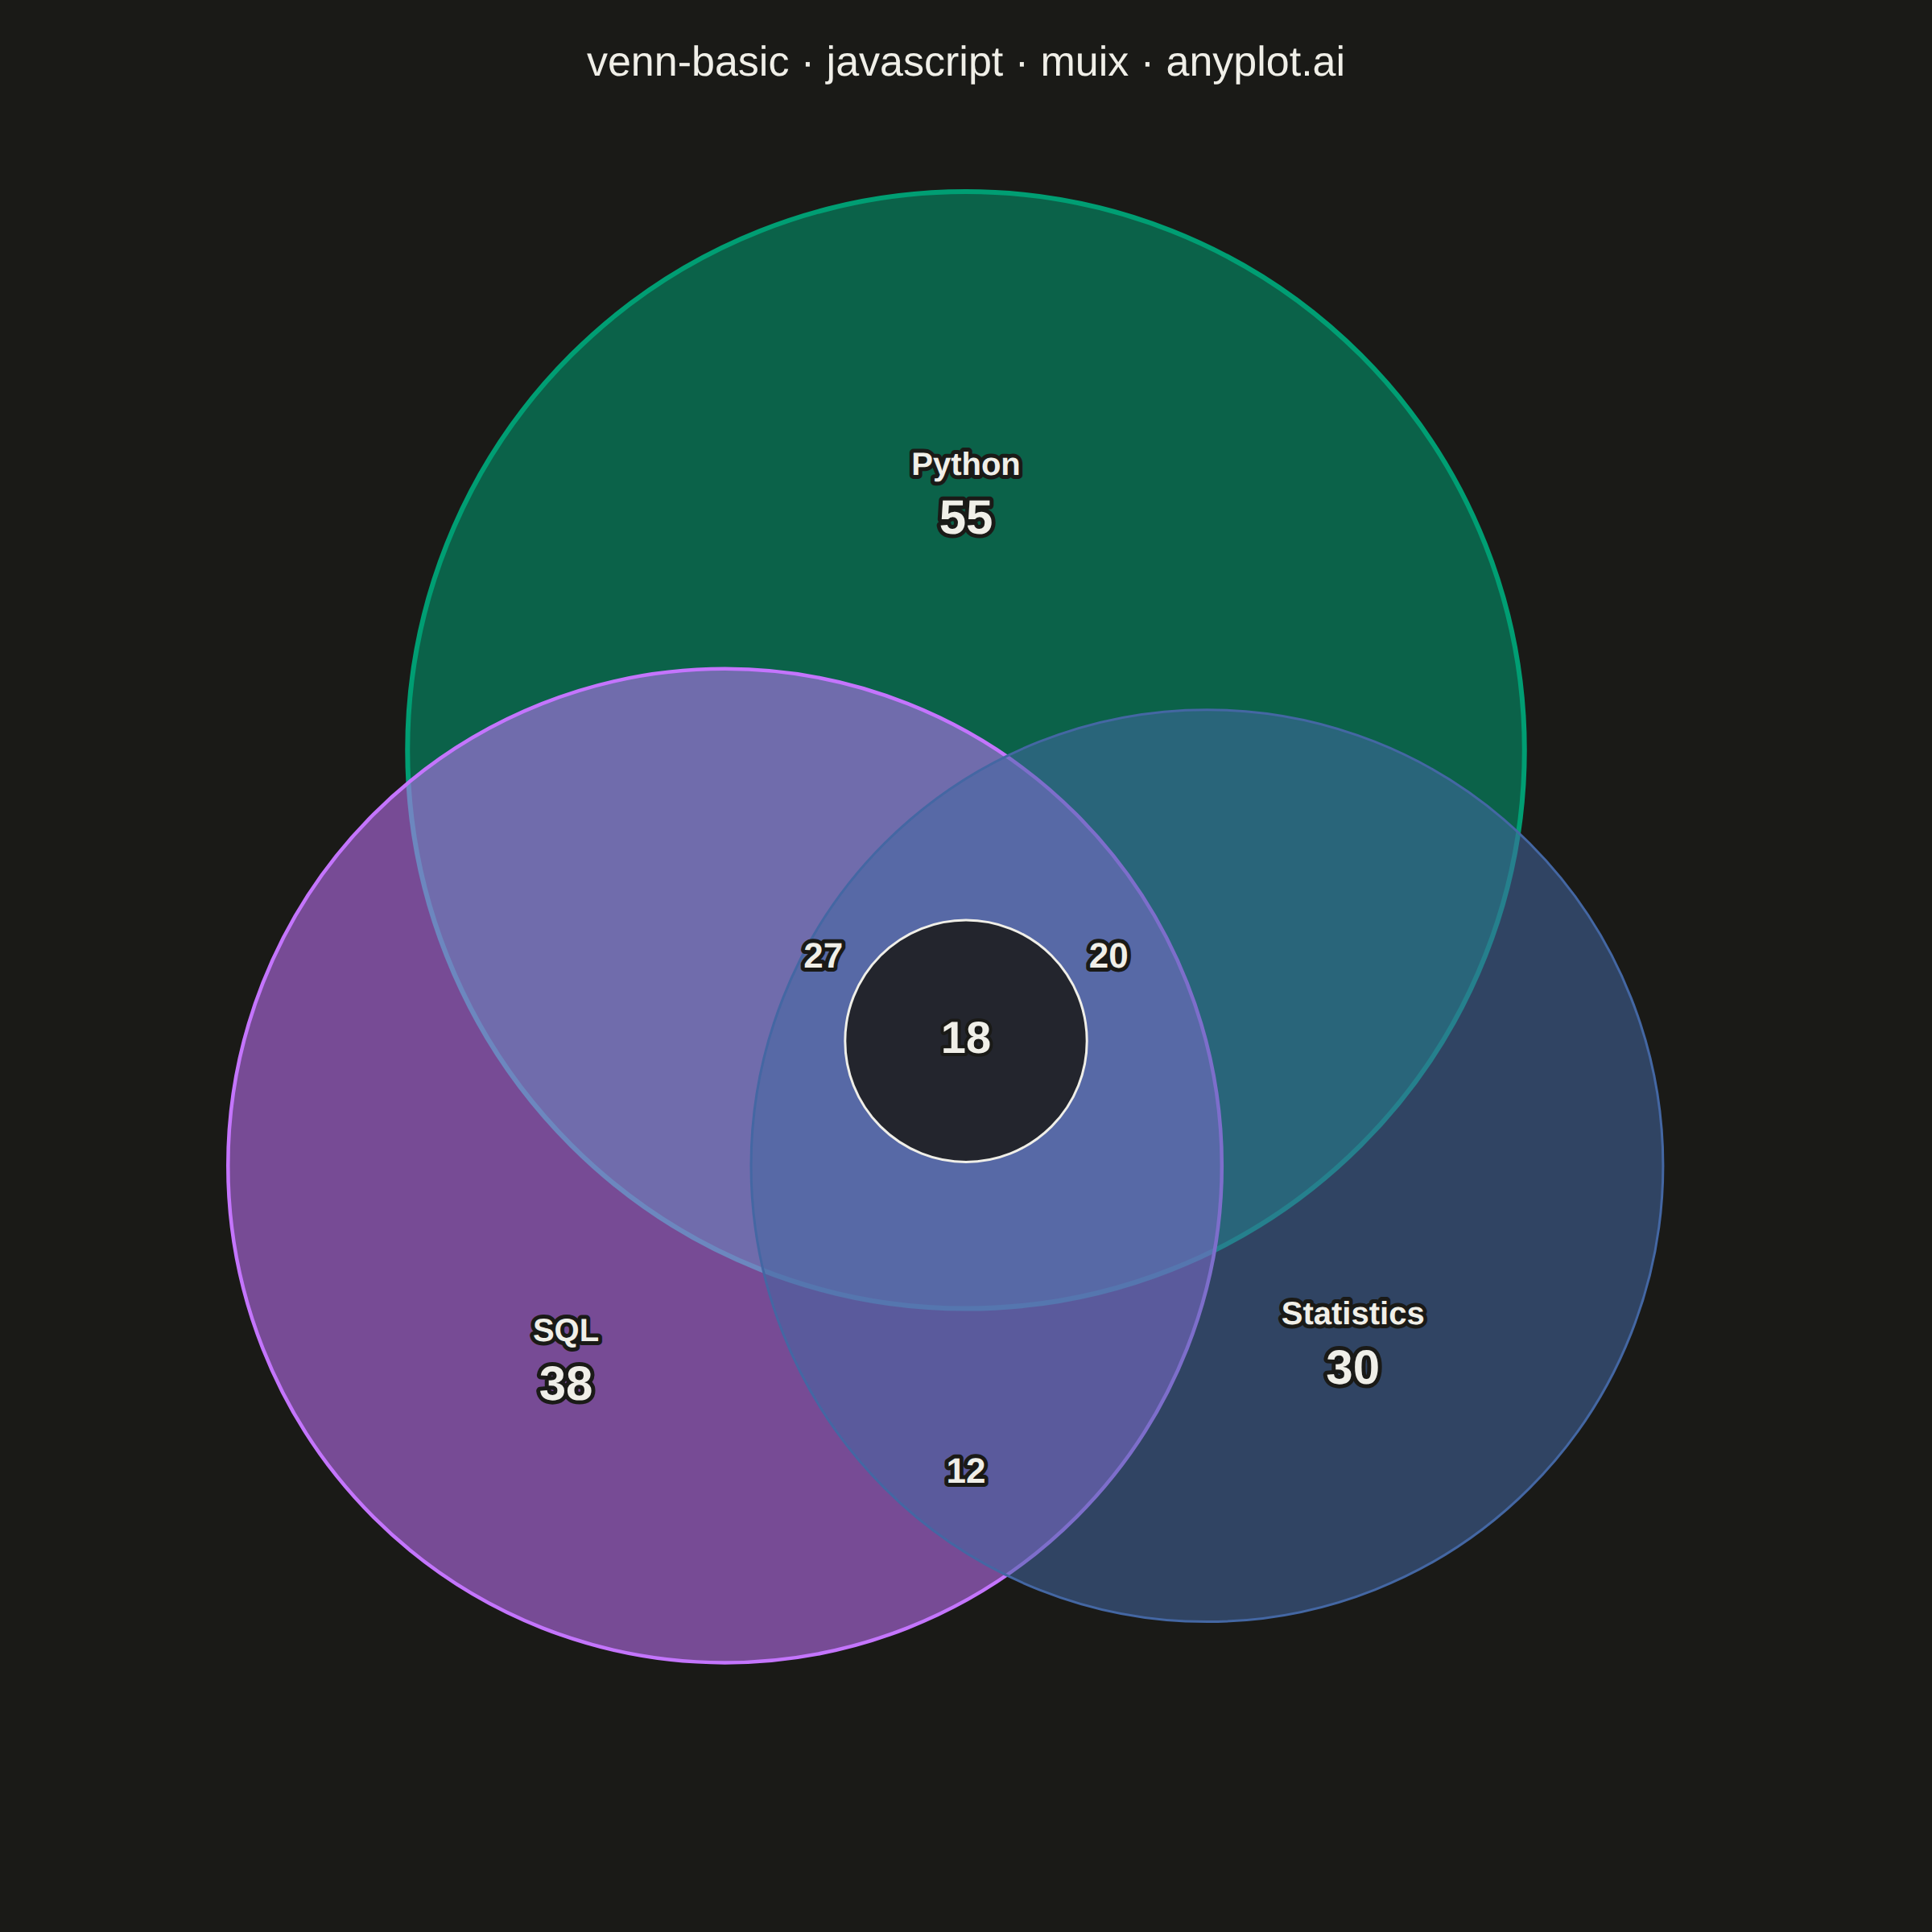
A Venn diagram visualizes the logical relationships between two or three sets using overlapping circles. Each circle represents a set, and overlapping regions show elements shared between sets. This classic visualization is ideal for showing intersections, unions, and exclusive memberships, making abstract set relationships immediately intuitive.
// anyplot.ai
// venn-basic: Venn Diagram
// Library: muix 7.29.1 | JavaScript 22.23.2
// Quality: 92/100 | Created: 2026-09-09
//# anyplot-orientation: square
import * as React from "react";
import Box from "@mui/material/Box";
import Typography from "@mui/material/Typography";
import { ChartContainer } from "@mui/x-charts/ChartContainer";
import { useDrawingArea } from "@mui/x-charts/hooks";

const t = window.ANYPLOT_TOKENS;

// --- Data (in-memory, deterministic) ----------------------------------------
// Skill overlap across a 200-person data team.
const setLabels = ["Python", "SQL", "Statistics"];
const setSizes = [120, 95, 80];
const pairAB = 45; // Python & SQL
const pairAC = 38; // Python & Statistics
const pairBC = 30; // SQL & Statistics
const tripleABC = 18; // all three

const onlyA = setSizes[0] - pairAB - pairAC + tripleABC;
const onlyB = setSizes[1] - pairAB - pairBC + tripleABC;
const onlyC = setSizes[2] - pairAC - pairBC + tripleABC;
const onlyAB = pairAB - tripleABC;
const onlyAC = pairAC - tripleABC;
const onlyBC = pairBC - tripleABC;

const seriesColors = [t.palette[0], t.palette[1], t.palette[2]];

// --- Custom SVG marks, placed via ChartContainer's drawing area -------------
// MUI X community has no native Venn primitive, so this follows MUI X's
// documented composition pattern (ChartContainer + useDrawingArea) to
// hand-place plain SVG circles/text inside the theme-aware ChartsSurface.
function VennMarks() {
  const area = useDrawingArea();
  const cx = area.left + area.width / 2;
  const cy = area.top + area.height / 2;

  const maxRadius = Math.min(area.width, area.height) * 0.32;
  const scale = maxRadius / Math.sqrt(Math.max(...setSizes));
  const radii = setSizes.map((size) => Math.sqrt(size) * scale);
  const avgRadius = (radii[0] + radii[1] + radii[2]) / 3;
  const offset = avgRadius * 0.55;

  const centers = [
    { x: cx, y: cy - offset },
    { x: cx - offset * 0.87, y: cy + offset * 0.5 },
    { x: cx + offset * 0.87, y: cy + offset * 0.5 },
  ];

  const textProps = {
    textAnchor: "middle" as const,
    dominantBaseline: "middle" as const,
    fill: t.ink,
    paintOrder: "stroke" as const,
    stroke: t.pageBg,
    strokeWidth: 5,
    strokeLinejoin: "round" as const,
  };

  const onlyRegions = [
    { name: setLabels[0], count: onlyA, x: centers[0].x, y: centers[0].y - radii[0] * 0.45 },
    { name: setLabels[1], count: onlyB, x: centers[1].x - radii[1] * 0.32, y: centers[1].y + radii[1] * 0.4 },
    { name: setLabels[2], count: onlyC, x: centers[2].x + radii[2] * 0.32, y: centers[2].y + radii[2] * 0.4 },
  ];

  const pairOverlapRegions = [
    { count: onlyAB, x: (centers[0].x + centers[1].x) / 2 - offset * 0.08, y: (centers[0].y + centers[1].y) / 2 },
    { count: onlyAC, x: (centers[0].x + centers[2].x) / 2 + offset * 0.08, y: (centers[0].y + centers[2].y) / 2 },
    { count: onlyBC, x: cx, y: centers[1].y + radii[1] * 0.62 },
  ];

  const tripleX = cx;
  const tripleY = cy + offset * 0.05;
  const calloutRadius = avgRadius * 0.24;
  const circleStrokeWidths = [3, 2.25, 1.5];

  return (
    <>
      {centers.map((c, i) => (
        <circle
          key={setLabels[i]}
          cx={c.x}
          cy={c.y}
          r={radii[i]}
          fill={seriesColors[i]}
          fillOpacity={0.55}
          stroke={seriesColors[i]}
          strokeWidth={circleStrokeWidths[i]}
        />
      ))}
      {onlyRegions.map((r) => (
        <React.Fragment key={r.name}>
          <text {...textProps} x={r.x} y={r.y - 20} fontSize={20} fontWeight={600}>
            {r.name}
          </text>
          <text {...textProps} x={r.x} y={r.y + 14} fontSize={30} fontWeight={700}>
            {r.count}
          </text>
        </React.Fragment>
      ))}
      {pairOverlapRegions.map((r, i) => (
        <text key={i} {...textProps} x={r.x} y={r.y} fontSize={22} fontWeight={600}>
          {r.count}
        </text>
      ))}
      {/* Callout badge on the triple overlap — the diagram's focal point. */}
      <circle
        cx={tripleX}
        cy={tripleY}
        r={calloutRadius}
        fill={t.pageBg}
        fillOpacity={0.85}
        stroke={t.ink}
        strokeWidth={1.5}
      />
      <text {...textProps} x={tripleX} y={tripleY} fontSize={28} fontWeight={800} strokeWidth={4}>
        {tripleABC}
      </text>
    </>
  );
}

// --- Chart (default-exported component — the harness mounts it) -------------
export default function Chart() {
  const width = window.ANYPLOT_SIZE.width;
  const height = window.ANYPLOT_SIZE.height;
  const titleHeight = 76;

  return (
    <Box sx={{ width, height, display: "flex", flexDirection: "column" }}>
      <Typography
        sx={{
          height: titleHeight,
          display: "flex",
          alignItems: "center",
          justifyContent: "center",
          fontSize: 26,
          fontWeight: 500,
          color: t.ink,
        }}
      >
        venn-basic · javascript · muix · anyplot.ai
      </Typography>
      <ChartContainer
        width={width}
        height={height - titleHeight}
        margin={{ top: 20, bottom: 20, left: 20, right: 20 }}
        series={[]}
        skipAnimation
      >
        <VennMarks />
      </ChartContainer>
    </Box>
  );
}
Runnable source as JSON, for any HTTP client: https://api.anyplot.ai/specs/venn-basic/muix/code. Any spec id and library id listed in llms-full.txt fit the same URL shape; every URL below is complete and callable.
{
  "spec_id": "venn-basic",
  "language": "javascript",
  "library": "muix",
  "page": "https://anyplot.ai/venn-basic/javascript/muix",
  "hub": "https://anyplot.ai/venn-basic",
  "code_json": "https://api.anyplot.ai/specs/venn-basic/muix/code",
  "spec_json": "https://api.anyplot.ai/specs/venn-basic",
  "render_light_png": "https://storage.googleapis.com/anyplot-images/plots/venn-basic/javascript/muix/plot-light.png",
  "render_dark_png": "https://storage.googleapis.com/anyplot-images/plots/venn-basic/javascript/muix/plot-dark.png",
  "interactive_light_html": "https://storage.googleapis.com/anyplot-images/plots/venn-basic/javascript/muix/plot-light.html",
  "interactive_dark_html": "https://storage.googleapis.com/anyplot-images/plots/venn-basic/javascript/muix/plot-dark.html",
  "quality_score": 92.0,
  "license": "MIT",
  "guide": "https://anyplot.ai/llms.txt"
}
Part of Venn Diagram on anyplot.ai.