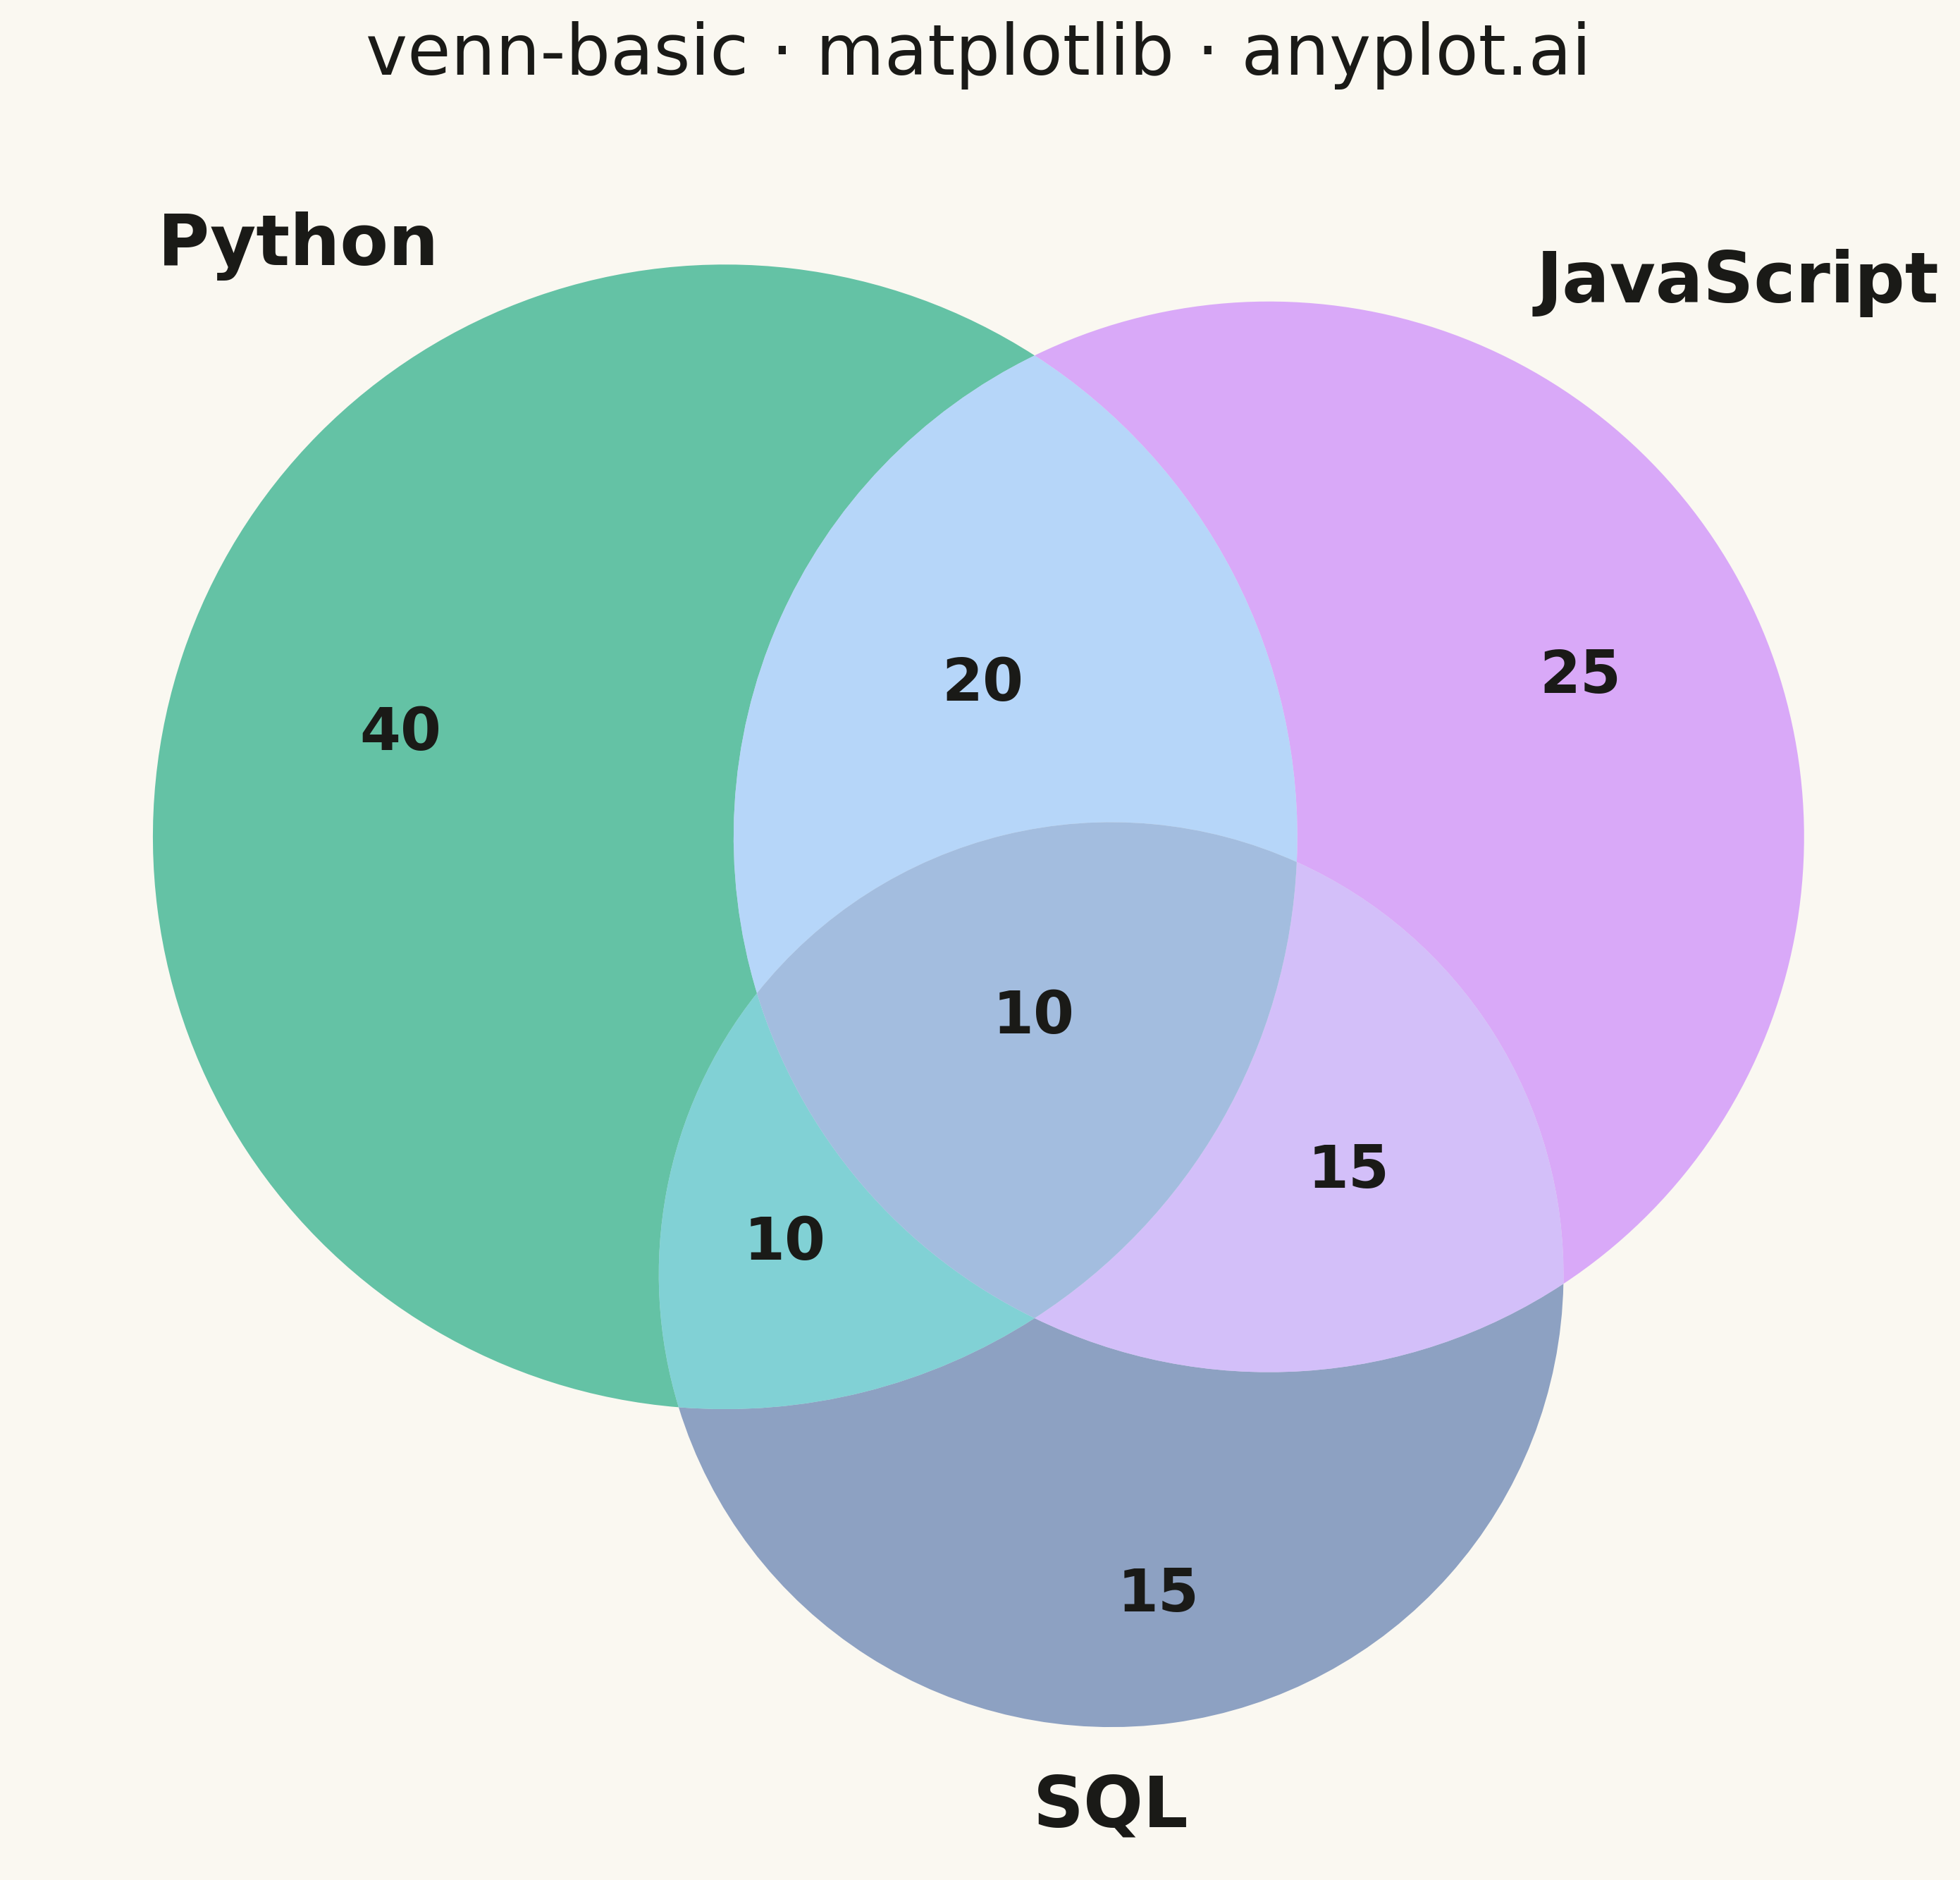
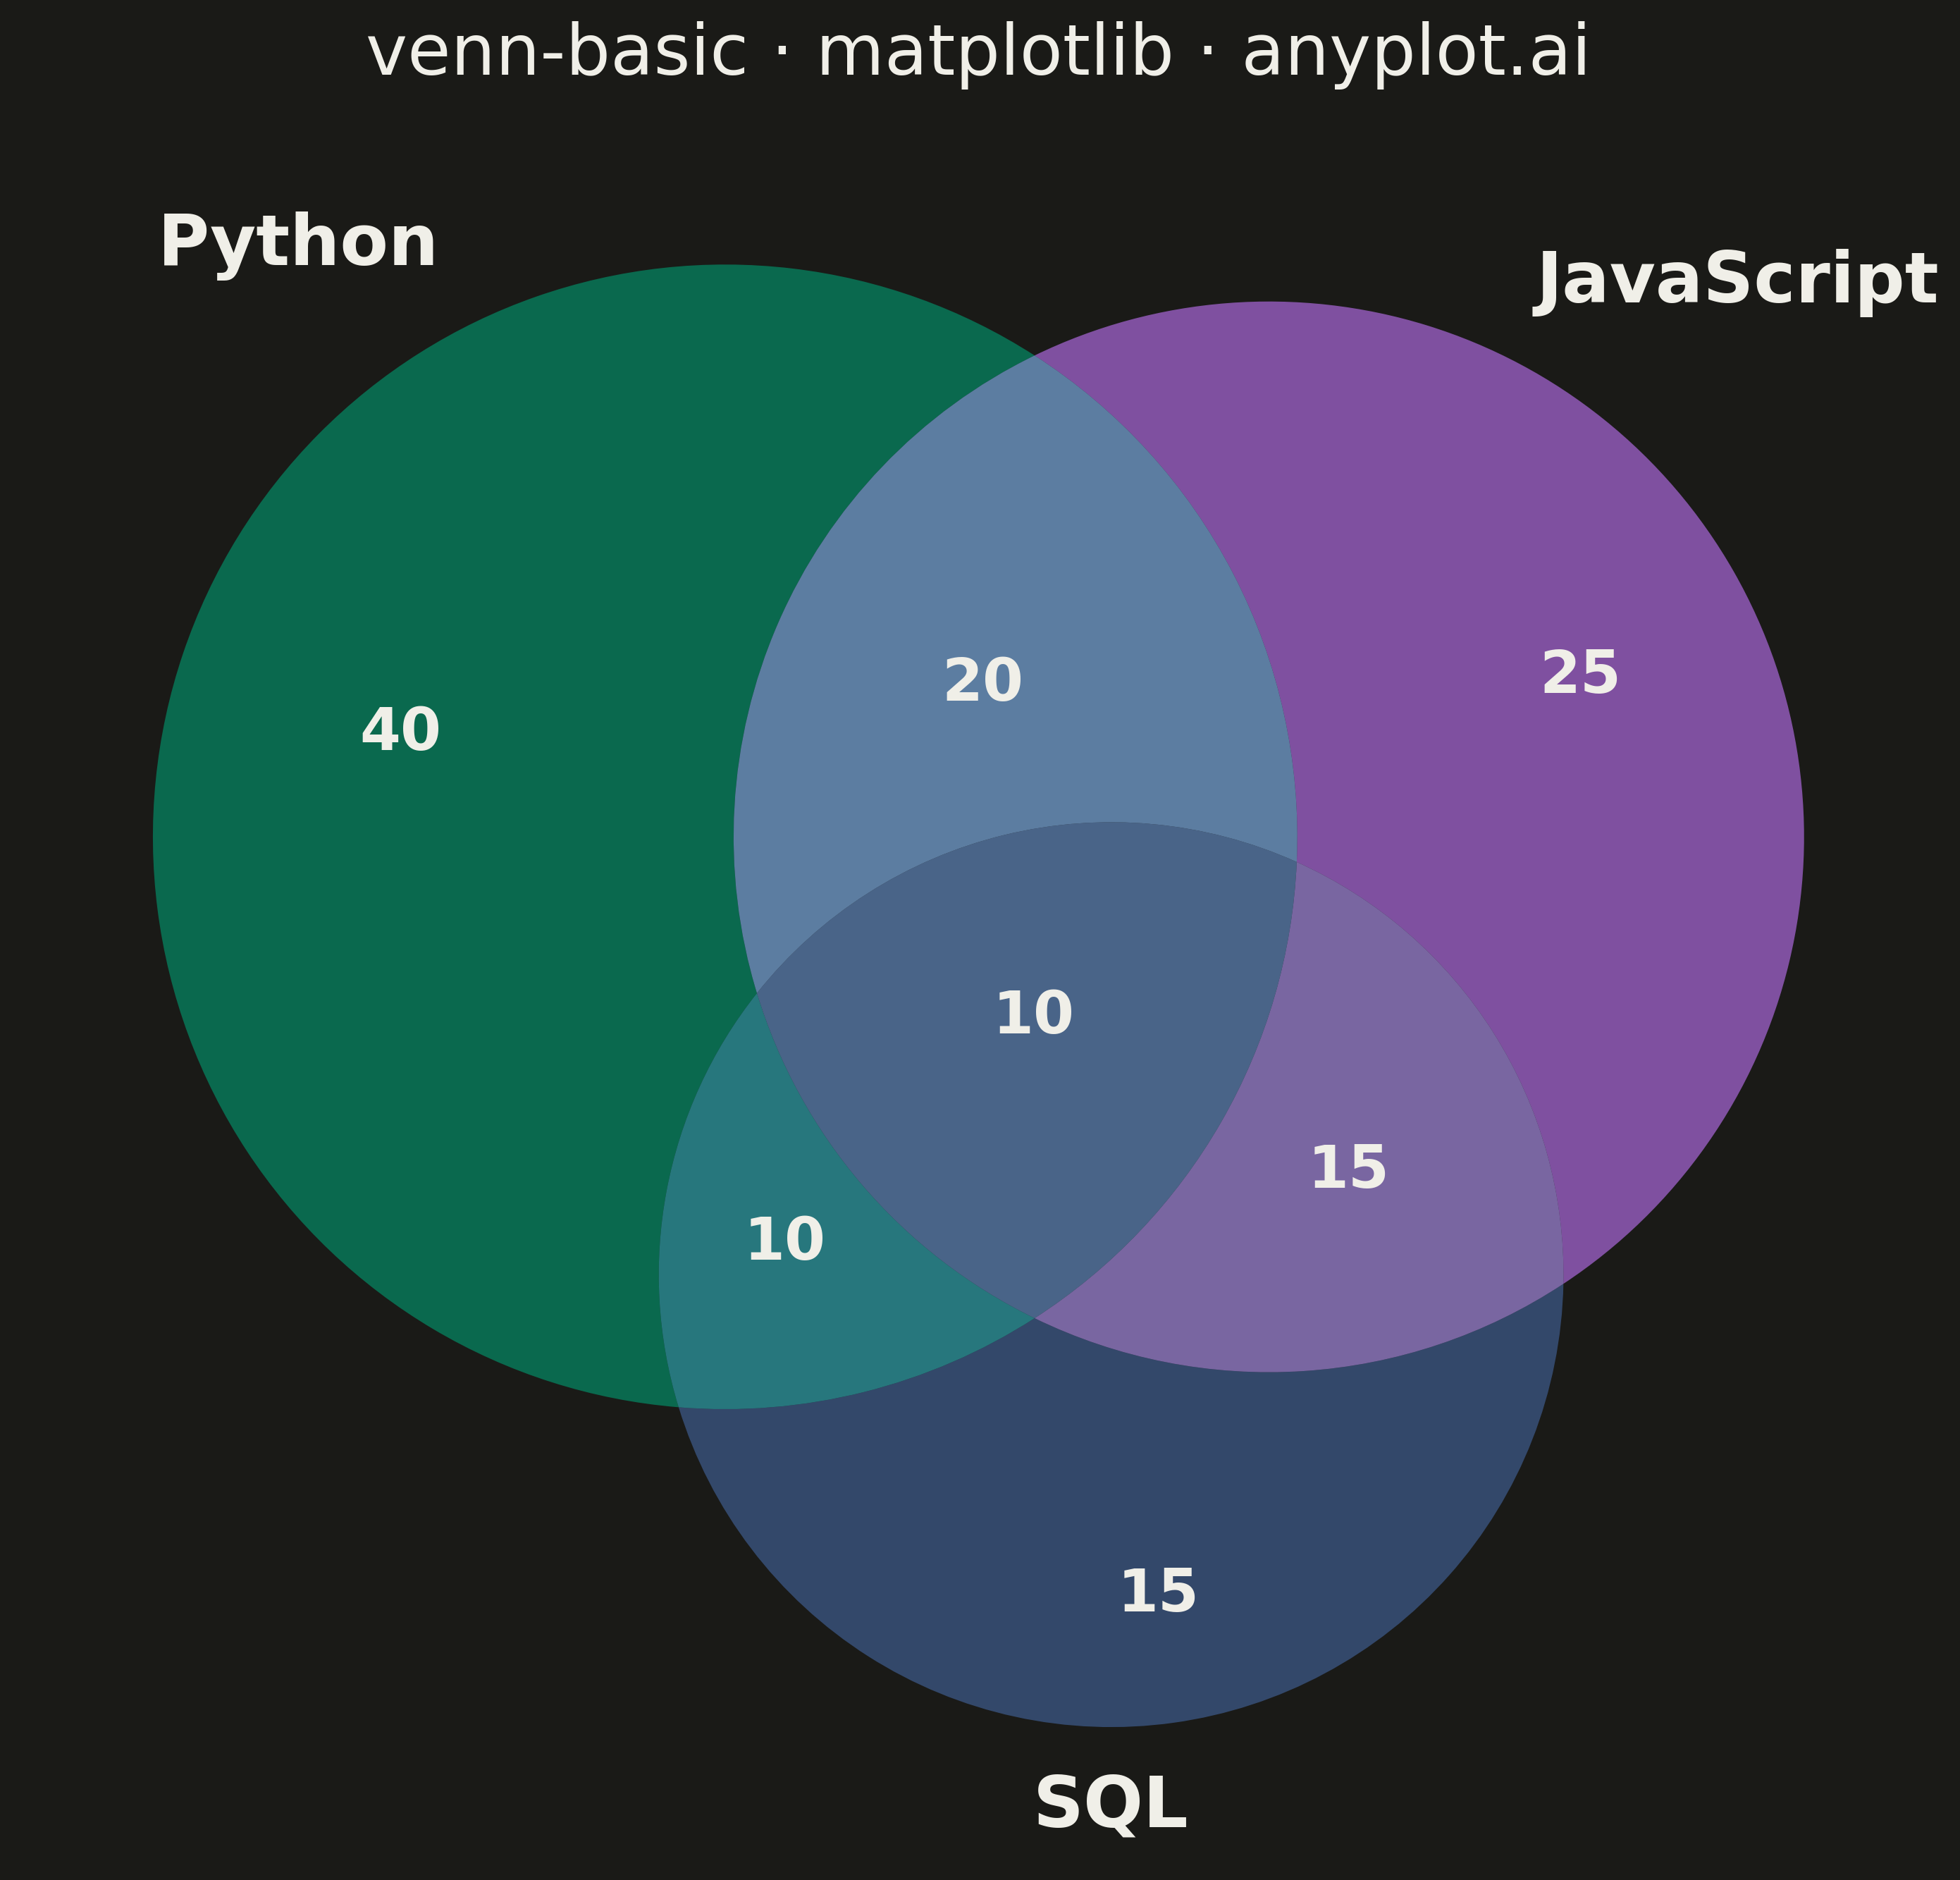
A Venn diagram visualizes the logical relationships between two or three sets using overlapping circles. Each circle represents a set, and overlapping regions show elements shared between sets. This classic visualization is ideal for showing intersections, unions, and exclusive memberships, making abstract set relationships immediately intuitive.
""" anyplot.ai
venn-basic: Venn Diagram
Library: matplotlib 3.10.9 | Python 3.13.13
Quality: 92/100 | Updated: 2026-05-11
"""

import os
import matplotlib.pyplot as plt
from matplotlib_venn import venn3

# Theme tokens
THEME = os.getenv("ANYPLOT_THEME", "light")
PAGE_BG = "#FAF8F1" if THEME == "light" else "#1A1A17"
ELEVATED_BG = "#FFFDF6" if THEME == "light" else "#242420"
INK = "#1A1A17" if THEME == "light" else "#F0EFE8"
INK_SOFT = "#4A4A44" if THEME == "light" else "#B8B7B0"

# Okabe-Ito palette
IMPRINT = ["#009E73", "#C475FD", "#4467A3"]

# Data: Developer survey - programming language proficiency
# venn3 expects: (Abc, aBc, ABc, abC, AbC, aBC, ABC)
only_a = 40  # Only Python
only_b = 25  # Only JavaScript
a_and_b = 20  # Python + JavaScript (not SQL)
only_c = 15  # Only SQL
a_and_c = 10  # Python + SQL (not JavaScript)
b_and_c = 15  # JavaScript + SQL (not Python)
a_and_b_and_c = 10  # All three

# Plot
fig, ax = plt.subplots(figsize=(16, 9), facecolor=PAGE_BG)
ax.set_facecolor(PAGE_BG)

# Create Venn diagram with subset sizes
venn = venn3(
    subsets=(only_a, only_b, a_and_b, only_c, a_and_c, b_and_c, a_and_b_and_c),
    set_labels=("Python", "JavaScript", "SQL"),
    ax=ax,
    alpha=0.6,
    set_colors=IMPRINT,
)

# Style circle labels (set names)
for text in venn.set_labels:
    if text:
        text.set_fontsize(24)
        text.set_fontweight("bold")
        text.set_color(INK)

# Style subset labels (numbers in regions)
for text in venn.subset_labels:
    if text:
        text.set_fontsize(20)
        text.set_fontweight("bold")
        text.set_color(INK)

ax.set_title(
    "venn-basic · matplotlib · anyplot.ai",
    fontsize=24,
    fontweight="medium",
    color=INK,
    pad=20,
)

plt.tight_layout()
plt.savefig(f"plot-{THEME}.png", dpi=300, bbox_inches="tight", facecolor=PAGE_BG)
Runnable source as JSON, for any HTTP client: https://api.anyplot.ai/specs/venn-basic/matplotlib/code. Any spec id and library id listed in llms-full.txt fit the same URL shape; every URL below is complete and callable.
{
  "spec_id": "venn-basic",
  "language": "python",
  "library": "matplotlib",
  "page": "https://anyplot.ai/venn-basic/python/matplotlib",
  "hub": "https://anyplot.ai/venn-basic",
  "code_json": "https://api.anyplot.ai/specs/venn-basic/matplotlib/code",
  "spec_json": "https://api.anyplot.ai/specs/venn-basic",
  "render_light_png": "https://storage.googleapis.com/anyplot-images/plots/venn-basic/python/matplotlib/plot-light.png",
  "render_dark_png": "https://storage.googleapis.com/anyplot-images/plots/venn-basic/python/matplotlib/plot-dark.png",
  "quality_score": 92.0,
  "license": "MIT",
  "guide": "https://anyplot.ai/llms.txt"
}
Part of Venn Diagram on anyplot.ai.