The same plot in 14 other libraries — JavaScript: Chart.js, D3.js, Apache ECharts, MUI X Charts; Python: Altair, Bokeh, lets-plot, Matplotlib, Plotly, plotnine, Pygal, Seaborn; R: ggplot2; Julia: Makie.jl. Compare all 15 side by side: Venn Diagram in Python, R, Julia and JavaScript.
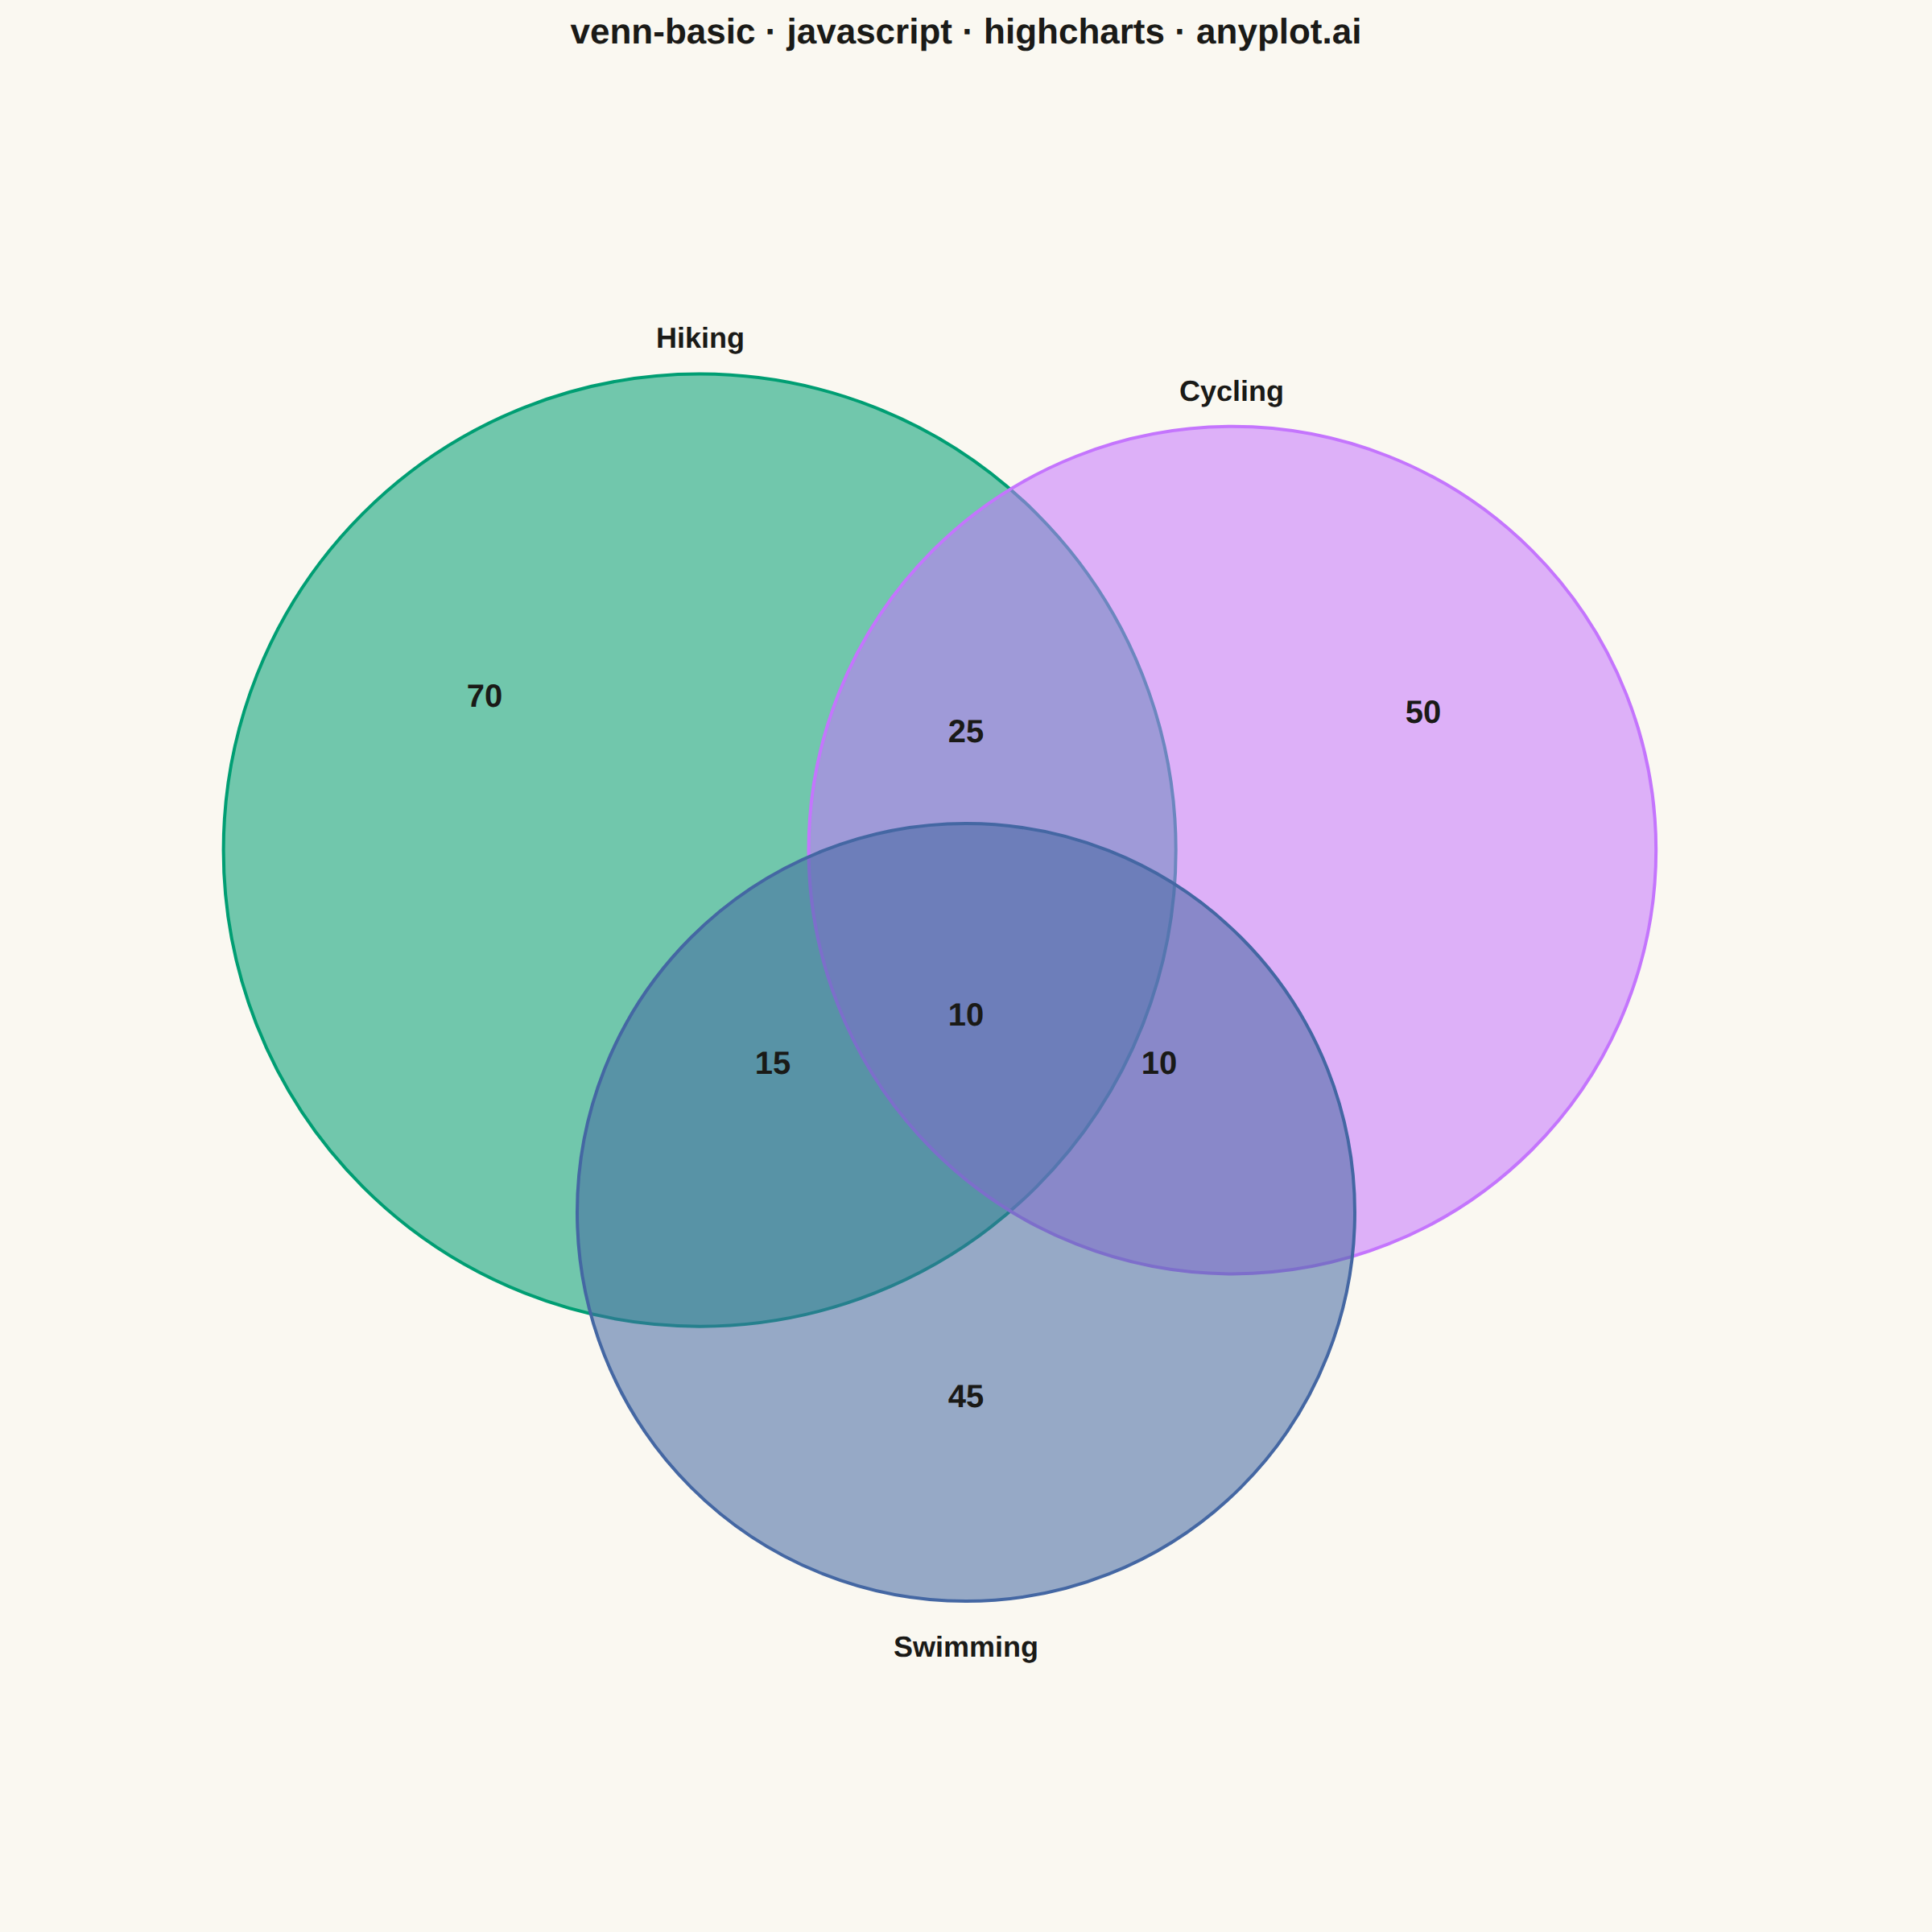
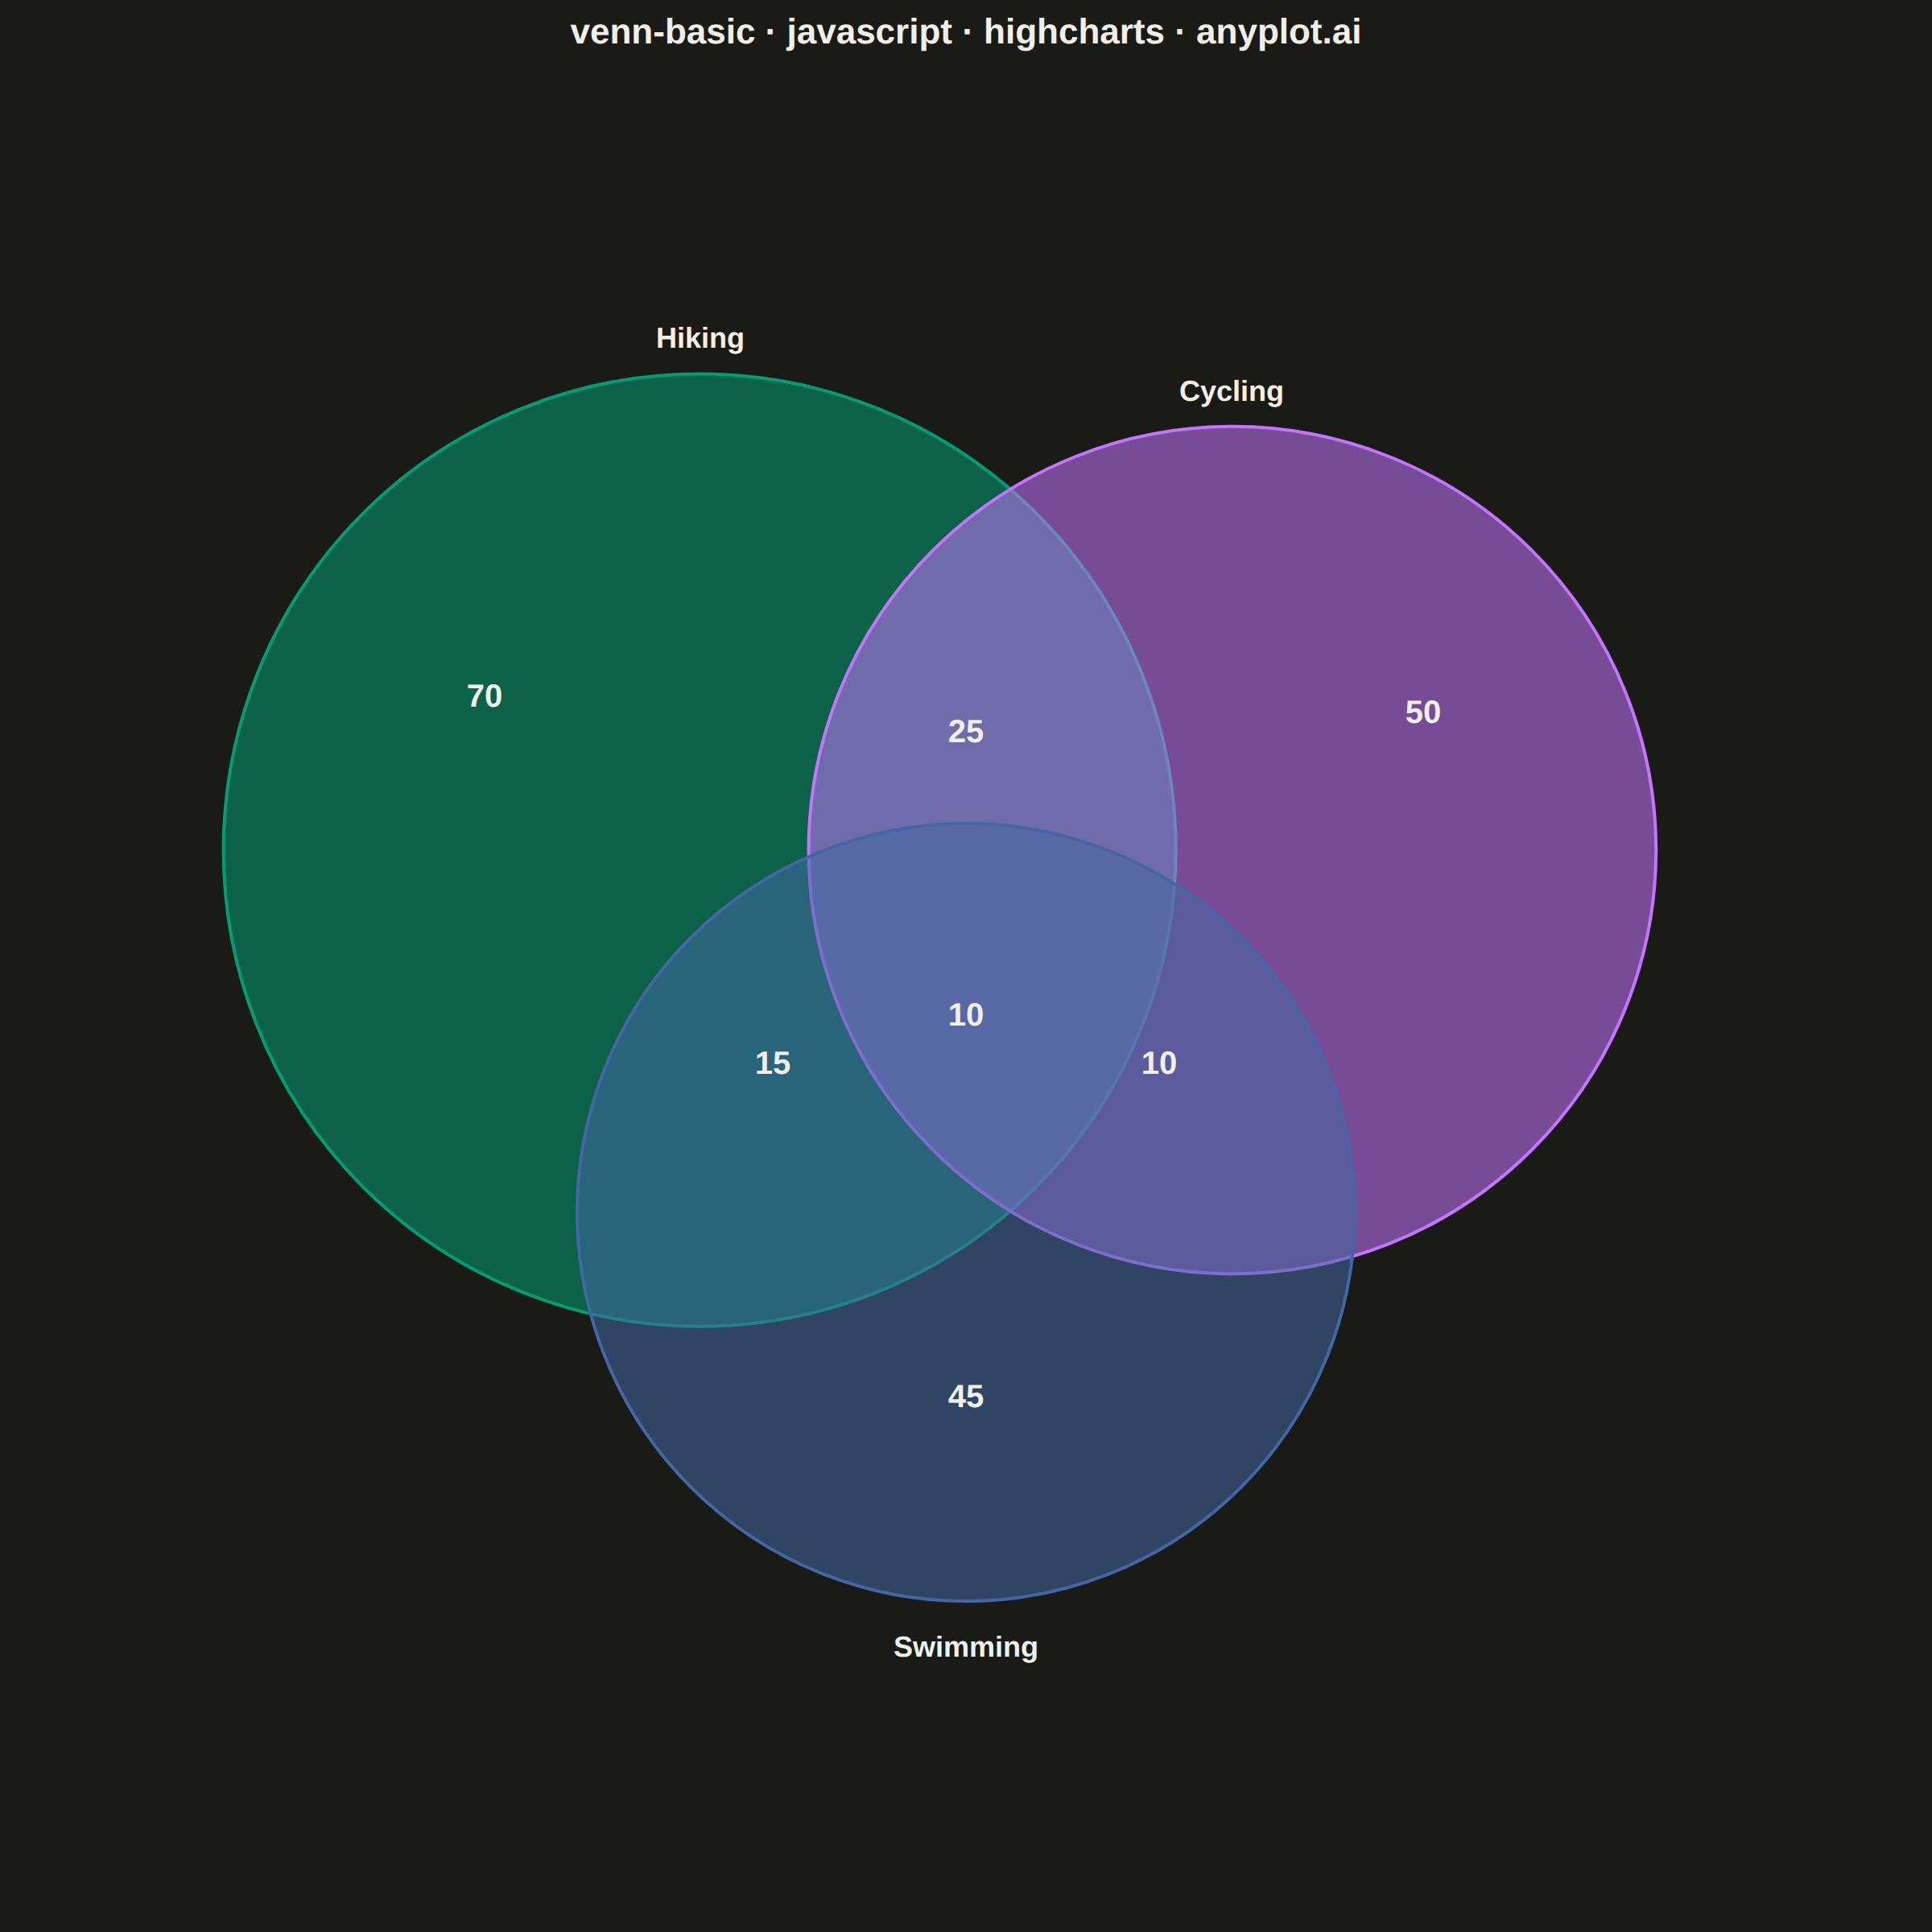
A Venn diagram visualizes the logical relationships between two or three sets using overlapping circles. Each circle represents a set, and overlapping regions show elements shared between sets. This classic visualization is ideal for showing intersections, unions, and exclusive memberships, making abstract set relationships immediately intuitive.
// anyplot.ai
// venn-basic: Venn Diagram
// Library: highcharts 12.6.0 | JavaScript 22.23.2
// Quality: 88/100 | Created: 2026-09-09
//# anyplot-orientation: square

const t = window.ANYPLOT_TOKENS;
const mount = window.ANYPLOT_SIZE;

// --- Data (in-memory, deterministic) ----------------------------------------
// Outdoor-activity survey: which activities 225 respondents said they enjoy.
// Circle area scales with sqrt(set size), so area stays proportional to size.
const setLabels = ["Hiking", "Cycling", "Swimming"];
const onlyHiking = 70;
const onlyCycling = 50;
const onlySwimming = 45;
const hikingCycling = 25; // hiking & cycling, not swimming
const hikingSwimming = 15; // hiking & swimming, not cycling
const cyclingSwimming = 10; // cycling & swimming, not hiking
const allThree = 10;

const sizeHiking = onlyHiking + hikingCycling + hikingSwimming + allThree; // 120
const sizeCycling = onlyCycling + hikingCycling + cyclingSwimming + allThree; // 95
const sizeSwimming = onlySwimming + hikingSwimming + cyclingSwimming + allThree; // 80

// --- Chart -------------------------------------------------------------------
Highcharts.chart("container", {
  chart: {
    backgroundColor: "transparent",
    animation: false,
    style: { fontFamily: "inherit" },
    events: {
      load() {
        drawVennDiagram(this);
      },
    },
  },
  credits: { enabled: false },
  title: {
    text: "venn-basic · javascript · highcharts · anyplot.ai",
    style: { color: t.ink, fontSize: "22px", fontWeight: "600" },
  },
  xAxis: { visible: false },
  yAxis: { visible: false },
  legend: { enabled: false },
  series: [],
  plotOptions: { series: { animation: false } },
});

function drawVennDiagram(chart) {
  const renderer = chart.renderer;
  const cx = mount.width / 2;
  const cy = mount.height * 0.52;

  // Radius ~ sqrt(set size): circle area stays proportional to set size.
  const scale = 27;
  const rHiking = Math.sqrt(sizeHiking) * scale;
  const rCycling = Math.sqrt(sizeCycling) * scale;
  const rSwimming = Math.sqrt(sizeSwimming) * scale;
  const avgR = (rHiking + rCycling + rSwimming) / 3;

  // Classic symmetric 3-circle layout: centers at the corners of an
  // upward-pointing triangle so every pairwise + triple region is visible.
  const spread = avgR * 0.62;
  const centerHiking = { x: cx - spread, y: cy - spread * 0.58 };
  const centerCycling = { x: cx + spread, y: cy - spread * 0.58 };
  const centerSwimming = { x: cx, y: cy + spread * 0.78 };

  const circles = [
    { center: centerHiking, r: rHiking, color: t.palette[0] },
    { center: centerCycling, r: rCycling, color: t.palette[1] },
    { center: centerSwimming, r: rSwimming, color: t.palette[2] },
  ];

  circles.forEach(({ center, r, color }) => {
    renderer
      .circle(center.x, center.y, r)
      .attr({
        fill: Highcharts.color(color).setOpacity(0.55).get("rgba"),
        stroke: color,
        "stroke-width": 2,
      })
      .add();
  });

  // Set-name labels, positioned just outside each circle. Rendered in the
  // theme ink color (not the raw palette hue) so all three stay above WCAG
  // large-text contrast in light mode; the outer circle stroke already
  // carries the color-coded set identity.
  const nameLabels = [
    { text: setLabels[0], x: centerHiking.x, y: centerHiking.y - rHiking - 16 },
    {
      text: setLabels[1],
      x: centerCycling.x,
      y: centerCycling.y - rCycling - 16,
    },
    {
      text: setLabels[2],
      x: centerSwimming.x,
      y: centerSwimming.y + rSwimming + 34,
    },
  ];
  nameLabels.forEach(({ text, x, y }) => {
    renderer
      .text(text, x, y)
      .attr({ align: "center" })
      .css({
        color: t.ink,
        fontSize: "18px",
        fontWeight: "600",
        fontFamily: "inherit",
      })
      .add();
  });

  // Region count labels — one per exclusive slice, plus the triple overlap.
  const regionLabels = [
    {
      value: onlyHiking,
      x: centerHiking.x - rHiking * 0.45,
      y: centerHiking.y - rHiking * 0.3,
    },
    {
      value: onlyCycling,
      x: centerCycling.x + rCycling * 0.45,
      y: centerCycling.y - rCycling * 0.3,
    },
    {
      value: onlySwimming,
      x: centerSwimming.x,
      y: centerSwimming.y + rSwimming * 0.5,
    },
    {
      value: hikingCycling,
      x: (centerHiking.x + centerCycling.x) / 2,
      y: (centerHiking.y + centerCycling.y) / 2 - avgR * 0.25,
    },
    {
      value: hikingSwimming,
      x: (centerHiking.x + centerSwimming.x) / 2 - avgR * 0.14,
      y: (centerHiking.y + centerSwimming.y) / 2 + avgR * 0.1,
    },
    {
      value: cyclingSwimming,
      x: (centerCycling.x + centerSwimming.x) / 2 + avgR * 0.14,
      y: (centerCycling.y + centerSwimming.y) / 2 + avgR * 0.1,
    },
    { value: allThree, x: cx, y: cy + avgR * 0.05 },
  ];
  regionLabels.forEach(({ value, x, y }) => {
    renderer
      .text(String(value), x, y)
      .attr({ align: "center" })
      .css({
        color: t.ink,
        fontSize: "20px",
        fontWeight: "600",
        fontFamily: "inherit",
      })
      .add();
  });
}
Runnable source as JSON, for any HTTP client: https://api.anyplot.ai/specs/venn-basic/highcharts/code. Any spec id and library id listed in llms-full.txt fit the same URL shape; every URL below is complete and callable.
{
  "spec_id": "venn-basic",
  "language": "javascript",
  "library": "highcharts",
  "page": "https://anyplot.ai/venn-basic/javascript/highcharts",
  "hub": "https://anyplot.ai/venn-basic",
  "code_json": "https://api.anyplot.ai/specs/venn-basic/highcharts/code",
  "spec_json": "https://api.anyplot.ai/specs/venn-basic",
  "render_light_png": "https://storage.googleapis.com/anyplot-images/plots/venn-basic/javascript/highcharts/plot-light.png",
  "render_dark_png": "https://storage.googleapis.com/anyplot-images/plots/venn-basic/javascript/highcharts/plot-dark.png",
  "interactive_light_html": "https://storage.googleapis.com/anyplot-images/plots/venn-basic/javascript/highcharts/plot-light.html",
  "interactive_dark_html": "https://storage.googleapis.com/anyplot-images/plots/venn-basic/javascript/highcharts/plot-dark.html",
  "quality_score": 88.0,
  "license": "MIT",
  "guide": "https://anyplot.ai/llms.txt"
}
Part of Venn Diagram on anyplot.ai.