The same plot in 14 other libraries — JavaScript: Chart.js, Apache ECharts, Highcharts, MUI X Charts; Python: Altair, Bokeh, lets-plot, Matplotlib, Plotly, plotnine, Pygal, Seaborn; R: ggplot2; Julia: Makie.jl. Compare all 15 side by side: Venn Diagram in Python, R, Julia and JavaScript.
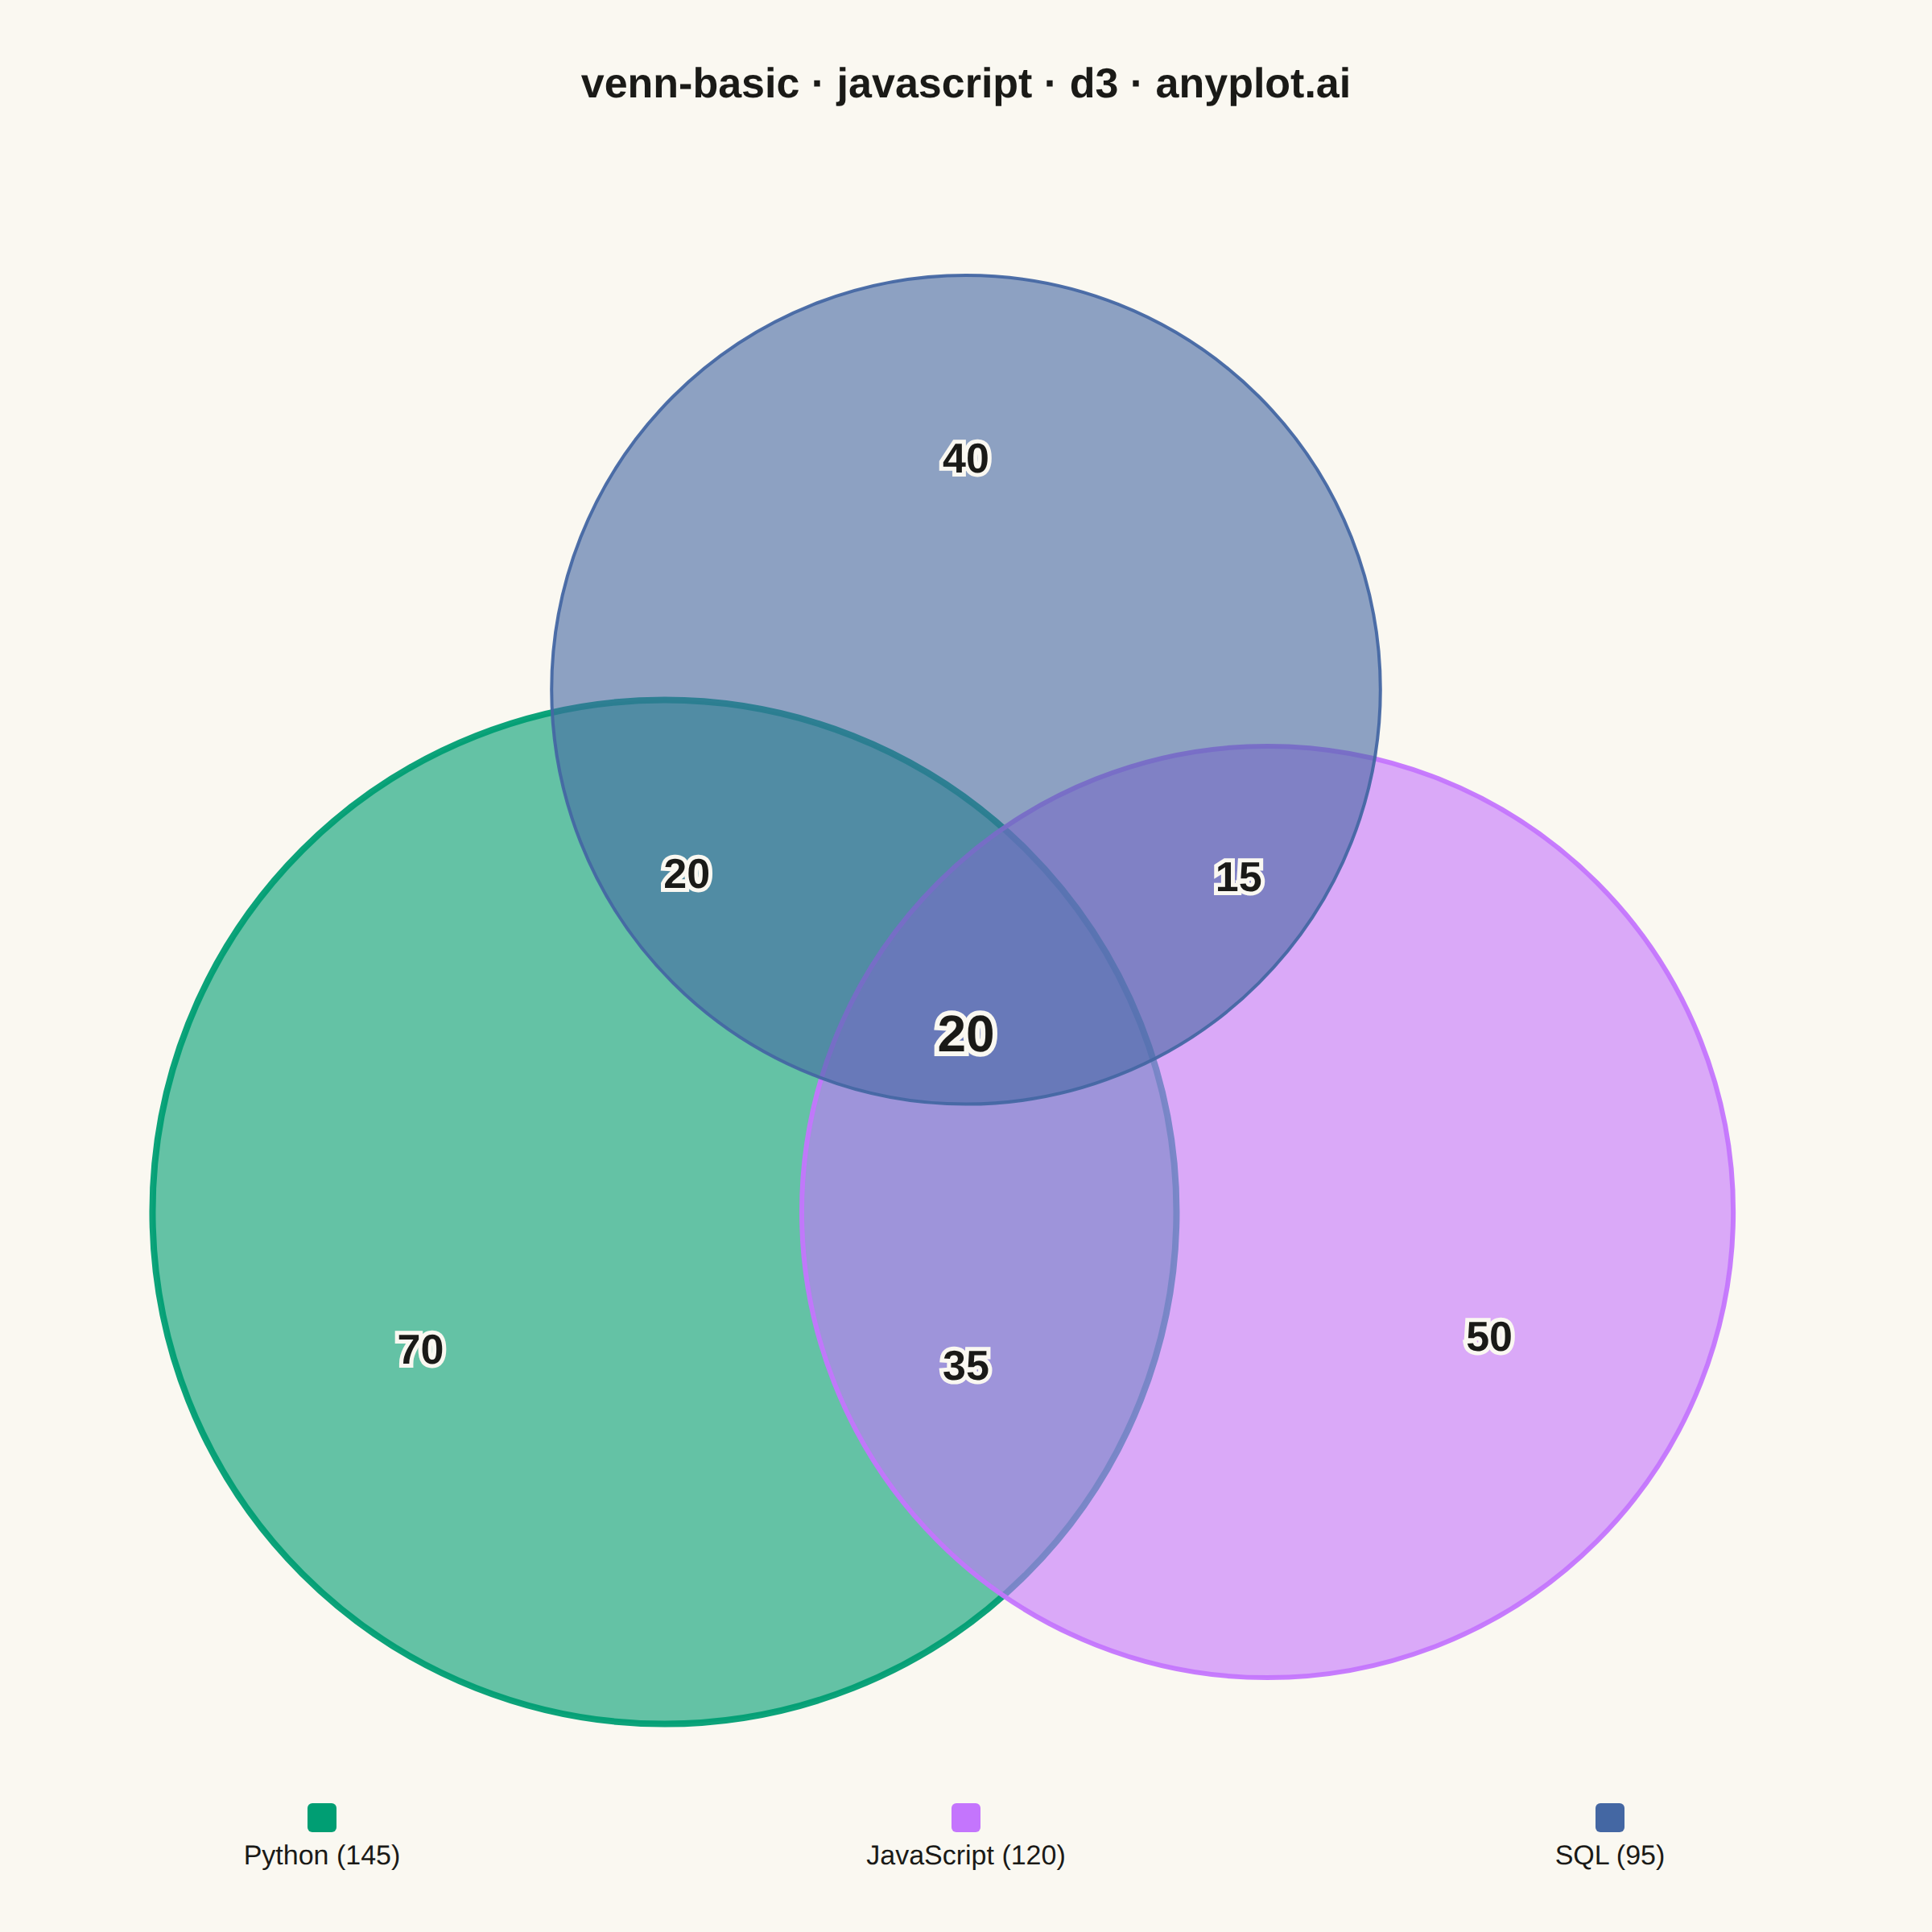
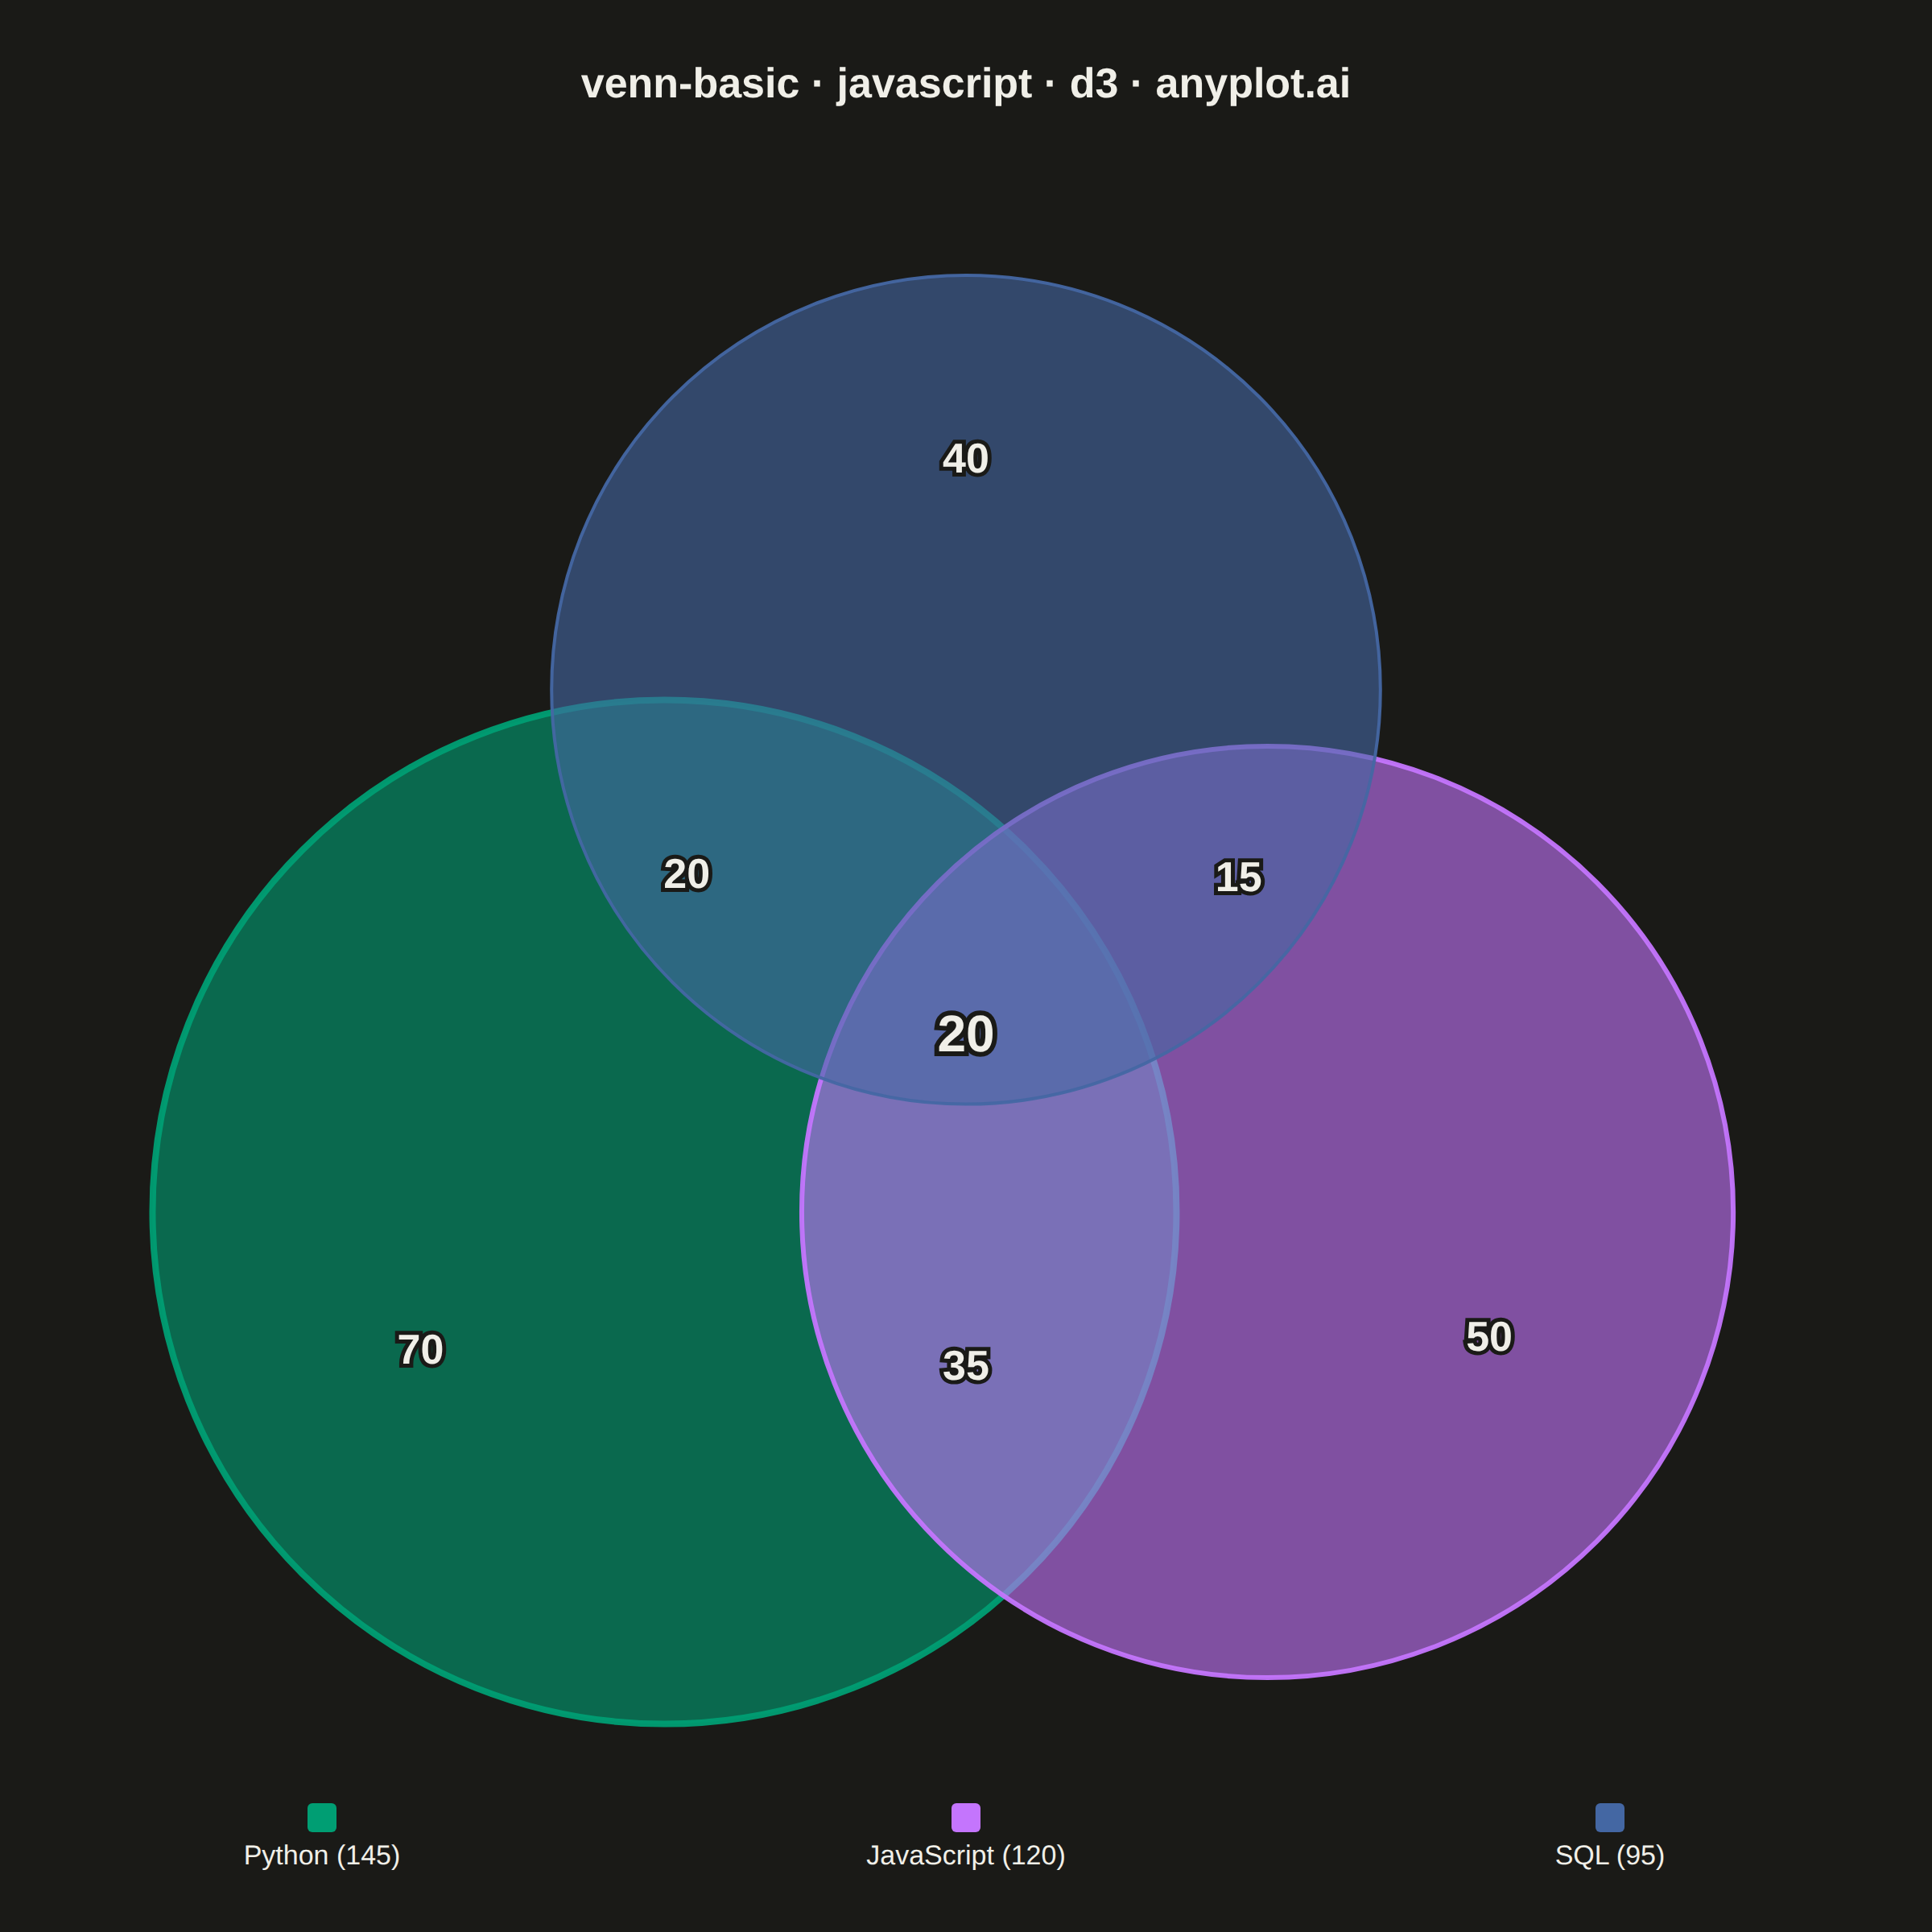
A Venn diagram visualizes the logical relationships between two or three sets using overlapping circles. Each circle represents a set, and overlapping regions show elements shared between sets. This classic visualization is ideal for showing intersections, unions, and exclusive memberships, making abstract set relationships immediately intuitive.
// anyplot.ai
// venn-basic: Venn Diagram
// Library: d3 7.9.0 | JavaScript 22.23.2
// Quality: 93/100 | Created: 2026-09-09

//# anyplot-orientation: square

const t = window.ANYPLOT_TOKENS;
const { width, height } = window.ANYPLOT_SIZE;

// --- Data (in-memory, deterministic) ----------------------------------------
// Skills reported by 250 surveyed software engineers, grouped by language.
const sets = [
  { key: "A", name: "Python", size: 145, color: t.palette[0] },
  { key: "B", name: "JavaScript", size: 120, color: t.palette[1] },
  { key: "C", name: "SQL", size: 95, color: t.palette[2] },
];
const pair = { AB: 55, AC: 40, BC: 35 };
const triple = 20;

const only = {
  A: sets[0].size - pair.AB - pair.AC + triple,
  B: sets[1].size - pair.AB - pair.BC + triple,
  C: sets[2].size - pair.AC - pair.BC + triple,
  AB: pair.AB - triple,
  AC: pair.AC - triple,
  BC: pair.BC - triple,
  ABC: triple,
};

// --- Geometry: symmetric three-circle Venn layout ---------------------------
const cx = width / 2;
const titleClearance = height * 0.092;
const legendClearance = height * 0.1;
const rMax = Math.min(width, height) * 0.265; // radius of the largest set
// Area-proportional radii: r ~ sqrt(size), per the spec's "area proportional
// to size when possible" note.
const sizeScale = d3.scaleSqrt().domain([0, d3.max(sets, (d) => d.size)]).range([0, rMax]);
const rad = Object.fromEntries(sets.map((d) => [d.key, sizeScale(d.size)]));
const R = rMax * 0.68; // circumradius of the triangle formed by the 3 centers
const cy = titleClearance + R + rMax; // pins the top circle's top edge below the title

const centroid = { x: cx, y: cy };
const centers = {
  C: { x: cx, y: cy - R }, // top
  A: { x: cx - R * Math.sin(Math.PI / 3), y: cy + R * Math.cos(Math.PI / 3) }, // bottom-left
  B: { x: cx + R * Math.sin(Math.PI / 3), y: cy + R * Math.cos(Math.PI / 3) }, // bottom-right
};

function pushFrom(p, from, dist) {
  const dx = p.x - from.x;
  const dy = p.y - from.y;
  const len = Math.hypot(dx, dy) || 1;
  return { x: p.x + (dx / len) * dist, y: p.y + (dy / len) * dist };
}
function midpoint(p, q) {
  return { x: (p.x + q.x) / 2, y: (p.y + q.y) / 2 };
}

const labelPos = {
  A: pushFrom(centers.A, centroid, rad.A * 0.55),
  B: pushFrom(centers.B, centroid, rad.B * 0.55),
  C: pushFrom(centers.C, centroid, rad.C * 0.55),
  AB: pushFrom(midpoint(centers.A, centers.B), centers.C, ((rad.A + rad.B) / 2) * 0.32),
  AC: pushFrom(midpoint(centers.A, centers.C), centers.B, ((rad.A + rad.C) / 2) * 0.32),
  BC: pushFrom(midpoint(centers.B, centers.C), centers.A, ((rad.B + rad.C) / 2) * 0.32),
  ABC: centroid,
};

// --- SVG mount ----------------------------------------------------------------
const svg = d3.select("#container").append("svg").attr("width", width).attr("height", height);

// --- Circles --------------------------------------------------------------
// Stroke weight also scales with set size, giving the dominant set (Python) a
// visibly heavier outline as a deliberate focal point.
const strokeScale = d3.scaleLinear().domain(d3.extent(sets, (d) => d.size)).range([2, 4]);

svg
  .selectAll("circle")
  .data(sets)
  .join("circle")
  .attr("cx", (d) => centers[d.key].x)
  .attr("cy", (d) => centers[d.key].y)
  .attr("r", (d) => rad[d.key])
  .attr("fill", (d) => d.color)
  .attr("fill-opacity", 0.6)
  .attr("stroke", (d) => d.color)
  .attr("stroke-width", (d) => strokeScale(d.size))
  .attr("stroke-opacity", 0.95);

// --- Region counts (halo-stroked text reads over any fill) -----------------
const regions = [
  { key: "A", value: only.A },
  { key: "B", value: only.B },
  { key: "C", value: only.C },
  { key: "AB", value: only.AB },
  { key: "AC", value: only.AC },
  { key: "BC", value: only.BC },
  { key: "ABC", value: only.ABC },
];

// The triple overlap (all three sets) is the most interesting relationship in
// a Venn diagram, so its count is rendered larger as a deliberate focal point.
svg
  .selectAll("text.region")
  .data(regions)
  .join("text")
  .attr("class", "region")
  .attr("x", (d) => labelPos[d.key].x)
  .attr("y", (d) => labelPos[d.key].y)
  .attr("text-anchor", "middle")
  .attr("dominant-baseline", "middle")
  .style("font-size", (d) => (d.key === "ABC" ? "32px" : "26px"))
  .style("font-weight", (d) => (d.key === "ABC" ? "700" : "600"))
  .style("paint-order", "stroke")
  .attr("stroke", t.pageBg)
  .attr("stroke-width", (d) => (d.key === "ABC" ? 6 : 5))
  .attr("fill", t.ink)
  .text((d) => d.value);

// --- Legend (set name + total size) -----------------------------------------
const legendY = height - legendClearance * 0.55;
const legendItemWidth = width / sets.length;

const legend = svg
  .selectAll("g.legend-item")
  .data(sets)
  .join("g")
  .attr("class", "legend-item")
  .attr(
    "transform",
    (d, i) => `translate(${legendItemWidth * i + legendItemWidth / 2}, ${legendY})`
  );

legend
  .append("rect")
  .attr("x", -9)
  .attr("y", -14)
  .attr("width", 18)
  .attr("height", 18)
  .attr("rx", 3)
  .attr("fill", (d) => d.color);

legend
  .append("text")
  .attr("x", 0)
  .attr("y", 24)
  .attr("text-anchor", "middle")
  .style("font-size", "17px")
  .style("font-weight", "500")
  .attr("fill", t.ink)
  .text((d) => `${d.name} (${d.size})`);

// --- Title --------------------------------------------------------------
svg
  .append("text")
  .attr("x", width / 2)
  .attr("y", titleClearance * 0.55)
  .attr("text-anchor", "middle")
  .attr("fill", t.ink)
  .style("font-size", "26px")
  .style("font-weight", "600")
  .text("venn-basic · javascript · d3 · anyplot.ai");
Runnable source as JSON, for any HTTP client: https://api.anyplot.ai/specs/venn-basic/d3/code. Any spec id and library id listed in llms-full.txt fit the same URL shape; every URL below is complete and callable.
{
  "spec_id": "venn-basic",
  "language": "javascript",
  "library": "d3",
  "page": "https://anyplot.ai/venn-basic/javascript/d3",
  "hub": "https://anyplot.ai/venn-basic",
  "code_json": "https://api.anyplot.ai/specs/venn-basic/d3/code",
  "spec_json": "https://api.anyplot.ai/specs/venn-basic",
  "render_light_png": "https://storage.googleapis.com/anyplot-images/plots/venn-basic/javascript/d3/plot-light.png",
  "render_dark_png": "https://storage.googleapis.com/anyplot-images/plots/venn-basic/javascript/d3/plot-dark.png",
  "interactive_light_html": "https://storage.googleapis.com/anyplot-images/plots/venn-basic/javascript/d3/plot-light.html",
  "interactive_dark_html": "https://storage.googleapis.com/anyplot-images/plots/venn-basic/javascript/d3/plot-dark.html",
  "quality_score": 93.0,
  "license": "MIT",
  "guide": "https://anyplot.ai/llms.txt"
}
Part of Venn Diagram on anyplot.ai.