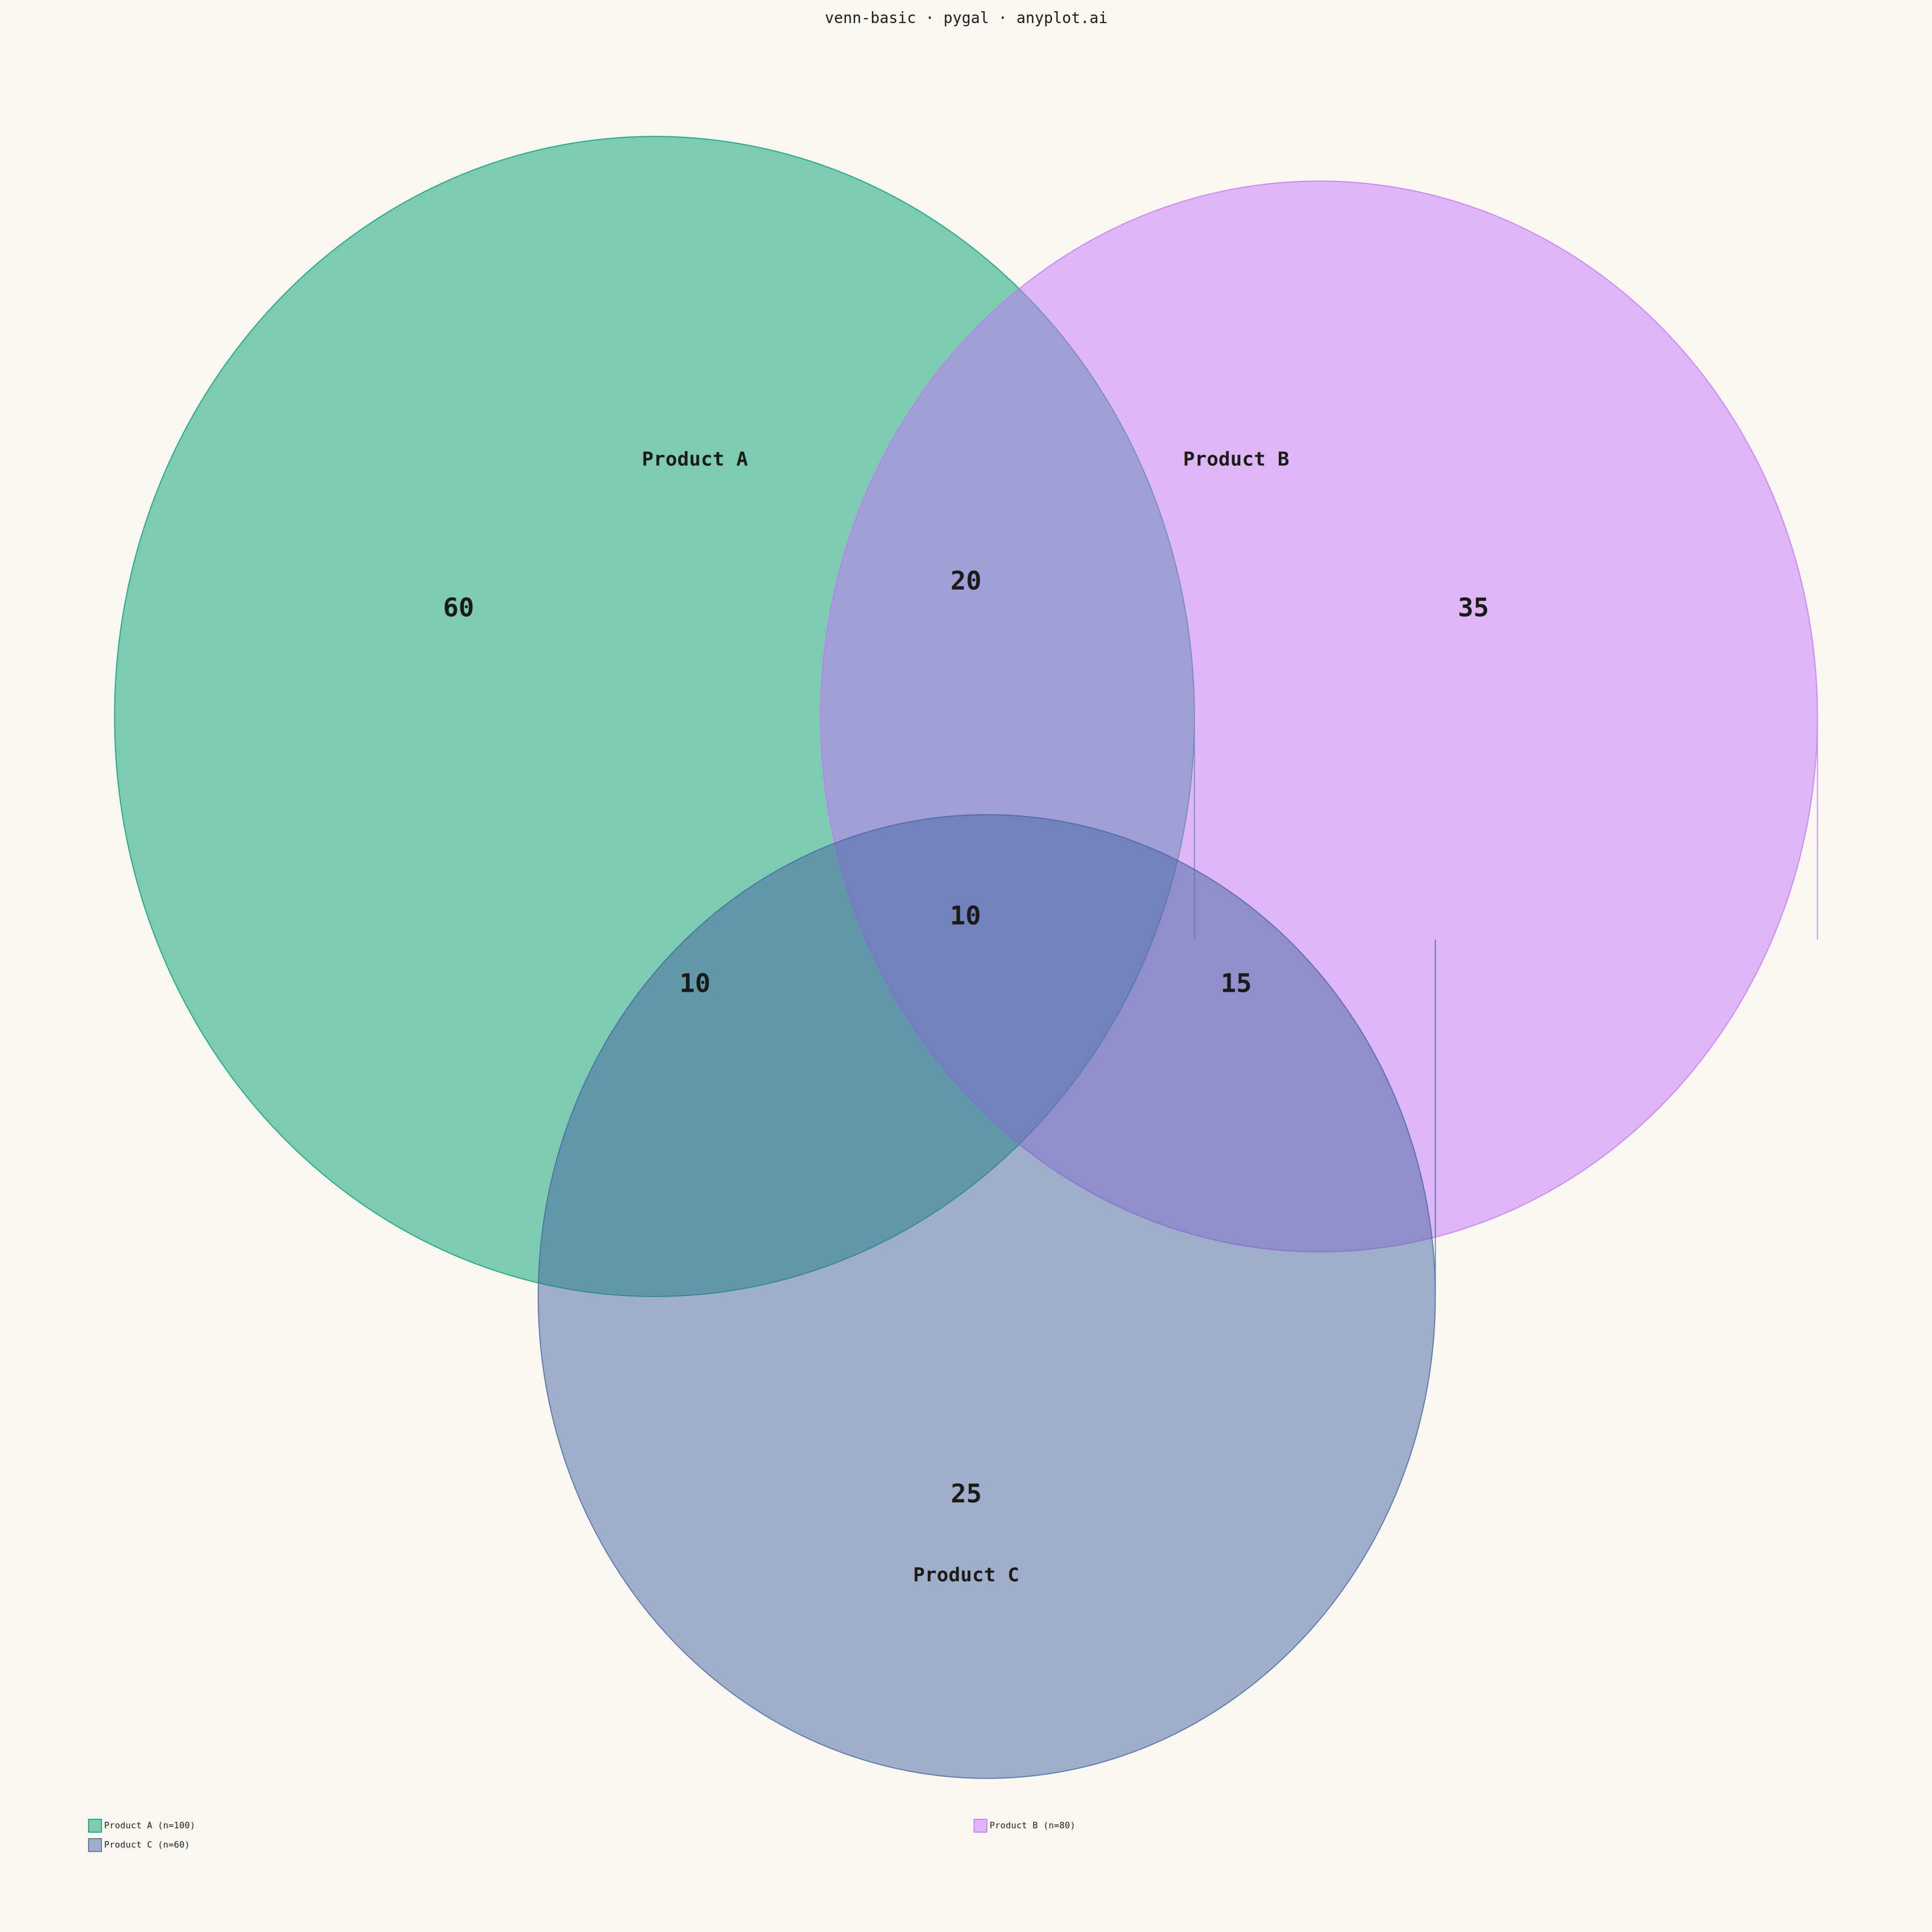
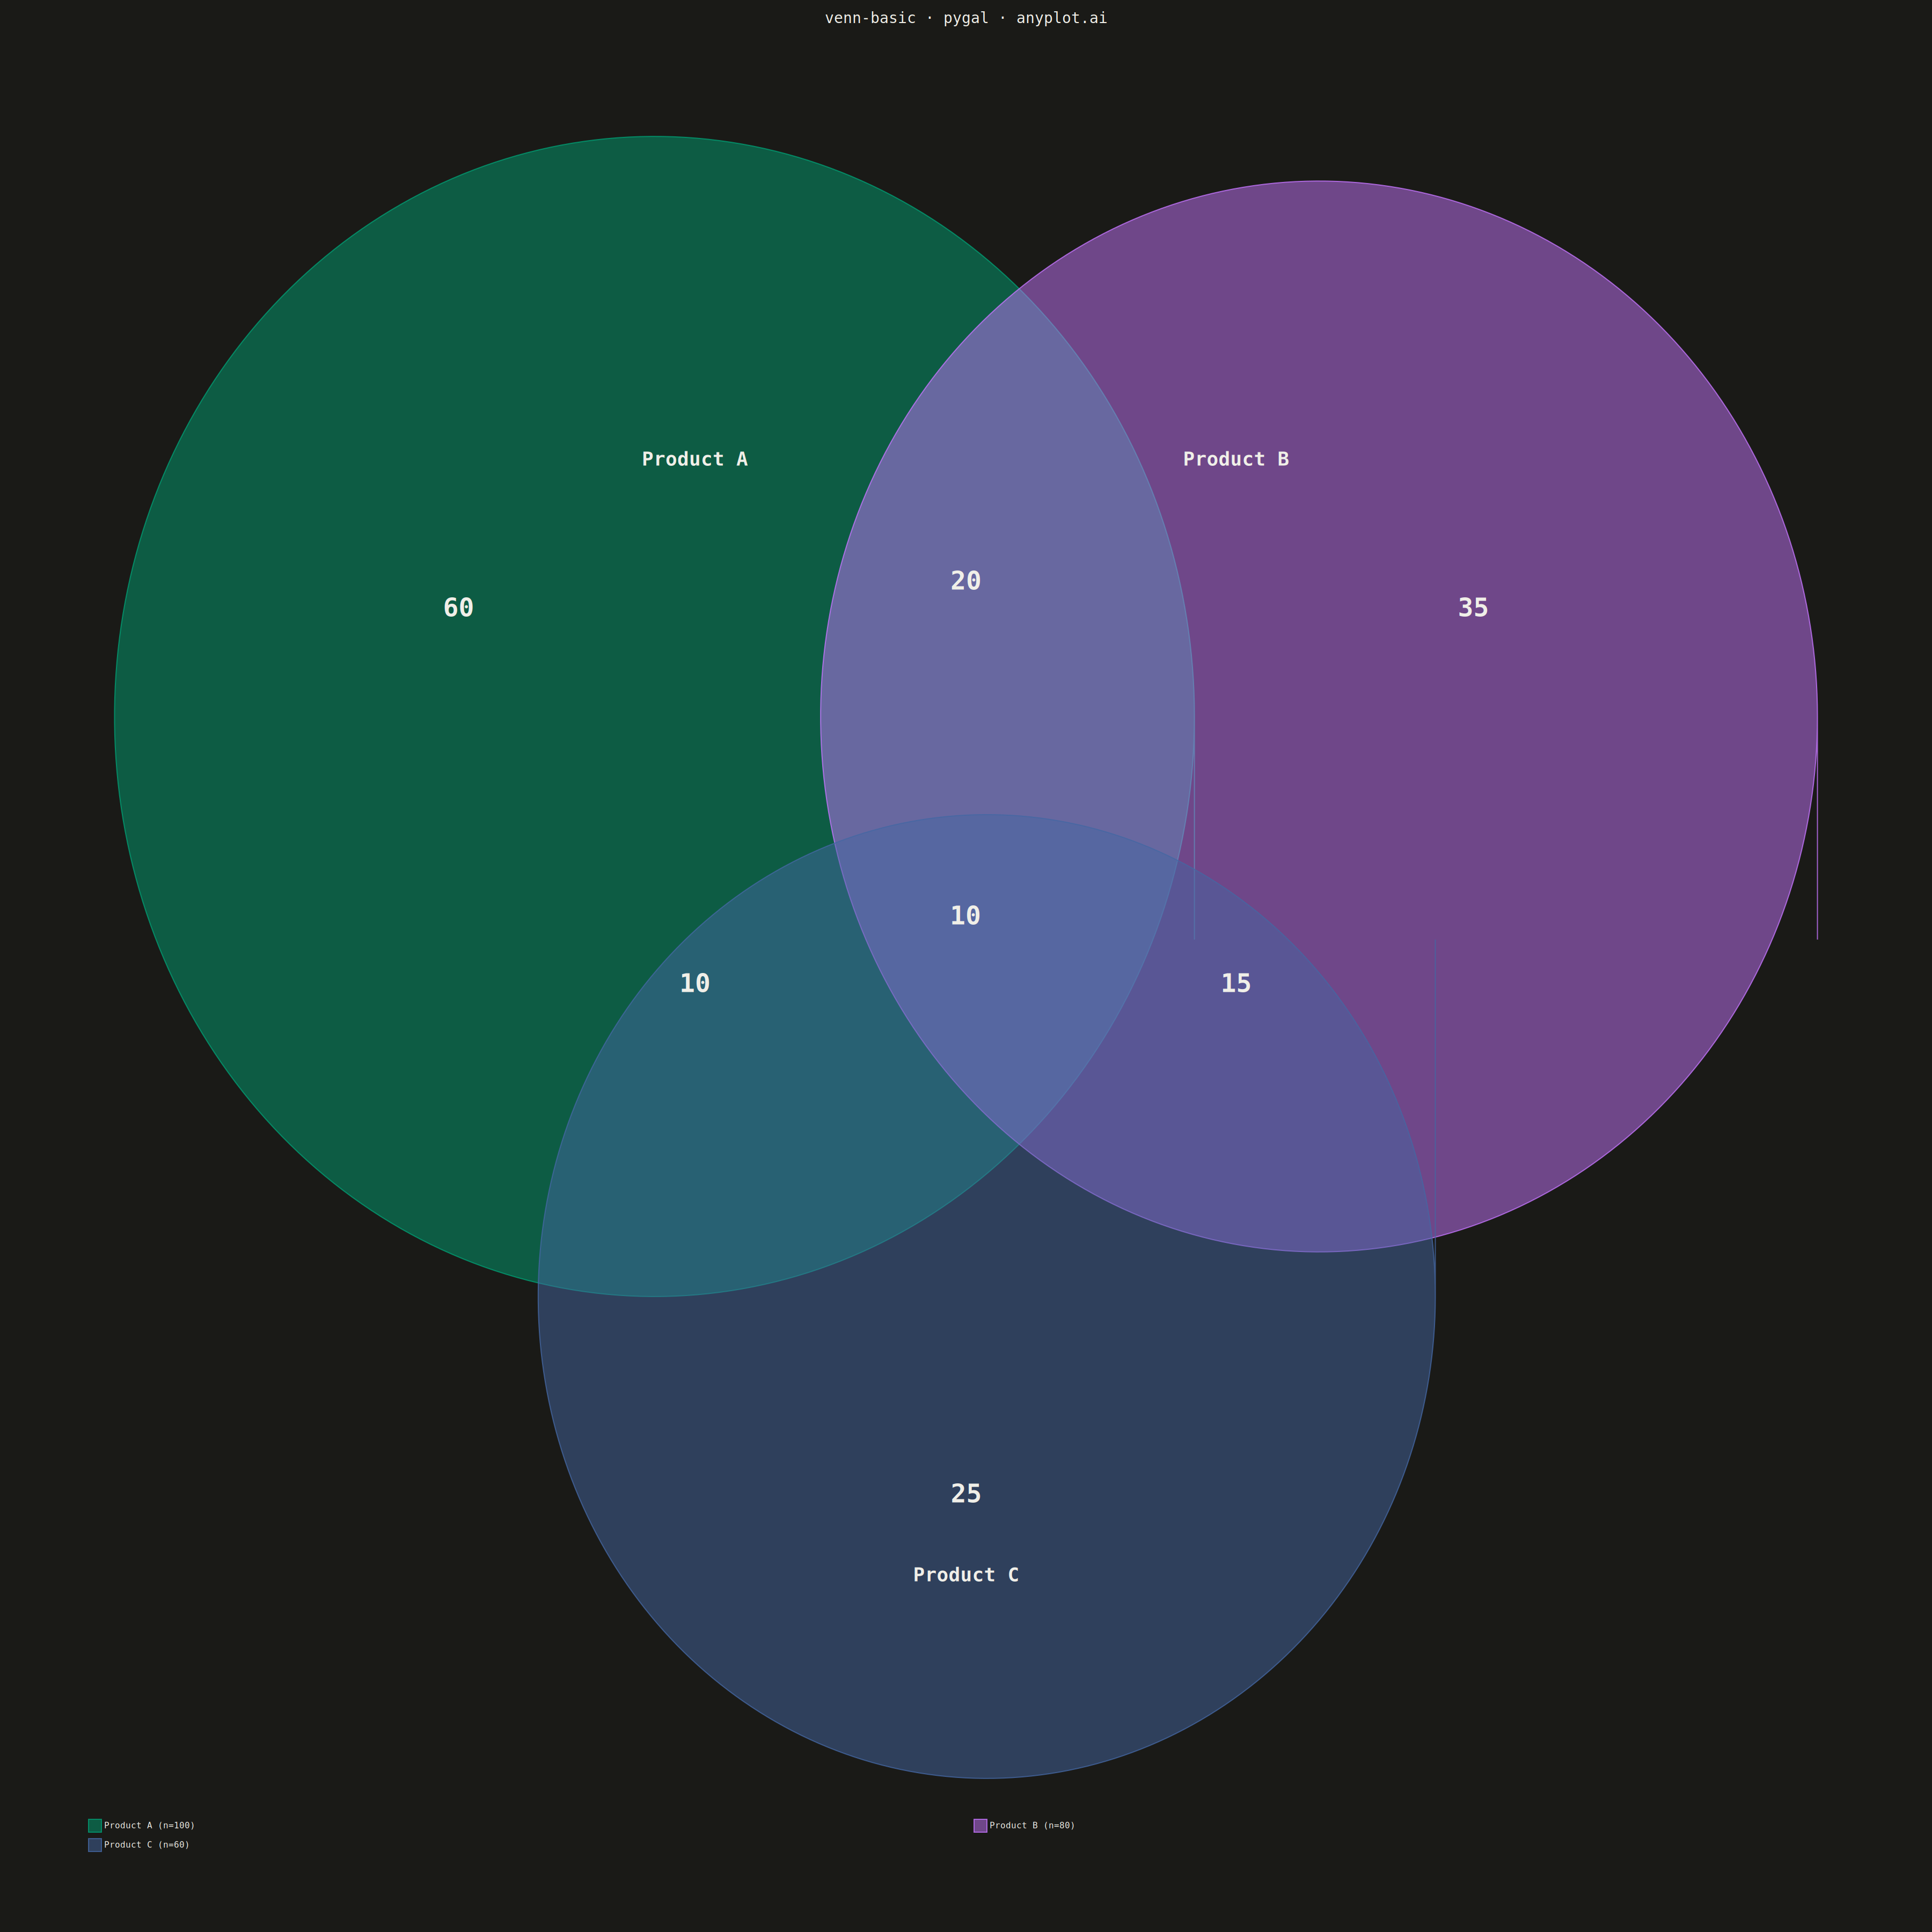
A Venn diagram visualizes the logical relationships between two or three sets using overlapping circles. Each circle represents a set, and overlapping regions show elements shared between sets. This classic visualization is ideal for showing intersections, unions, and exclusive memberships, making abstract set relationships immediately intuitive.
""" anyplot.ai
venn-basic: Venn Diagram
Library: pygal 3.1.0 | Python 3.13.13
Quality: 83/100 | Updated: 2026-05-11
"""

import os

import cairosvg
import numpy as np
import pygal
from pygal.style import Style


THEME = os.getenv("ANYPLOT_THEME", "light")
PAGE_BG = "#FAF8F1" if THEME == "light" else "#1A1A17"
INK = "#1A1A17" if THEME == "light" else "#F0EFE8"
INK_MUTED = "#6B6A63" if THEME == "light" else "#A8A79F"

IMPRINT = ("#009E73", "#C475FD", "#4467A3")

custom_style = Style(
    background=PAGE_BG,
    plot_background=PAGE_BG,
    foreground=INK,
    foreground_strong=INK,
    foreground_subtle=INK_MUTED,
    colors=IMPRINT,
    opacity=0.5,
    title_font_size=28,
    legend_font_size=16,
    label_font_size=18,
    major_label_font_size=16,
    value_font_size=14,
    stroke_width=2,
)

set_labels = ["Product A", "Product B", "Product C"]
set_sizes = [100, 80, 60]

ab_overlap = 30
ac_overlap = 20
bc_overlap = 25
abc_overlap = 10

only_a = set_sizes[0] - ab_overlap - ac_overlap + abc_overlap
only_b = set_sizes[1] - ab_overlap - bc_overlap + abc_overlap
only_c = set_sizes[2] - ac_overlap - bc_overlap + abc_overlap
only_ab = ab_overlap - abc_overlap
only_ac = ac_overlap - abc_overlap
only_bc = bc_overlap - abc_overlap

chart = pygal.XY(
    width=3600,
    height=3600,
    style=custom_style,
    fill=True,
    stroke=True,
    show_dots=False,
    show_legend=True,
    legend_at_bottom=True,
    legend_box_size=24,
    title="venn-basic · pygal · anyplot.ai",
    show_x_guides=False,
    show_y_guides=False,
    show_x_labels=False,
    show_y_labels=False,
    x_title=None,
    y_title=None,
    margin=150,
    spacing=15,
    explicit_size=True,
)

r_a = 0.65
r_b = 0.60
r_c = 0.54

n_points = 300
theta = np.linspace(0, 2 * np.pi, n_points, endpoint=True)

cx_a, cy_a = -0.4, 0.25
cx_b, cy_b = 0.4, 0.25
cx_c, cy_c = 0.0, -0.40

circle_a = [(cx_a + r_a * np.cos(t), cy_a + r_a * np.sin(t)) for t in theta]
circle_b = [(cx_b + r_b * np.cos(t), cy_b + r_b * np.sin(t)) for t in theta]
circle_c = [(cx_c + r_c * np.cos(t), cy_c + r_c * np.sin(t)) for t in theta]

chart.add(f"{set_labels[0]} (n={set_sizes[0]})", circle_a)
chart.add(f"{set_labels[1]} (n={set_sizes[1]})", circle_b)
chart.add(f"{set_labels[2]} (n={set_sizes[2]})", circle_c)

svg_content = chart.render().decode("utf-8")

scale = 3600 * 0.35
center_x = 3600 / 2
center_y = 3600 / 2

count_style = 'font-size="48px" font-weight="bold" fill="' + INK + '" text-anchor="middle" dominant-baseline="middle"'
name_style = 'font-size="36px" font-weight="bold" fill="' + INK + '" text-anchor="middle" dominant-baseline="middle"'

labels = [
    (center_x + (cx_a - 0.35) * scale, center_y - (cy_a + 0.28) * scale, str(only_a), count_style),
    (center_x + (cx_b + 0.35) * scale, center_y - (cy_b + 0.28) * scale, str(only_b), count_style),
    (center_x + cx_c * scale, center_y - (cy_c - 0.38) * scale, str(only_c), count_style),
    (center_x, center_y - (cy_a + 0.32) * scale, str(only_ab), count_style),
    (
        center_x + ((cx_a + cx_c) / 2 - 0.2) * scale,
        center_y - ((cy_a + cy_c) / 2 + 0.05) * scale,
        str(only_ac),
        count_style,
    ),
    (
        center_x + ((cx_b + cx_c) / 2 + 0.2) * scale,
        center_y - ((cy_b + cy_c) / 2 + 0.05) * scale,
        str(only_bc),
        count_style,
    ),
    (center_x, center_y - ((cy_a + cy_c) / 2 + 0.15) * scale, str(abc_overlap), count_style),
    (center_x + cx_a * scale, center_y - (cy_a + 0.50) * scale, set_labels[0], name_style),
    (center_x + cx_b * scale, center_y - (cy_b + 0.50) * scale, set_labels[1], name_style),
    (center_x + cx_c * scale, center_y - (cy_c - 0.50) * scale, set_labels[2], name_style),
]

text_elements = "\n".join(f'<text x="{x:.0f}" y="{y:.0f}" {s}>{v}</text>' for x, y, v, s in labels)
svg_content = svg_content.replace("</svg>", f"{text_elements}\n</svg>")

with open(f"plot-{THEME}.svg", "w", encoding="utf-8") as f:
    f.write(svg_content)

cairosvg.svg2png(bytestring=svg_content.encode("utf-8"), write_to=f"plot-{THEME}.png")

html_content = f"""<!DOCTYPE html>
<html>
<head>
    <meta charset="utf-8">
    <title>venn-basic - pygal - anyplot.ai</title>
    <style>
        body {{ margin: 0; padding: 20px; background: {PAGE_BG}; display: flex; justify-content: center; }}
        svg {{ max-width: 100%; height: auto; }}
    </style>
</head>
<body>
    {svg_content}
</body>
</html>"""

with open(f"plot-{THEME}.html", "w", encoding="utf-8") as f:
    f.write(html_content)
Runnable source as JSON, for any HTTP client: https://api.anyplot.ai/specs/venn-basic/pygal/code. Any spec id and library id listed in llms-full.txt fit the same URL shape; every URL below is complete and callable.
{
  "spec_id": "venn-basic",
  "language": "python",
  "library": "pygal",
  "page": "https://anyplot.ai/venn-basic/python/pygal",
  "hub": "https://anyplot.ai/venn-basic",
  "code_json": "https://api.anyplot.ai/specs/venn-basic/pygal/code",
  "spec_json": "https://api.anyplot.ai/specs/venn-basic",
  "render_light_png": "https://storage.googleapis.com/anyplot-images/plots/venn-basic/python/pygal/plot-light.png",
  "render_dark_png": "https://storage.googleapis.com/anyplot-images/plots/venn-basic/python/pygal/plot-dark.png",
  "interactive_light_html": "https://storage.googleapis.com/anyplot-images/plots/venn-basic/python/pygal/plot-light.html",
  "interactive_dark_html": "https://storage.googleapis.com/anyplot-images/plots/venn-basic/python/pygal/plot-dark.html",
  "quality_score": 83.0,
  "license": "MIT",
  "guide": "https://anyplot.ai/llms.txt"
}
Part of Venn Diagram on anyplot.ai.