The same plot in 14 other libraries — JavaScript: D3.js, Apache ECharts, Highcharts, MUI X Charts; Python: Altair, Bokeh, lets-plot, Matplotlib, Plotly, plotnine, Pygal, Seaborn; R: ggplot2; Julia: Makie.jl. Compare all 15 side by side: Split Violin Plot in Python, R, Julia and JavaScript.
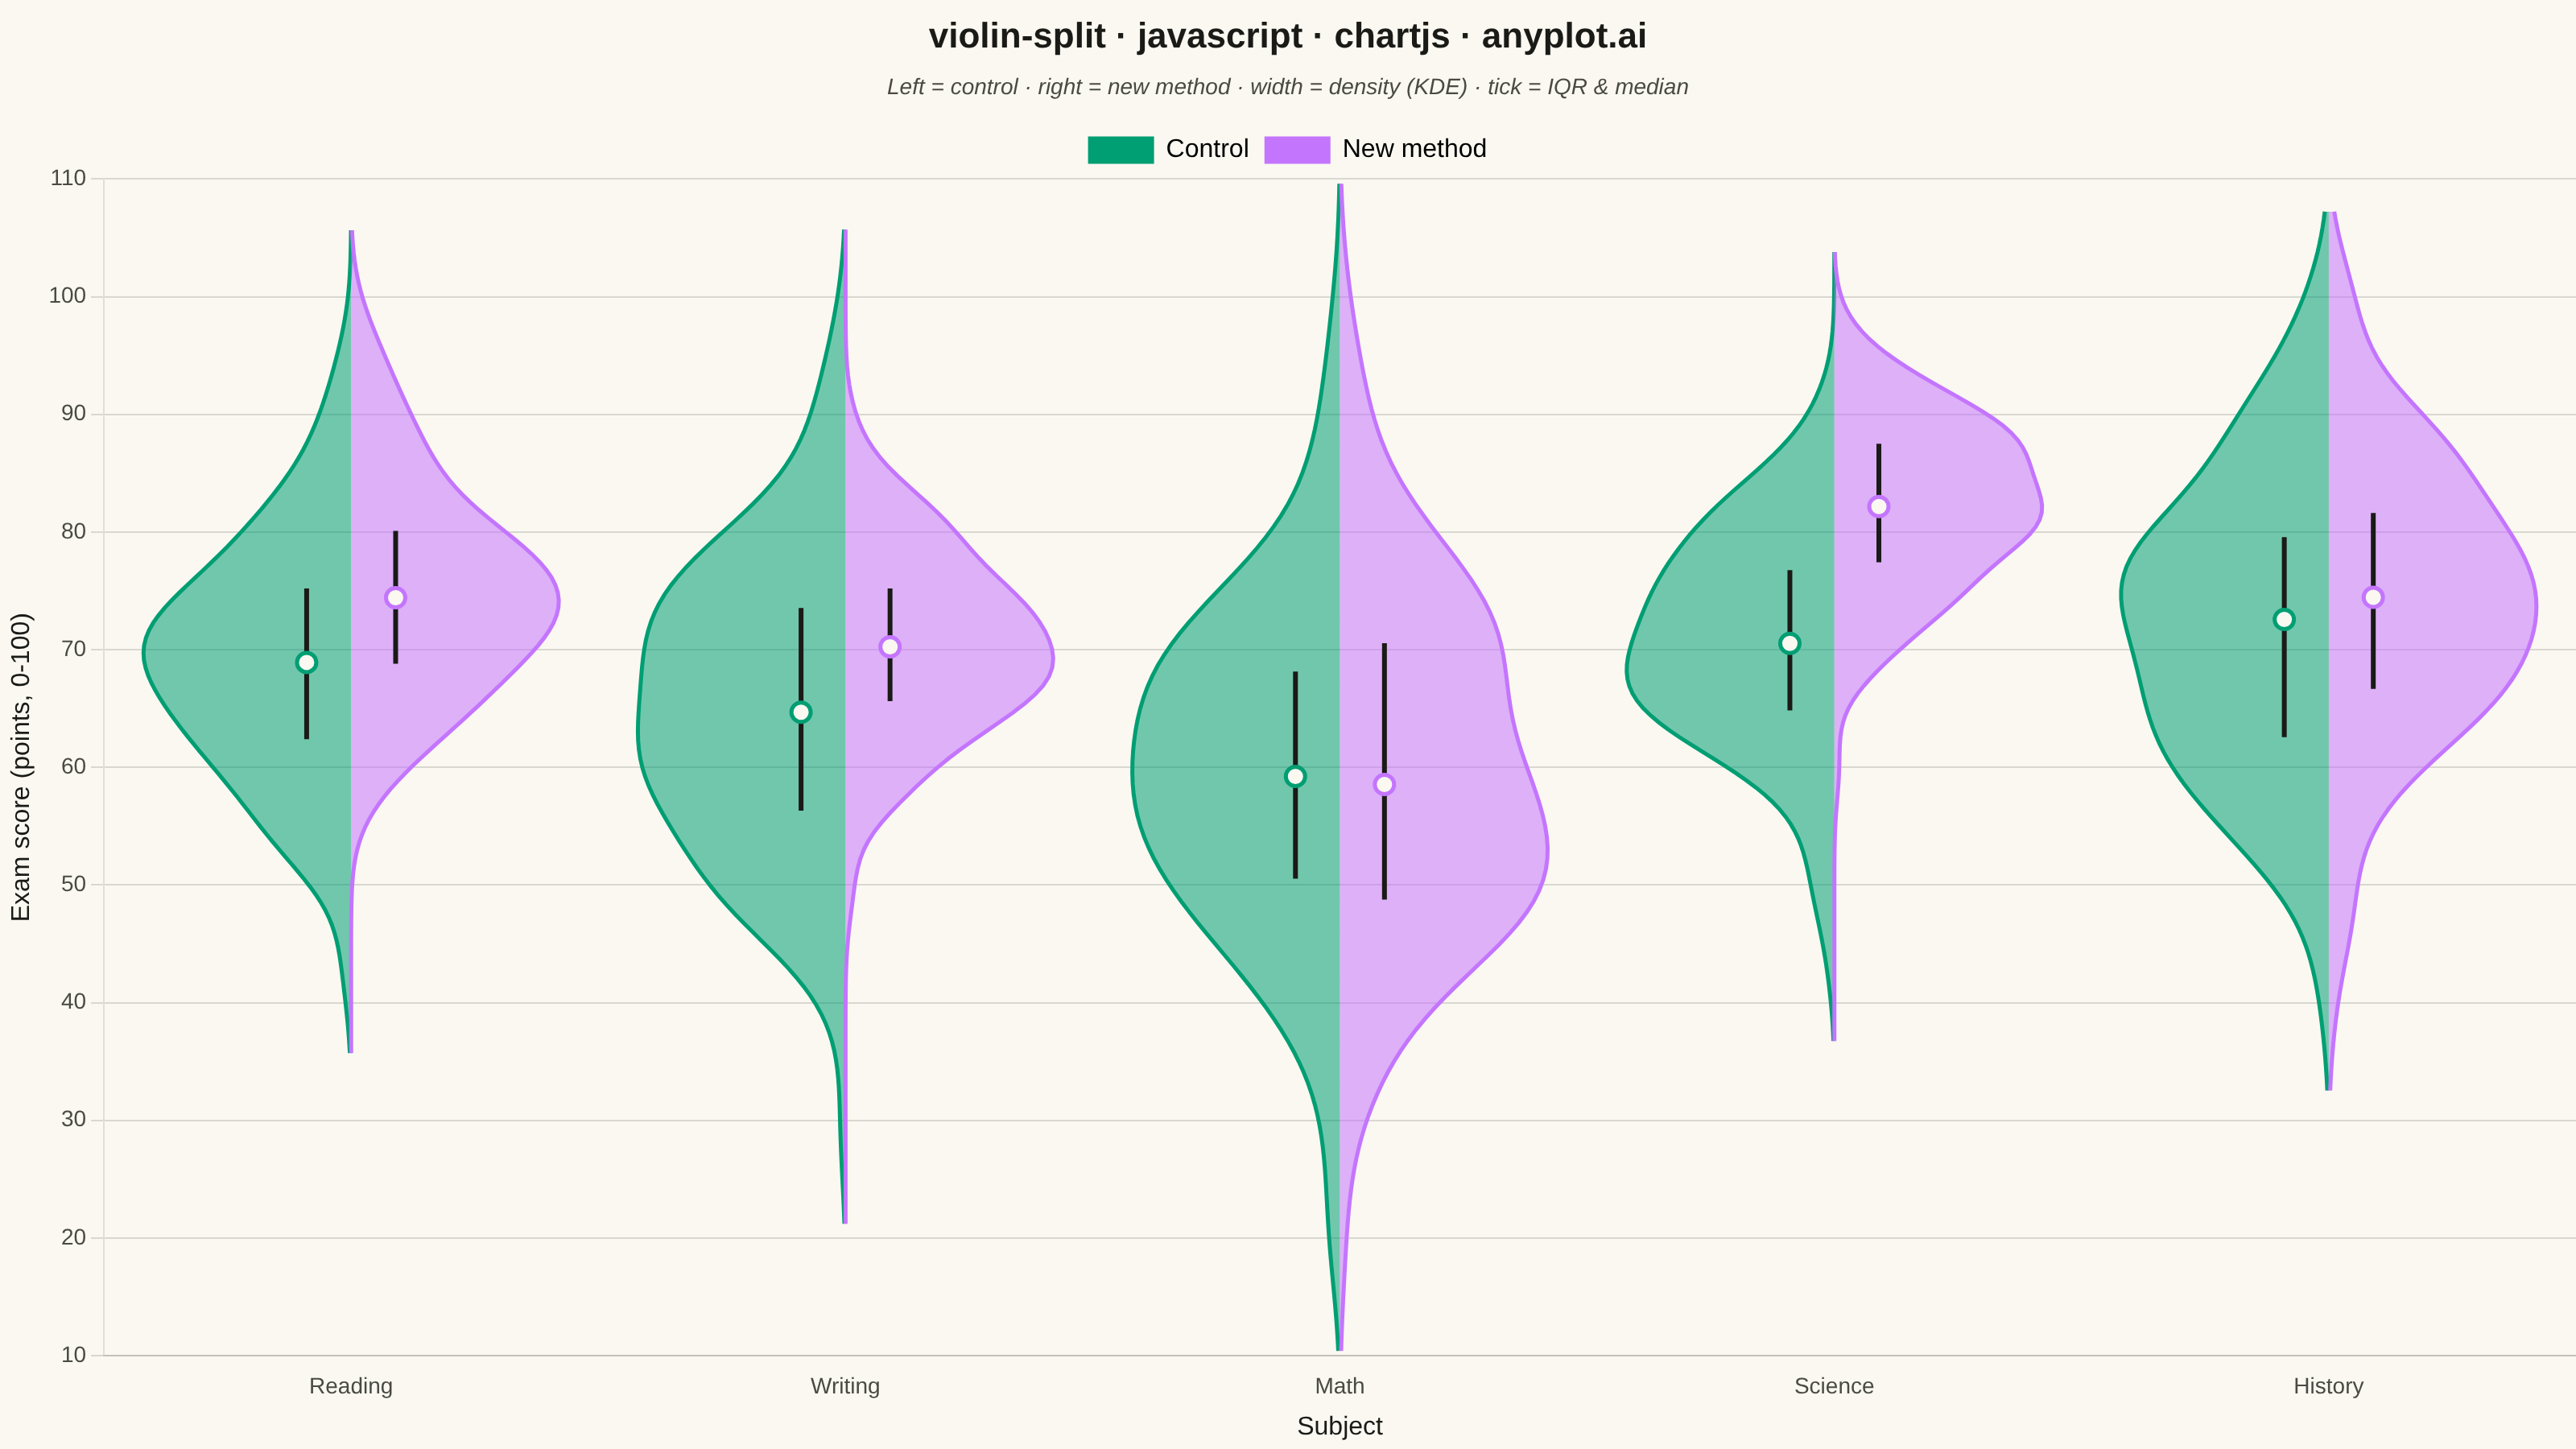
A split violin plot displaying two distributions side-by-side within each violin, with each half representing a different group. Unlike standard violin plots that mirror the same distribution, split violins use the left and right halves to compare two conditions (such as before/after, male/female, or control/treatment) at each category level. This enables direct visual comparison of distribution shapes between paired groups.
// anyplot.ai
// violin-split: Split Violin Plot
// Library: chartjs 4.4.7 | JavaScript 22.23.2
// Quality: 89/100 | Created: 2026-09-09

const t = window.ANYPLOT_TOKENS;

// --- Deterministic PRNG (LCG) + samplers ------------------------------------
function makeLcg(seed) {
  let state = seed >>> 0;
  return function next() {
    state = (Math.imul(1664525, state) + 1013904223) >>> 0;
    return state / 4294967296;
  };
}

function randNormal(rng, mean, std) {
  const u1 = Math.max(rng(), 1e-9);
  const u2 = rng();
  const z = Math.sqrt(-2 * Math.log(u1)) * Math.cos(2 * Math.PI * u2);
  return mean + z * std;
}

function clamp(value, min, max) {
  return Math.min(max, Math.max(min, value));
}

// --- Data: exam scores by subject, control vs. new-teaching-method cohort --
const rng = makeLcg(2026);
const sampleSize = 130;

function sampleGroup(mean, std) {
  return Array.from({ length: sampleSize }, () => clamp(randNormal(rng, mean, std), 20, 100));
}

const subjects = [
  { name: "Reading", control: [68, 10], treatment: [74, 9] },
  { name: "Writing", control: [65, 12], treatment: [71, 8] },
  { name: "Math", control: [60, 14], treatment: [60, 14] },
  { name: "Science", control: [70, 9], treatment: [82, 7] },
  { name: "History", control: [72, 11], treatment: [75, 13] },
];

// --- Stats helpers -----------------------------------------------------------
function mean(values) {
  return values.reduce((sum, v) => sum + v, 0) / values.length;
}

function std(values, m) {
  const variance = values.reduce((sum, v) => sum + (v - m) ** 2, 0) / (values.length - 1);
  return Math.sqrt(variance);
}

function silvermanBandwidth(values) {
  return 1.06 * std(values, mean(values)) * values.length ** (-1 / 5);
}

function gaussianKde(values, evalPoints, bandwidth) {
  const norm = 1 / (values.length * bandwidth * Math.sqrt(2 * Math.PI));
  return evalPoints.map((point) => {
    let sum = 0;
    for (const v of values) {
      const u = (point - v) / bandwidth;
      sum += Math.exp(-0.5 * u * u);
    }
    return sum * norm;
  });
}

function quantile(sortedValues, q) {
  const idx = q * (sortedValues.length - 1);
  const lower = Math.floor(idx);
  const upper = Math.ceil(idx);
  if (lower === upper) return sortedValues[lower];
  return sortedValues[lower] + (sortedValues[upper] - sortedValues[lower]) * (idx - lower);
}

// --- Build a mirrored KDE half for each cohort, sharing one y-grid per subject
// so the two halves meet exactly at the category's center line -------------
const gridSize = 110;
const maxHalfWidth = 0.42;
const innerOffset = 0.09; // quartile/median marker distance from the center line

const violins = subjects.map((subject, i) => {
  const catX = i + 1;
  const control = sampleGroup(...subject.control);
  const treatment = sampleGroup(...subject.treatment);
  const sortedControl = [...control].sort((a, b) => a - b);
  const sortedTreatment = [...treatment].sort((a, b) => a - b);

  const combinedMin = Math.min(sortedControl[0], sortedTreatment[0]);
  const combinedMax = Math.max(sortedControl[sortedControl.length - 1], sortedTreatment[sortedTreatment.length - 1]);
  const pad = (combinedMax - combinedMin) * 0.12;
  const yMin = combinedMin - pad;
  const yMax = combinedMax + pad;
  const step = (yMax - yMin) / (gridSize - 1);
  const evalPoints = Array.from({ length: gridSize }, (_, j) => yMin + j * step);

  const densityControl = gaussianKde(control, evalPoints, silvermanBandwidth(sortedControl));
  const densityTreatment = gaussianKde(treatment, evalPoints, silvermanBandwidth(sortedTreatment));
  const scaleControl = maxHalfWidth / Math.max(...densityControl);
  const scaleTreatment = maxHalfWidth / Math.max(...densityTreatment);

  const statsFor = (sorted) => ({
    q1: quantile(sorted, 0.25),
    median: quantile(sorted, 0.5),
    q3: quantile(sorted, 0.75),
  });

  return {
    catX,
    evalPoints,
    densityControl,
    scaleControl,
    densityTreatment,
    scaleTreatment,
    stats: { control: statsFor(sortedControl), treatment: statsFor(sortedTreatment) },
    raw: [...control, ...treatment],
  };
});

// --- Mount -------------------------------------------------------------------
const canvas = document.createElement("canvas");
document.getElementById("container").appendChild(canvas);

function hexToRgba(hex, alpha) {
  const r = parseInt(hex.slice(1, 3), 16);
  const g = parseInt(hex.slice(3, 5), 16);
  const b = parseInt(hex.slice(5, 7), 16);
  return `rgba(${r}, ${g}, ${b}, ${alpha})`;
}

const controlColor = t.palette[0];
const treatmentColor = t.palette[1];

// Round to clean tick bounds based on the raw (clamped) data range so a
// single skewed subject's KDE padding can't dictate the shared axis extent.
const rawValues = violins.flatMap((v) => v.raw);
const rawMin = Math.min(...rawValues);
const rawMax = Math.max(...rawValues);
const axisPad = (rawMax - rawMin) * 0.08;
const yAxisMin = Math.floor((rawMin - axisPad) / 5) * 5;
const yAxisMax = Math.ceil((rawMax + axisPad) / 5) * 5;

// --- Split violins + quartile/median markers: hand-drawn on the canvas ----
// with the canvas API in a plugin hook, using the chart's own linear x/y
// scales for pixel mapping. Chart.js has no built-in violin type, and its
// line-dataset "fill" option only fills between two curves that share the
// same index axis — it cannot fill a horizontally-varying silhouette like a
// violin half, so the shape is drawn directly instead of faked through fill.
function drawHalf(ctx, centerXpx, points, color) {
  ctx.save();
  ctx.beginPath();
  ctx.moveTo(centerXpx, points[0].yPx);
  points.forEach((p) => ctx.lineTo(p.xPx, p.yPx));
  ctx.lineTo(centerXpx, points[points.length - 1].yPx);
  ctx.closePath();
  ctx.fillStyle = hexToRgba(color, 0.55);
  ctx.fill();
  ctx.restore();

  ctx.save();
  ctx.beginPath();
  points.forEach((p, j) => (j === 0 ? ctx.moveTo(p.xPx, p.yPx) : ctx.lineTo(p.xPx, p.yPx)));
  ctx.strokeStyle = color;
  ctx.lineWidth = 2.5;
  ctx.stroke();
  ctx.restore();
}

function drawMarker(ctx, cxPx, stats, scaleY, color) {
  const yQ1 = scaleY.getPixelForValue(stats.q1);
  const yQ3 = scaleY.getPixelForValue(stats.q3);
  const yMed = scaleY.getPixelForValue(stats.median);

  ctx.save();
  ctx.strokeStyle = t.ink;
  ctx.lineWidth = 3;
  ctx.beginPath();
  ctx.moveTo(cxPx, yQ3);
  ctx.lineTo(cxPx, yQ1);
  ctx.stroke();

  ctx.beginPath();
  ctx.arc(cxPx, yMed, 6, 0, 2 * Math.PI);
  ctx.fillStyle = t.pageBg;
  ctx.fill();
  ctx.strokeStyle = color;
  ctx.lineWidth = 2.5;
  ctx.stroke();
  ctx.restore();
}

const splitViolinPlugin = {
  id: "splitViolin",
  afterDraw(chart) {
    const { ctx, scales, chartArea } = chart;

    ctx.save();
    ctx.beginPath();
    ctx.rect(chartArea.left, chartArea.top, chartArea.right - chartArea.left, chartArea.bottom - chartArea.top);
    ctx.clip();

    violins.forEach((violin) => {
      const centerXpx = scales.x.getPixelForValue(violin.catX);
      const leftPoints = violin.evalPoints.map((y, j) => ({
        xPx: scales.x.getPixelForValue(violin.catX - violin.densityControl[j] * violin.scaleControl),
        yPx: scales.y.getPixelForValue(y),
      }));
      const rightPoints = violin.evalPoints.map((y, j) => ({
        xPx: scales.x.getPixelForValue(violin.catX + violin.densityTreatment[j] * violin.scaleTreatment),
        yPx: scales.y.getPixelForValue(y),
      }));
      drawHalf(ctx, centerXpx, leftPoints, controlColor);
      drawHalf(ctx, centerXpx, rightPoints, treatmentColor);
    });

    violins.forEach((violin) => {
      const leftXpx = scales.x.getPixelForValue(violin.catX - innerOffset);
      const rightXpx = scales.x.getPixelForValue(violin.catX + innerOffset);
      drawMarker(ctx, leftXpx, violin.stats.control, scales.y, controlColor);
      drawMarker(ctx, rightXpx, violin.stats.treatment, scales.y, treatmentColor);
    });

    ctx.restore();
  },
};

// --- Chart -------------------------------------------------------------------
new Chart(canvas, {
  type: "scatter",
  data: { datasets: [] },
  options: {
    responsive: true,
    maintainAspectRatio: false,
    animation: false,
    plugins: {
      title: {
        display: true,
        text: "violin-split · javascript · chartjs · anyplot.ai",
        color: t.ink,
        font: { size: 22 },
      },
      subtitle: {
        display: true,
        text: "Left = control · right = new method · width = density (KDE) · tick = IQR & median",
        color: t.inkSoft,
        font: { size: 14, style: "italic" },
        padding: { bottom: 12 },
      },
      legend: {
        labels: {
          color: t.ink,
          font: { size: 16 },
          generateLabels: () => [
            { text: "Control", fillStyle: controlColor, strokeStyle: controlColor, pointStyle: "rect" },
            { text: "New method", fillStyle: treatmentColor, strokeStyle: treatmentColor, pointStyle: "rect" },
          ],
        },
      },
      tooltip: { enabled: false },
    },
    scales: {
      x: {
        type: "linear",
        min: 0.5,
        max: subjects.length + 0.5,
        afterBuildTicks: (axis) => {
          axis.ticks = subjects.map((_, i) => ({ value: i + 1 }));
        },
        ticks: {
          color: t.inkSoft,
          font: { size: 14 },
          callback: (value) => subjects[Math.round(value) - 1]?.name ?? "",
        },
        grid: { display: false },
        title: { display: true, text: "Subject", color: t.ink, font: { size: 16 } },
      },
      y: {
        min: yAxisMin,
        max: yAxisMax,
        ticks: { color: t.inkSoft, font: { size: 14 } },
        grid: { color: t.grid },
        title: { display: true, text: "Exam score (points, 0-100)", color: t.ink, font: { size: 16 } },
      },
    },
  },
  plugins: [splitViolinPlugin],
});
Runnable source as JSON, for any HTTP client: https://api.anyplot.ai/specs/violin-split/chartjs/code. Any spec id and library id listed in llms-full.txt fit the same URL shape; every URL below is complete and callable.
{
  "spec_id": "violin-split",
  "language": "javascript",
  "library": "chartjs",
  "page": "https://anyplot.ai/violin-split/javascript/chartjs",
  "hub": "https://anyplot.ai/violin-split",
  "code_json": "https://api.anyplot.ai/specs/violin-split/chartjs/code",
  "spec_json": "https://api.anyplot.ai/specs/violin-split",
  "render_light_png": "https://storage.googleapis.com/anyplot-images/plots/violin-split/javascript/chartjs/plot-light.png",
  "render_dark_png": "https://storage.googleapis.com/anyplot-images/plots/violin-split/javascript/chartjs/plot-dark.png",
  "interactive_light_html": "https://storage.googleapis.com/anyplot-images/plots/violin-split/javascript/chartjs/plot-light.html",
  "interactive_dark_html": "https://storage.googleapis.com/anyplot-images/plots/violin-split/javascript/chartjs/plot-dark.html",
  "quality_score": 89.0,
  "license": "MIT",
  "guide": "https://anyplot.ai/llms.txt"
}
Part of Split Violin Plot on anyplot.ai.