The same plot in 14 other libraries — JavaScript: Chart.js, D3.js, Highcharts, MUI X Charts; Python: Altair, Bokeh, lets-plot, Matplotlib, Plotly, plotnine, Pygal, Seaborn; R: ggplot2; Julia: Makie.jl. Compare all 15 side by side: Split Violin Plot in Python, R, Julia and JavaScript.
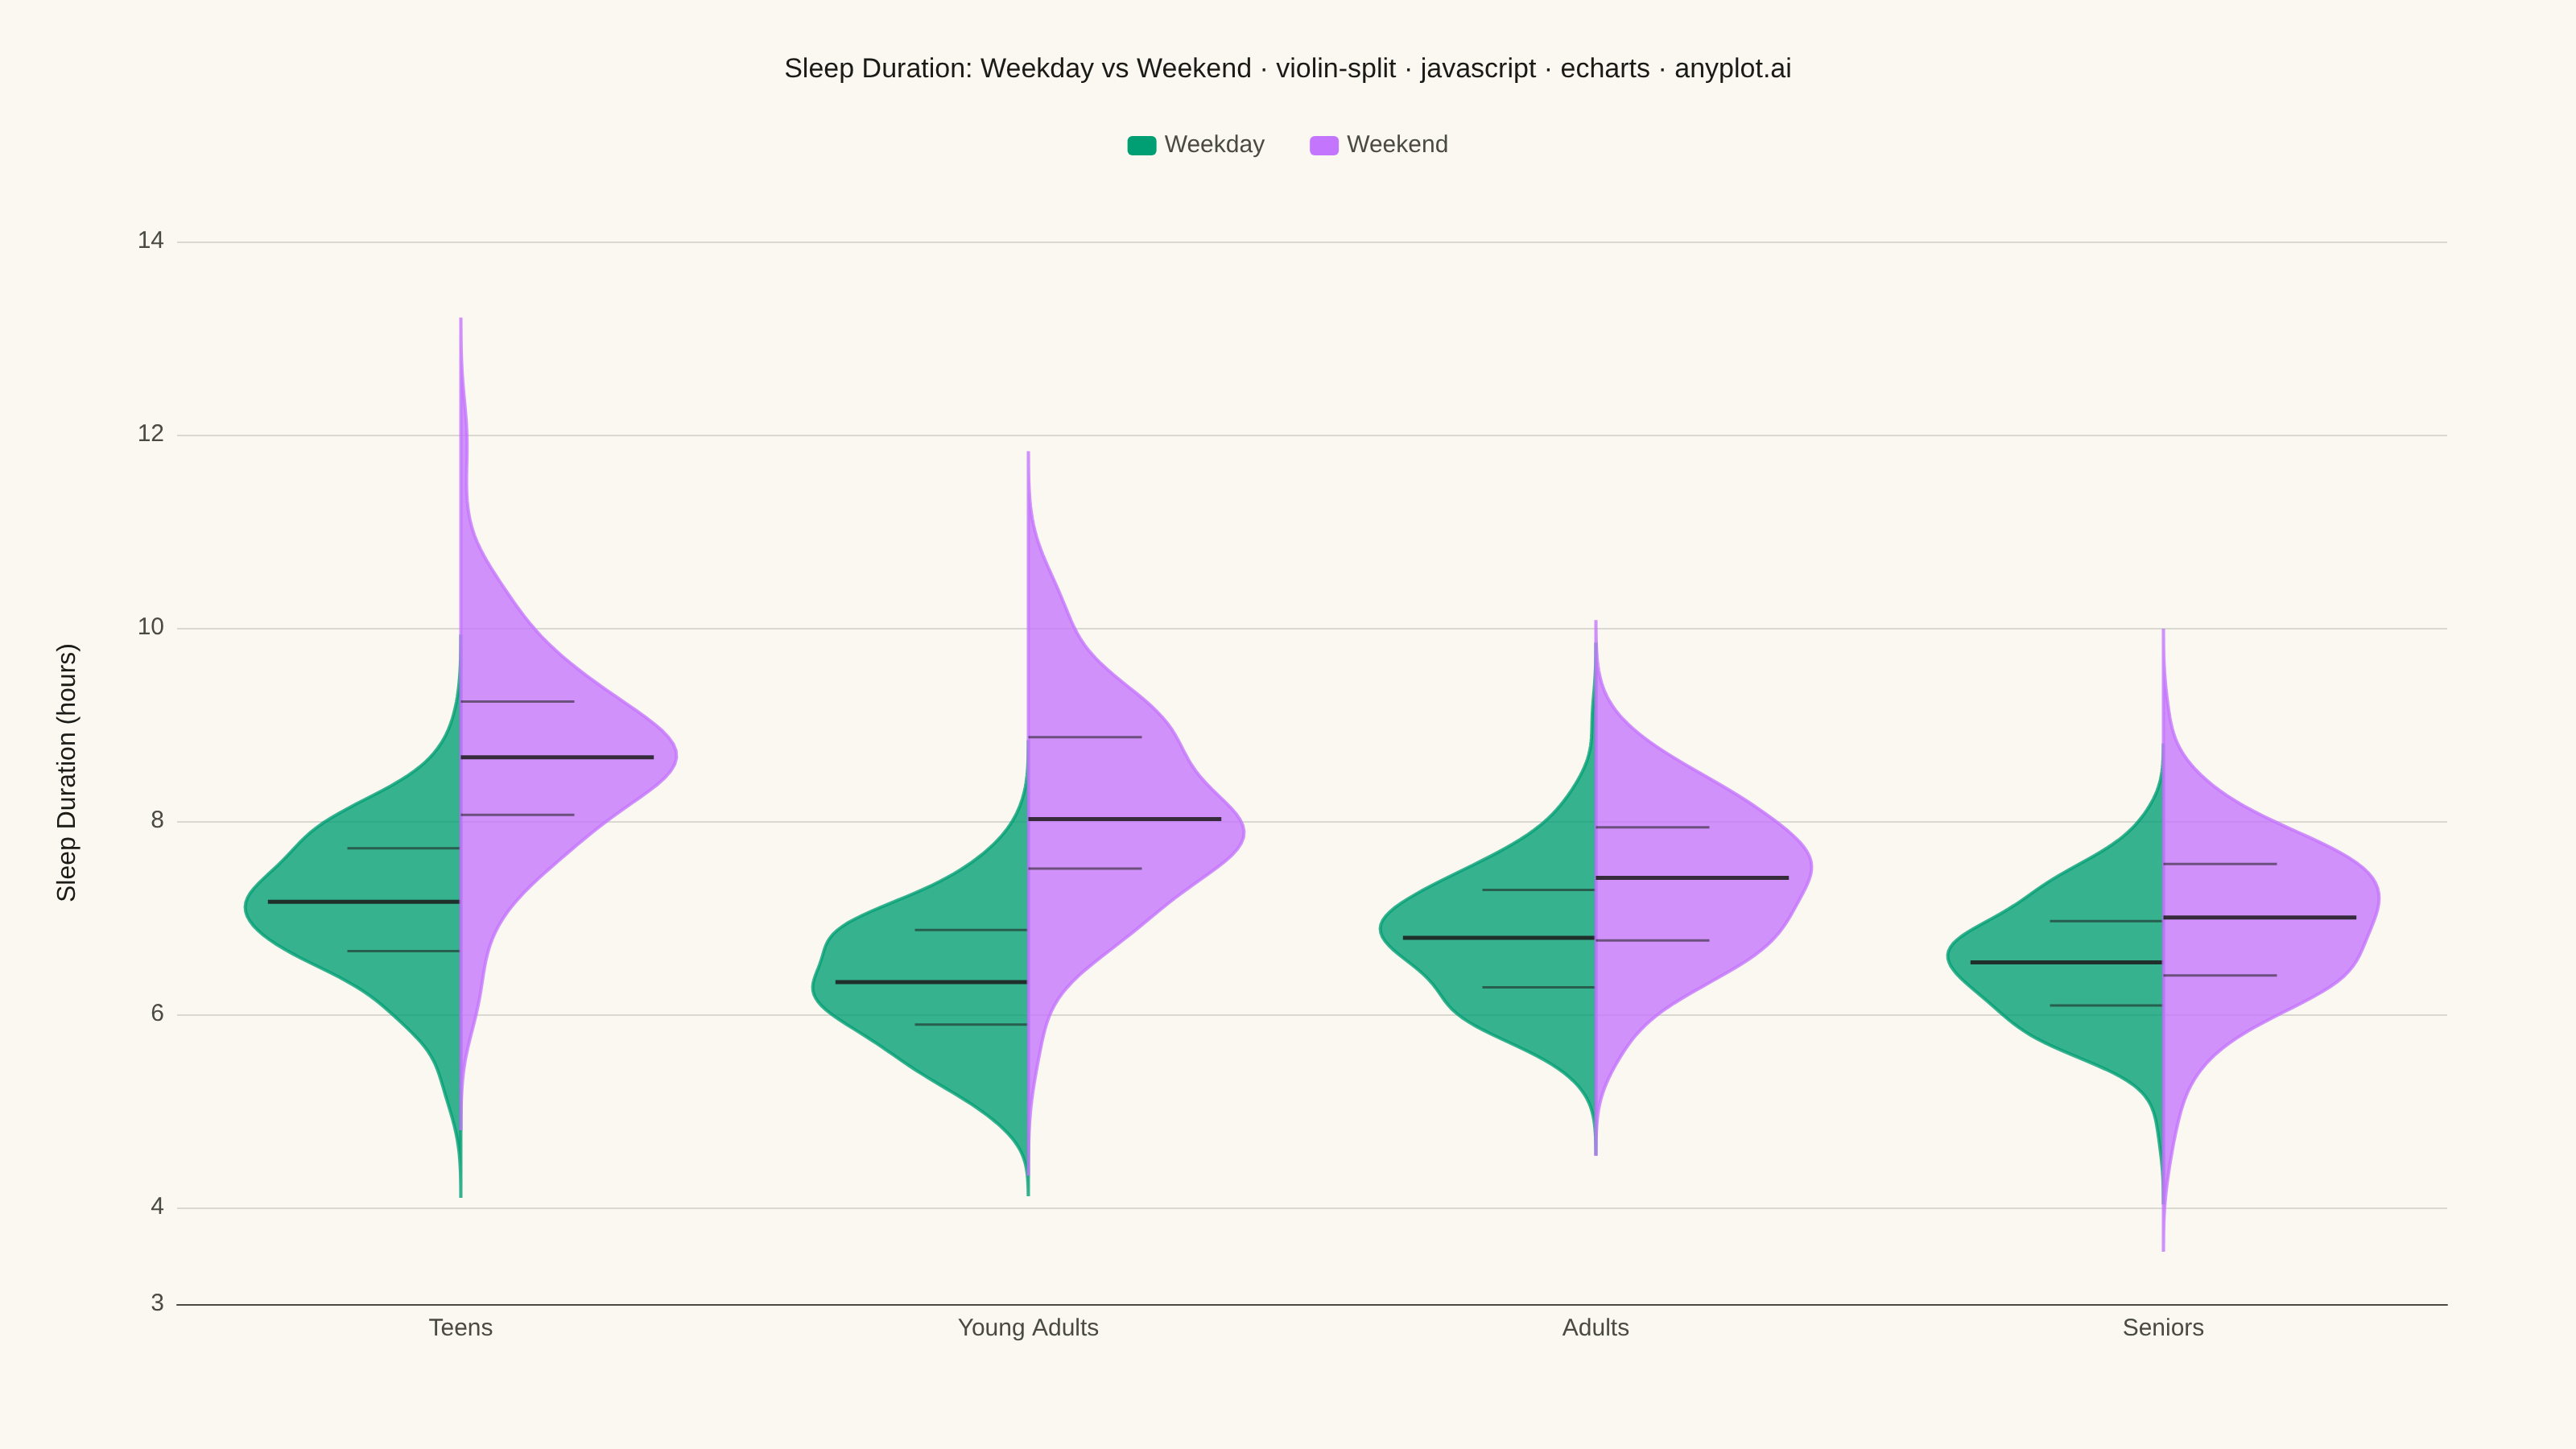
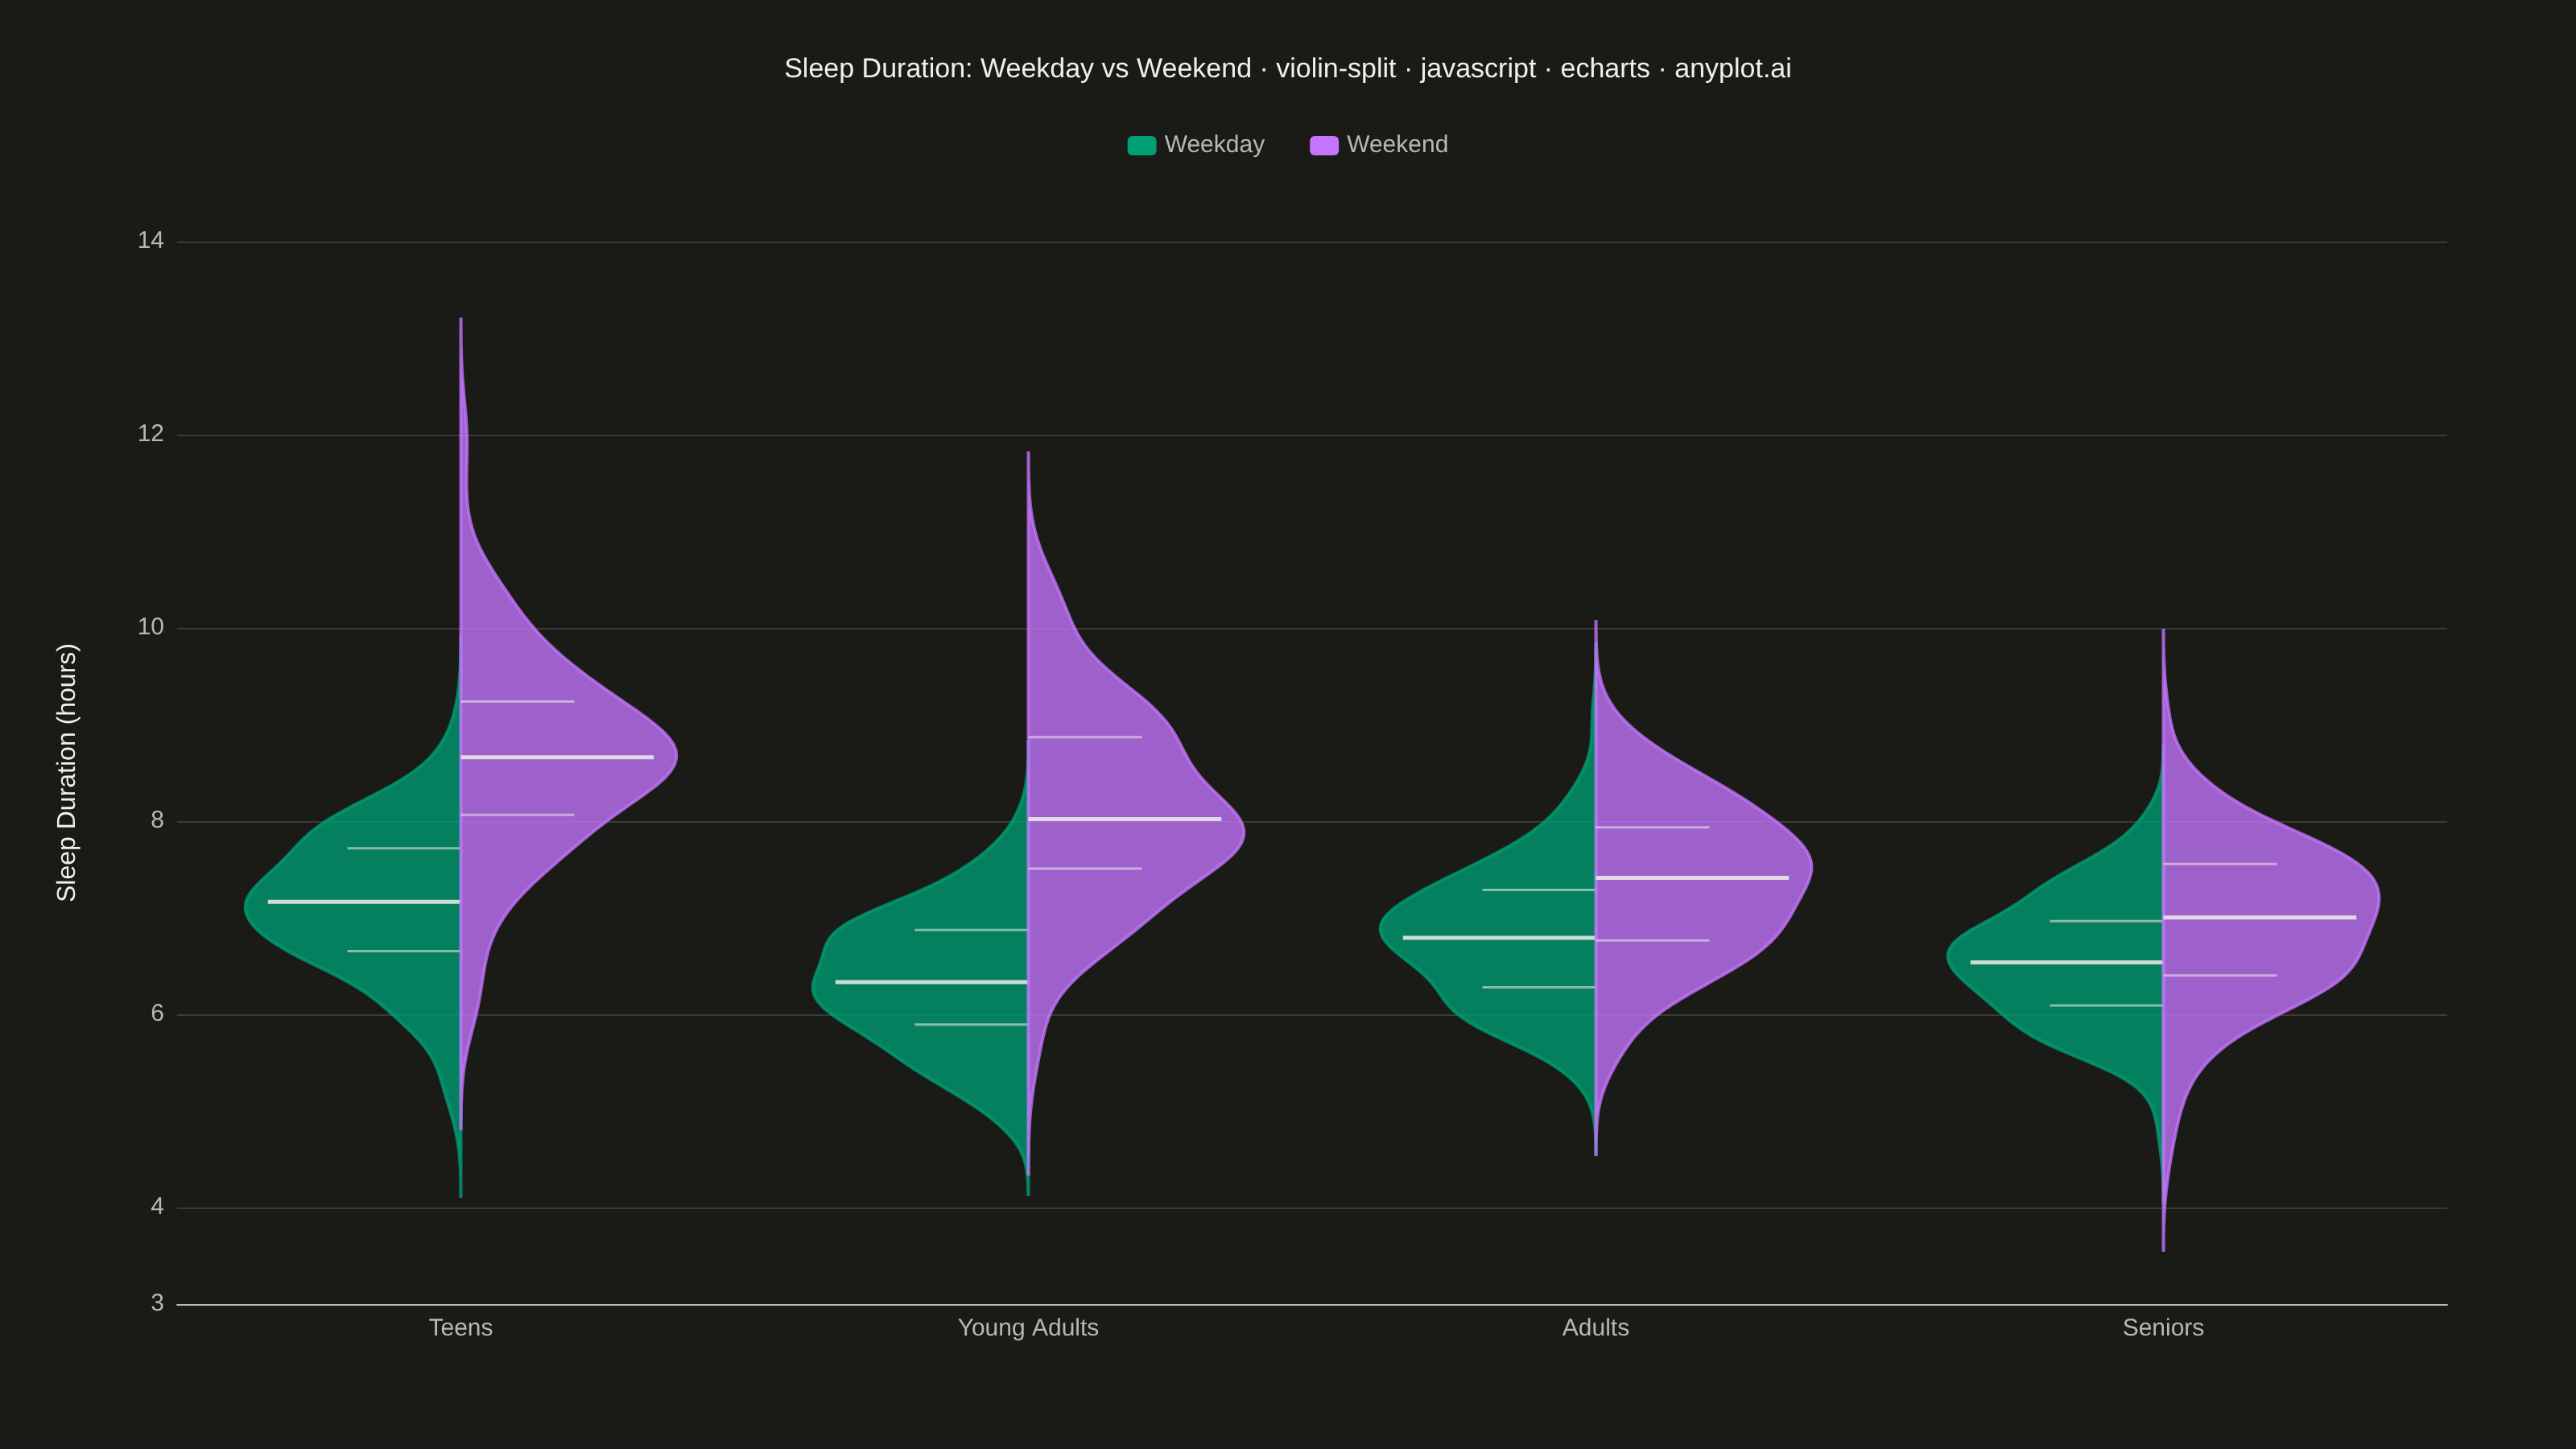
A split violin plot displaying two distributions side-by-side within each violin, with each half representing a different group. Unlike standard violin plots that mirror the same distribution, split violins use the left and right halves to compare two conditions (such as before/after, male/female, or control/treatment) at each category level. This enables direct visual comparison of distribution shapes between paired groups.
// anyplot.ai
// violin-split: Split Violin Plot
// Library: echarts 6.1.0 | JavaScript 22.23.2
// Quality: 90/100 | Created: 2026-09-09

const t = window.ANYPLOT_TOKENS;

// --- Data (in-memory, deterministic) ----------------------------------------
// Nightly sleep duration (hours) by age group, split into weekday vs weekend
// nights. Weekend distributions shift right (later wake times) and widen —
// the split violin makes the shift and the spread change visible at once.
function lcg(seed) {
  let state = seed >>> 0;
  return () => {
    state = (state * 1664525 + 1013904223) >>> 0;
    return state / 4294967296;
  };
}
const rand = lcg(42);
function randNormal(mean, std) {
  const u1 = Math.max(rand(), 1e-9);
  const u2 = rand();
  const z = Math.sqrt(-2 * Math.log(u1)) * Math.cos(2 * Math.PI * u2);
  return mean + z * std;
}

const CATEGORIES = ["Teens", "Young Adults", "Adults", "Seniors"];
const N = 180;
const weekdayMeans = [7.1, 6.4, 6.8, 6.6];
const weekdayStds = [0.8, 0.75, 0.65, 0.7];
const weekendMeans = [8.7, 8.1, 7.3, 6.9];
const weekendStds = [1.1, 1.05, 0.85, 0.75];

const weekdayByCategory = CATEGORIES.map((_, i) =>
  Array.from({ length: N }, () => Math.max(2, randNormal(weekdayMeans[i], weekdayStds[i])))
);
const weekendByCategory = CATEGORIES.map((_, i) =>
  Array.from({ length: N }, () => Math.max(2, randNormal(weekendMeans[i], weekendStds[i])))
);

// --- Stats helpers ------------------------------------------------------------
function quantile(sorted, p) {
  const idx = p * (sorted.length - 1);
  const lo = Math.floor(idx);
  const hi = Math.ceil(idx);
  if (lo === hi) return sorted[lo];
  return sorted[lo] + (sorted[hi] - sorted[lo]) * (idx - lo);
}
function median(values) {
  return quantile([...values].sort((a, b) => a - b), 0.5);
}
function quartiles(values) {
  const sorted = [...values].sort((a, b) => a - b);
  return { q1: quantile(sorted, 0.25), q3: quantile(sorted, 0.75) };
}

// Each half's KDE is evaluated over its OWN local range (data extent ±3
// bandwidths), so a tight distribution doesn't get stretched into a thin
// needle spanning the taller group's full range. The local range is NOT
// clamped to the axis bounds — the axis padding below is sized to always
// clear the widest local range, so every tail tapers to ~0 density instead
// of being cut off flat at the axis edge.
function kde(values, gridN) {
  const mean = values.reduce((a, b) => a + b, 0) / values.length;
  const variance = values.reduce((a, b) => a + (b - mean) ** 2, 0) / values.length;
  const std = Math.sqrt(variance);
  const bandwidth = 1.06 * std * Math.pow(values.length, -0.2);
  const localMin = Math.min(...values) - 3 * bandwidth;
  const localMax = Math.max(...values) + 3 * bandwidth;
  const points = [];
  for (let i = 0; i <= gridN; i++) {
    const y = localMin + (i / gridN) * (localMax - localMin);
    let sum = 0;
    for (const v of values) {
      const u = (y - v) / bandwidth;
      sum += Math.exp(-0.5 * u * u);
    }
    points.push({ y, density: sum / (values.length * bandwidth * Math.sqrt(2 * Math.PI)) });
  }
  return { points, localMin, localMax };
}

const kdeWeekday = weekdayByCategory.map((vals) => kde(vals, 120));
const kdeWeekend = weekendByCategory.map((vals) => kde(vals, 120));
const medianWeekday = weekdayByCategory.map(median);
const medianWeekend = weekendByCategory.map(median);
const quartilesWeekday = weekdayByCategory.map(quartiles);
const quartilesWeekend = weekendByCategory.map(quartiles);

// Axis range comes from the 1st/99th percentile of the raw data padded out
// to the widest KDE local range — a lone normal-tail outlier (rare but
// expected across 1,440 draws) can't stretch the chart, yet every KDE curve
// still has enough headroom to taper to zero before the axis edge.
const allValues = weekdayByCategory.flat().concat(weekendByCategory.flat()).sort((a, b) => a - b);
const allLocalMins = kdeWeekday.concat(kdeWeekend).map((k) => k.localMin);
const allLocalMaxs = kdeWeekday.concat(kdeWeekend).map((k) => k.localMax);
const axisMin = Math.floor(Math.min(quantile(allValues, 0.01) - 0.5, ...allLocalMins));
const axisMax = Math.ceil(Math.max(quantile(allValues, 0.99) + 0.5, ...allLocalMaxs));

// --- Init -----------------------------------------------------------------
const chart = echarts.init(document.getElementById("container"));

// --- Custom renderers -------------------------------------------------------
function halfShape(idx, points, side, api) {
  const maxDensity = Math.max(...points.map((p) => p.density));
  const bandWidth = api.size([1, 0])[0];
  const halfWidthPx = bandWidth * 0.38;
  const sign = side === "left" ? -1 : 1;

  const curve = points.map((p) => {
    const [x, y] = api.coord([idx, p.y]);
    return [x + sign * halfWidthPx * (p.density / maxDensity), y];
  });
  const spine = points
    .slice()
    .reverse()
    .map((p) => {
      const [x, y] = api.coord([idx, p.y]);
      return [x, y];
    });
  return curve.concat(spine);
}

function quantileTick(idx, value, side, api, { widthFactor, lineWidth, opacity }) {
  const bandWidth = api.size([1, 0])[0];
  const tickWidthPx = bandWidth * widthFactor;
  const sign = side === "left" ? -1 : 1;
  const [cx, cy] = api.coord([idx, value]);
  return {
    type: "line",
    shape: { x1: cx, y1: cy, x2: cx + sign * tickWidthPx, y2: cy },
    style: { stroke: t.ink, lineWidth, opacity },
  };
}

// Median tick is bold and full-width; the Q1/Q3 ticks are thinner and
// shorter so the eye still lands on the median first while the quartile
// spread is available as a secondary read (spec: "consider adding inner
// box plot or quartile markers").
function distributionTicks(idx, med, q, side, api) {
  return [
    quantileTick(idx, q.q1, side, api, { widthFactor: 0.2, lineWidth: 1.5, opacity: 0.55 }),
    quantileTick(idx, q.q3, side, api, { widthFactor: 0.2, lineWidth: 1.5, opacity: 0.55 }),
    quantileTick(idx, med, side, api, { widthFactor: 0.34, lineWidth: 2.5, opacity: 0.85 }),
  ];
}

function renderWeekdayHalf(params, api) {
  const idx = api.value(0);
  const polygon = {
    type: "polygon",
    shape: { points: halfShape(idx, kdeWeekday[idx].points, "left", api) },
    style: { fill: t.palette[0], opacity: 0.78, stroke: t.palette[0], lineWidth: 2 },
  };
  const ticks = distributionTicks(idx, medianWeekday[idx], quartilesWeekday[idx], "left", api);
  return { type: "group", children: [polygon, ...ticks] };
}

function renderWeekendHalf(params, api) {
  const idx = api.value(0);
  const polygon = {
    type: "polygon",
    shape: { points: halfShape(idx, kdeWeekend[idx].points, "right", api) },
    style: { fill: t.palette[1], opacity: 0.78, stroke: t.palette[1], lineWidth: 2 },
  };
  const ticks = distributionTicks(idx, medianWeekend[idx], quartilesWeekend[idx], "right", api);
  return { type: "group", children: [polygon, ...ticks] };
}

// --- Option -------------------------------------------------------------------
const title = "Sleep Duration: Weekday vs Weekend · violin-split · javascript · echarts · anyplot.ai";

chart.setOption({
  animation: false,
  backgroundColor: "transparent",
  title: {
    text: title,
    left: "center",
    top: 30,
    textStyle: { color: t.ink, fontSize: 17, fontWeight: 500 },
  },
  legend: {
    data: ["Weekday", "Weekend"],
    top: 78,
    left: "center",
    textStyle: { color: t.inkSoft, fontSize: 15 },
    icon: "roundRect",
    itemWidth: 18,
    itemHeight: 12,
    itemGap: 28,
    borderRadius: 4,
  },
  grid: { left: 110, right: 80, top: 150, bottom: 90 },
  xAxis: {
    type: "category",
    data: CATEGORIES,
    axisLabel: { color: t.inkSoft, fontSize: 15 },
    axisLine: { lineStyle: { color: t.inkSoft } },
    axisTick: { show: false },
    splitLine: { show: false },
  },
  yAxis: {
    type: "value",
    name: "Sleep Duration (hours)",
    nameLocation: "middle",
    nameGap: 60,
    nameTextStyle: { color: t.ink, fontSize: 16 },
    min: axisMin,
    max: axisMax,
    axisLabel: { color: t.inkSoft, fontSize: 15 },
    axisLine: { show: false },
    splitLine: { lineStyle: { color: t.grid } },
  },
  series: [
    {
      type: "custom",
      name: "Weekday",
      renderItem: renderWeekdayHalf,
      data: CATEGORIES.map((_, idx) => idx),
      encode: { x: 0 },
      itemStyle: { color: t.palette[0] },
      z: 2,
      silent: true,
    },
    {
      type: "custom",
      name: "Weekend",
      renderItem: renderWeekendHalf,
      data: CATEGORIES.map((_, idx) => idx),
      encode: { x: 0 },
      itemStyle: { color: t.palette[1] },
      z: 2,
      silent: true,
    },
  ],
});

chart.on("finished", () => {
  window.__anyplotReady = true;
});
Runnable source as JSON, for any HTTP client: https://api.anyplot.ai/specs/violin-split/echarts/code. Any spec id and library id listed in llms-full.txt fit the same URL shape; every URL below is complete and callable.
{
  "spec_id": "violin-split",
  "language": "javascript",
  "library": "echarts",
  "page": "https://anyplot.ai/violin-split/javascript/echarts",
  "hub": "https://anyplot.ai/violin-split",
  "code_json": "https://api.anyplot.ai/specs/violin-split/echarts/code",
  "spec_json": "https://api.anyplot.ai/specs/violin-split",
  "render_light_png": "https://storage.googleapis.com/anyplot-images/plots/violin-split/javascript/echarts/plot-light.png",
  "render_dark_png": "https://storage.googleapis.com/anyplot-images/plots/violin-split/javascript/echarts/plot-dark.png",
  "interactive_light_html": "https://storage.googleapis.com/anyplot-images/plots/violin-split/javascript/echarts/plot-light.html",
  "interactive_dark_html": "https://storage.googleapis.com/anyplot-images/plots/violin-split/javascript/echarts/plot-dark.html",
  "quality_score": 90.0,
  "license": "MIT",
  "guide": "https://anyplot.ai/llms.txt"
}
Part of Split Violin Plot on anyplot.ai.