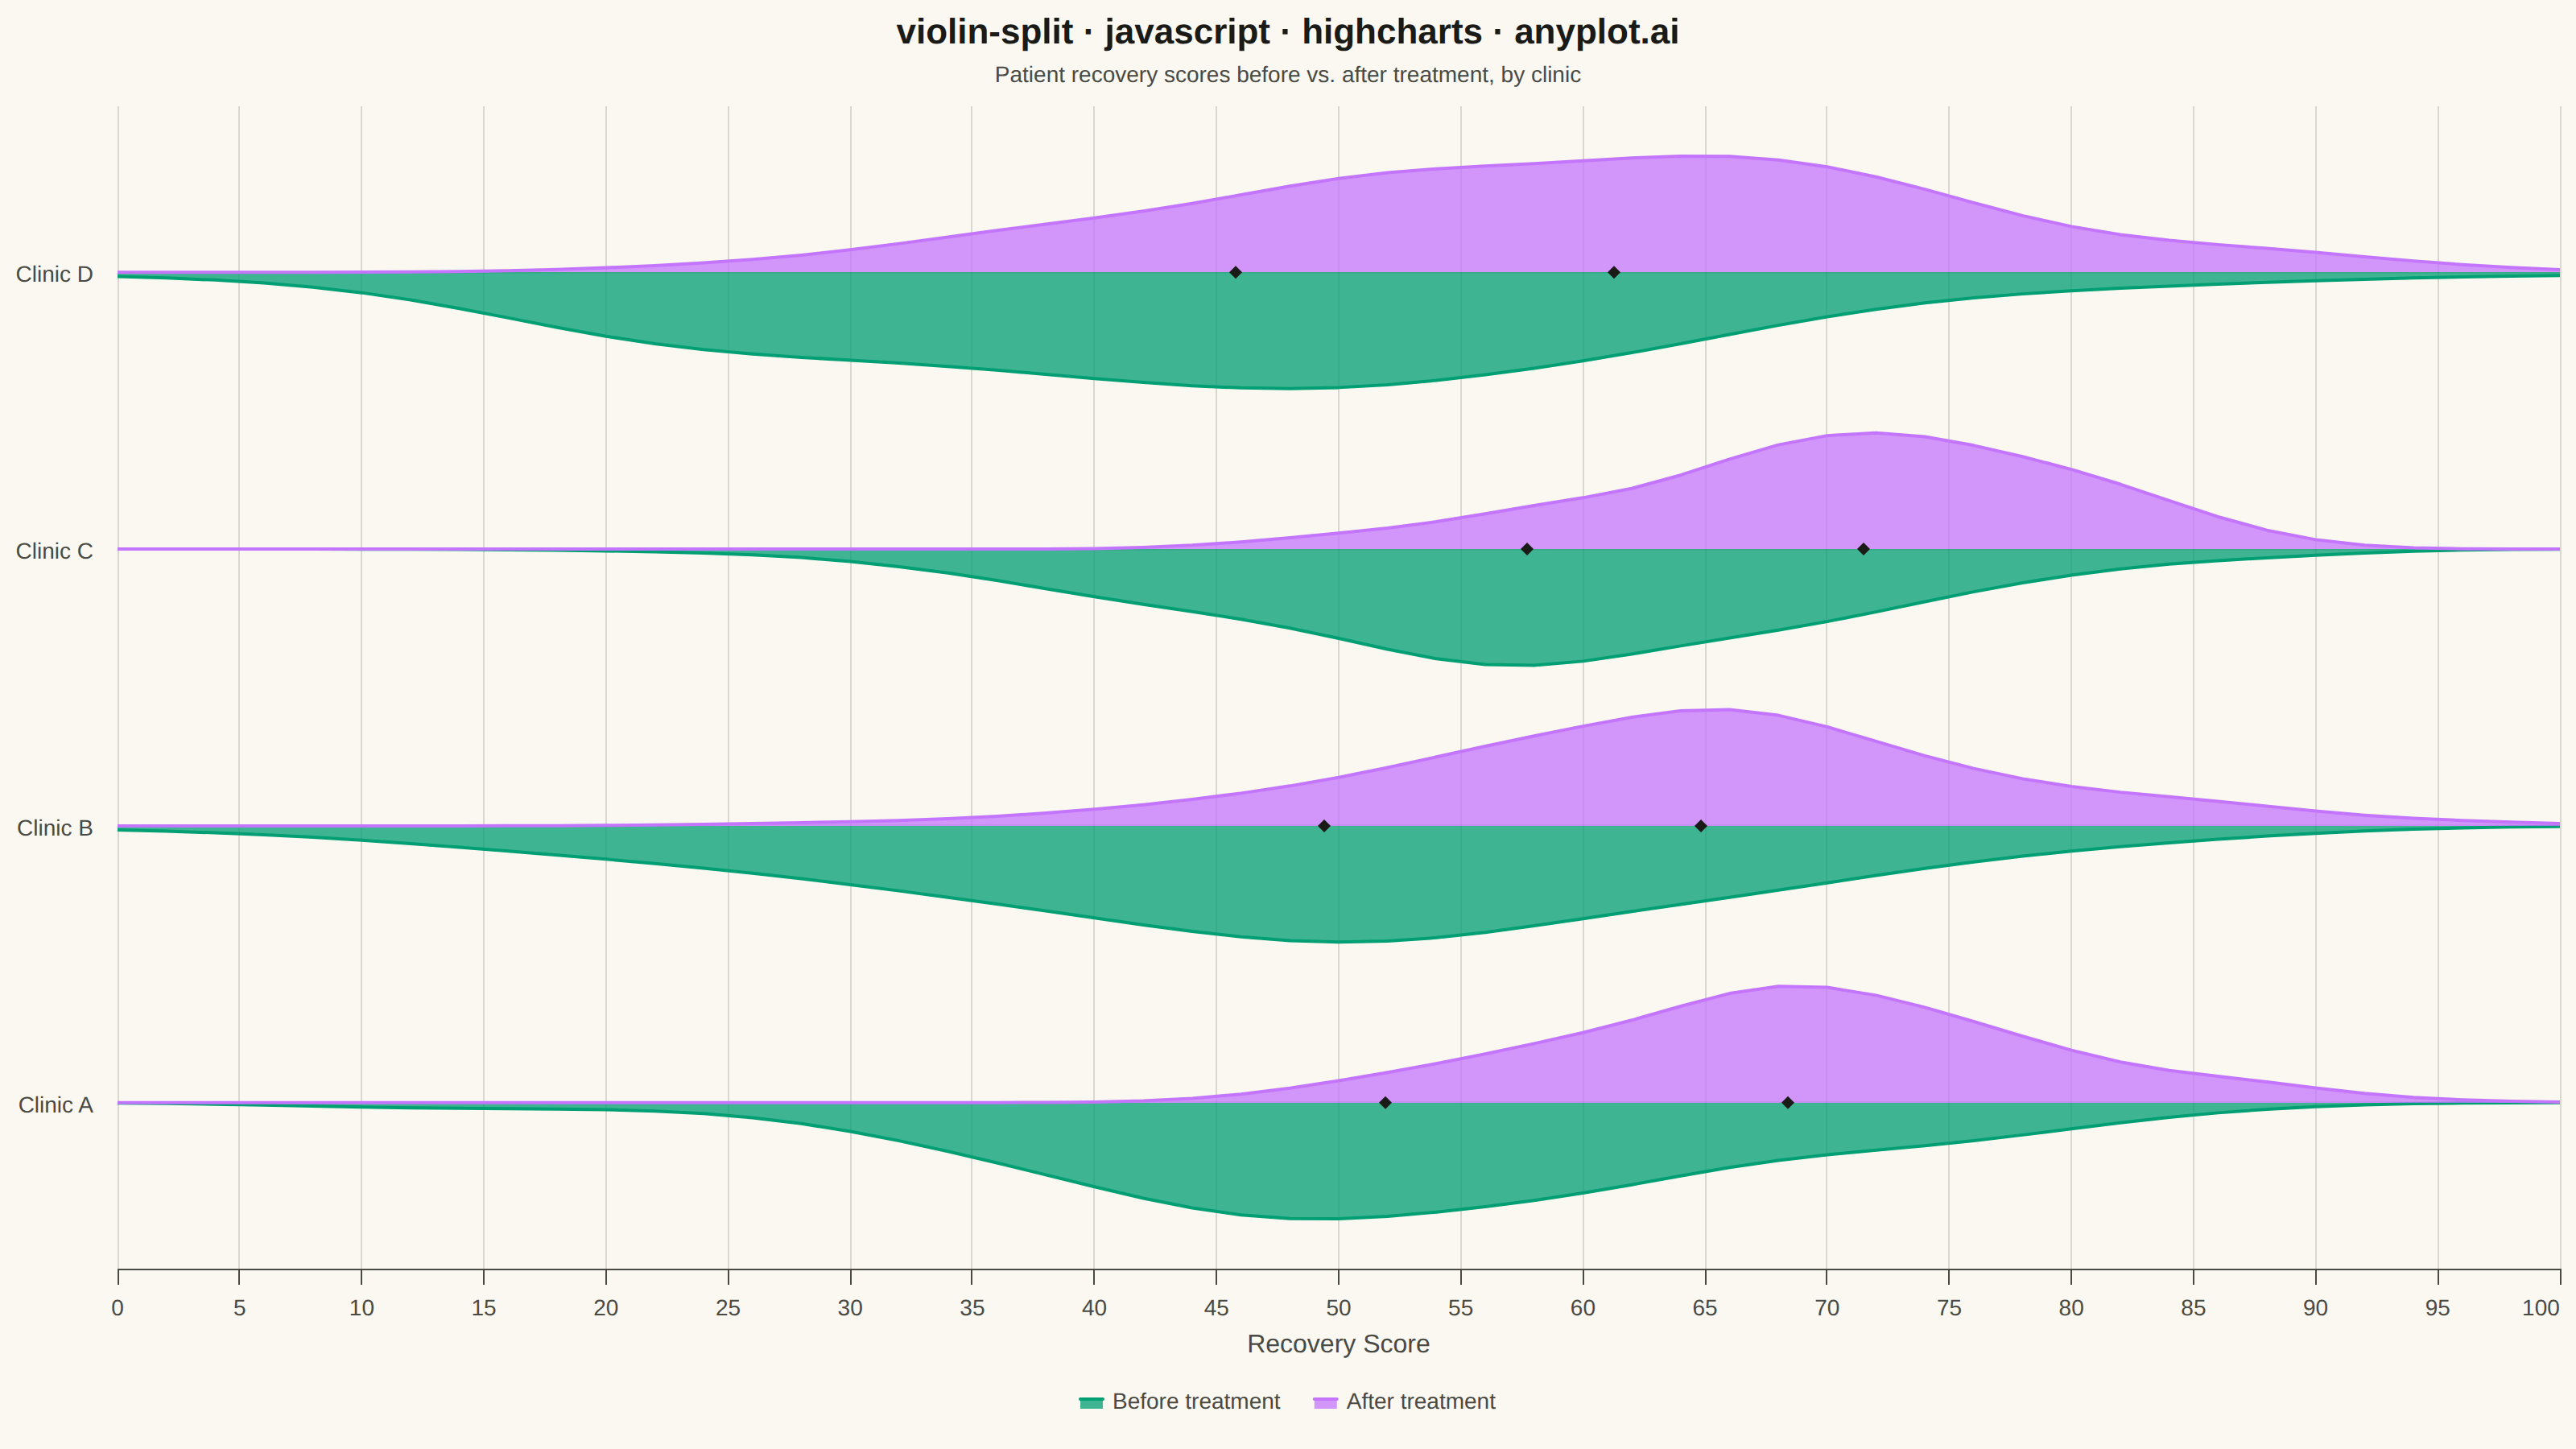
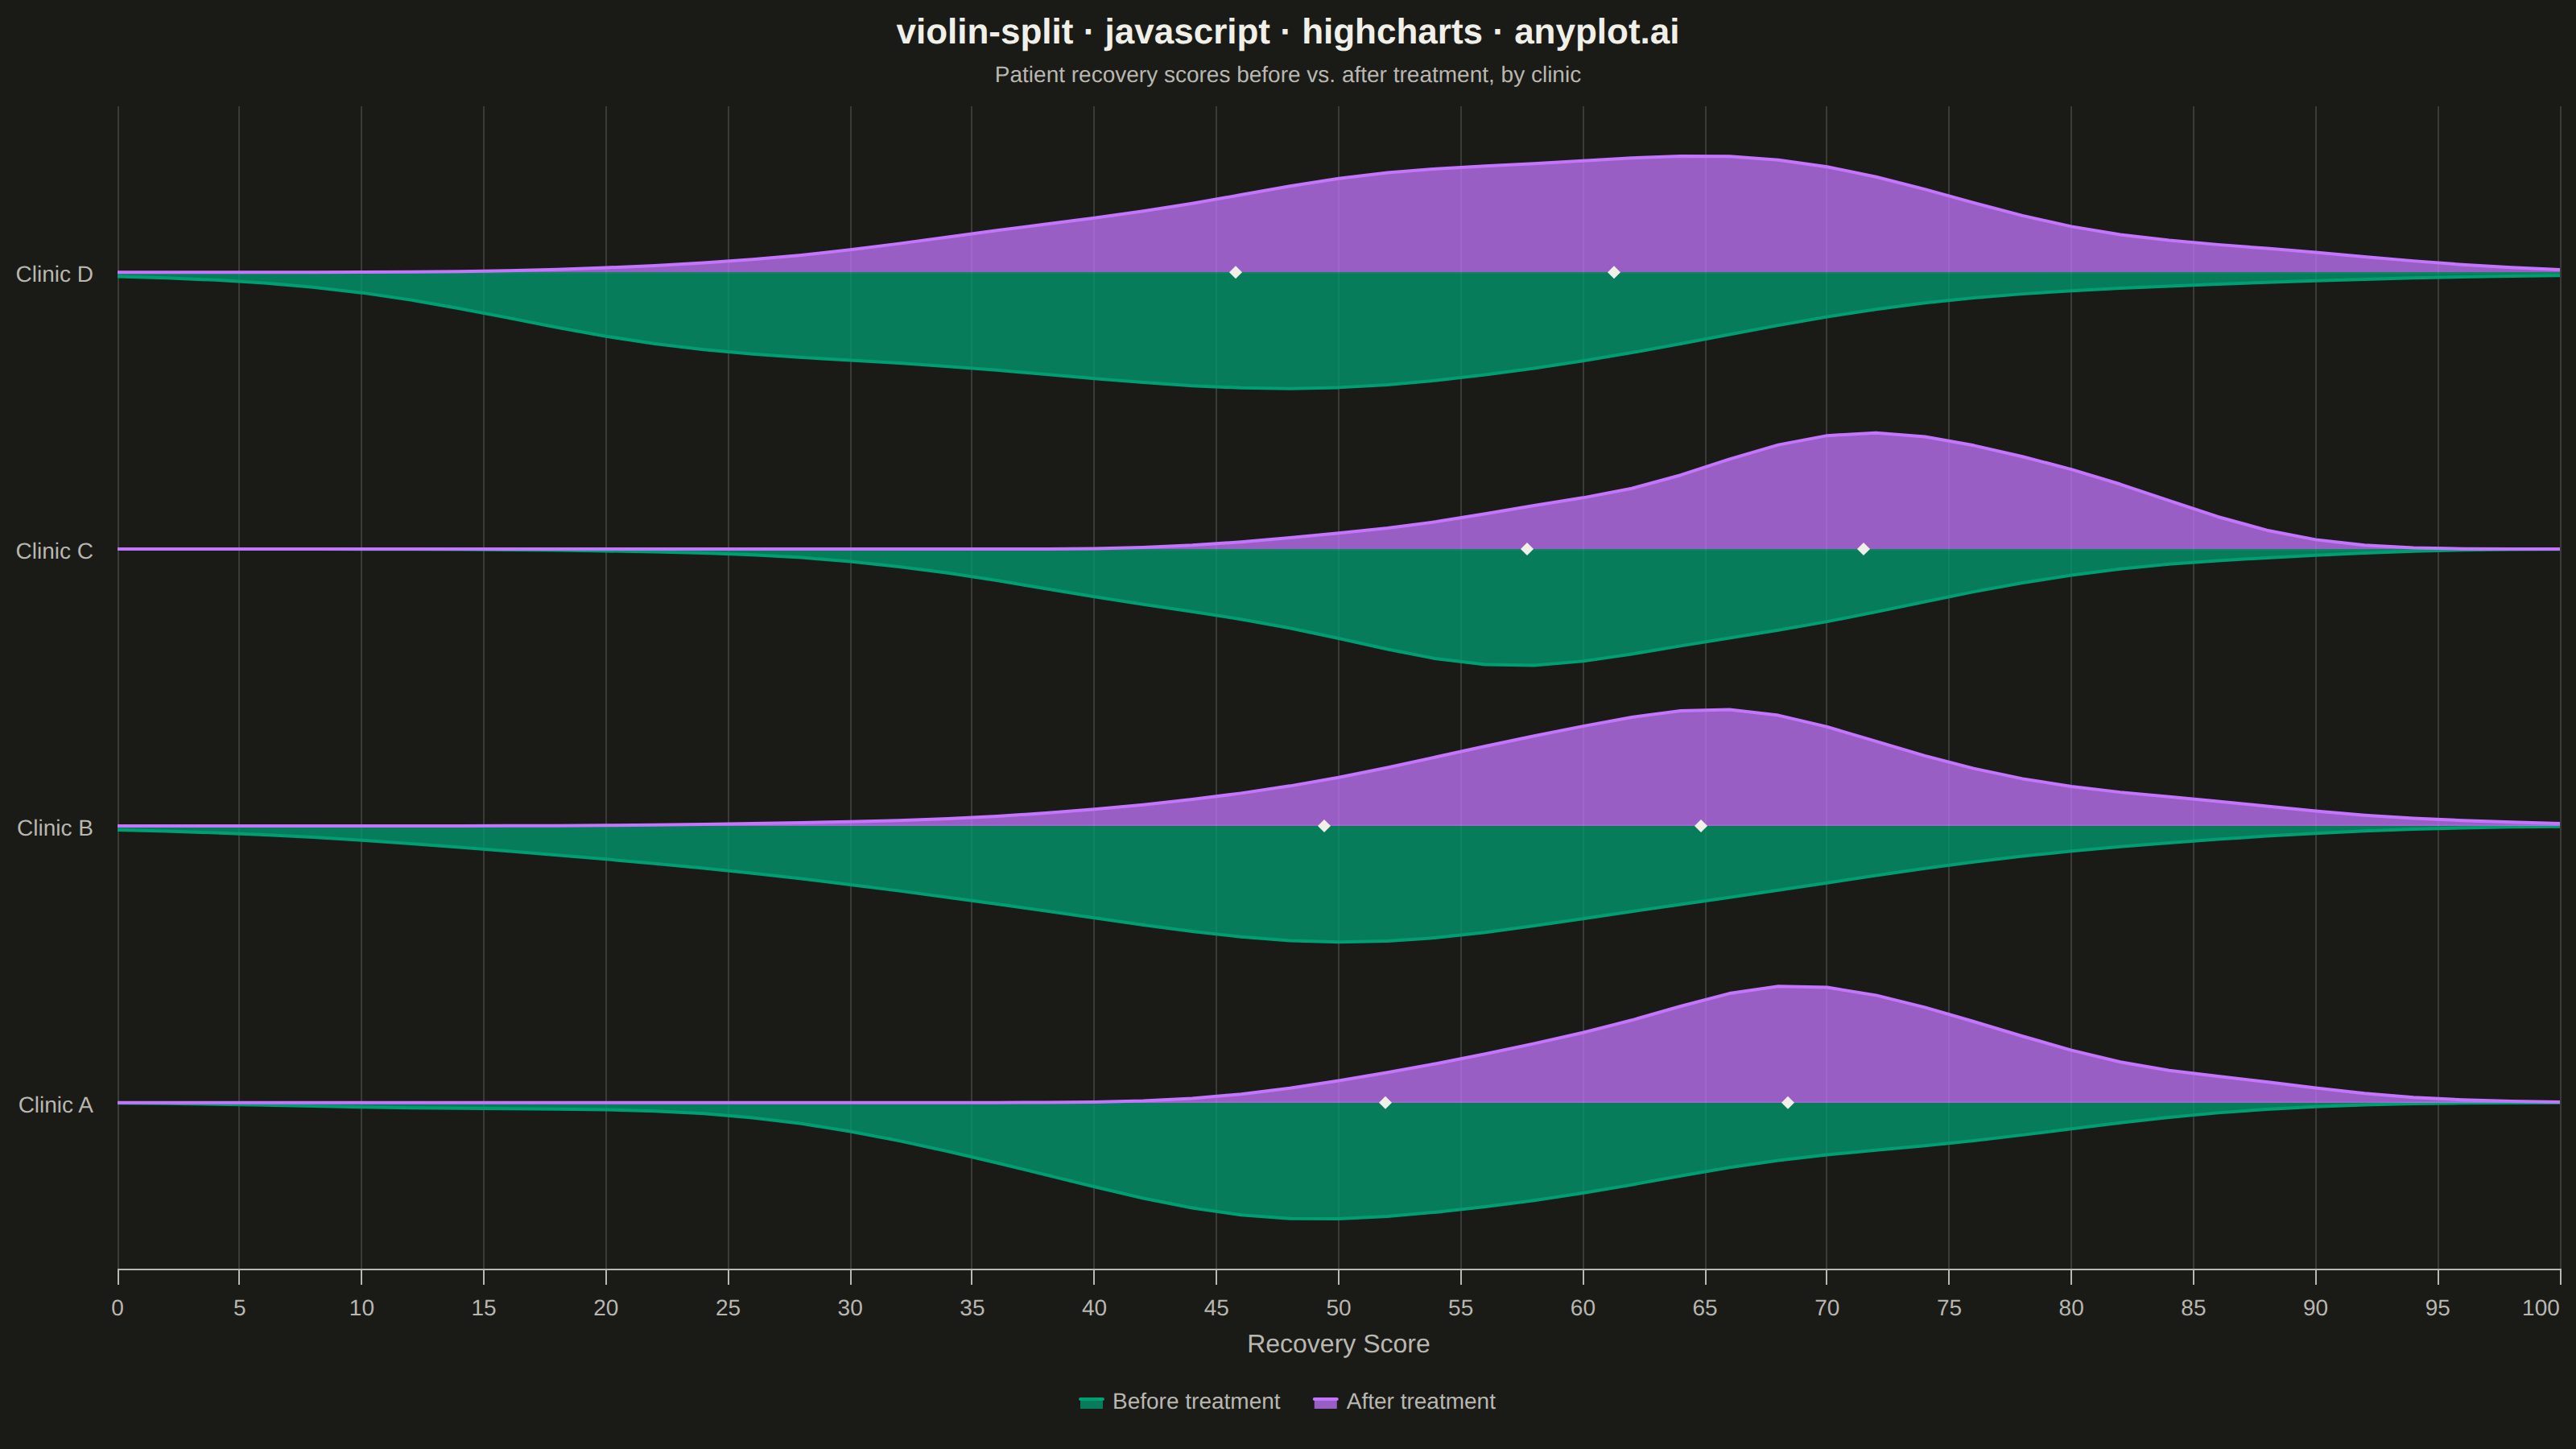
The same plot in 14 other libraries — JavaScript: Chart.js, D3.js, Apache ECharts, MUI X Charts; Python: Altair, Bokeh, lets-plot, Matplotlib, Plotly, plotnine, Pygal, Seaborn; R: ggplot2; Julia: Makie.jl. Compare all 15 side by side: Split Violin Plot in Python, R, Julia and JavaScript.
A split violin plot displaying two distributions side-by-side within each violin, with each half representing a different group. Unlike standard violin plots that mirror the same distribution, split violins use the left and right halves to compare two conditions (such as before/after, male/female, or control/treatment) at each category level. This enables direct visual comparison of distribution shapes between paired groups.
// anyplot.ai
// violin-split: Split Violin Plot
// Library: highcharts 12.6.0 | JavaScript 22.23.2
// Quality: 87/100 | Created: 2026-09-09

// Only the core Highcharts bundle is loaded (no highcharts-more), so there is
// no native arearange/violin series. Instead each half-violin is a plain
// "area" series: x = recovery score, y = category index +/- normalized KDE
// density, filled to a per-series threshold at the category's baseline. That
// reads as a horizontal split violin (score on the shared x-axis, one row per
// clinic) rather than the classic vertical orientation — a valid orientation
// variant that stays inside the core bundle.

//# anyplot-orientation: landscape
const t = window.ANYPLOT_TOKENS;

// --- Deterministic RNG (LCG) + Box-Muller normal samples -------------------
let seed = 42;
function rand() {
  seed = (seed * 1103515245 + 12345) & 0x7fffffff;
  return seed / 0x7fffffff;
}
function normal(mean, std) {
  const u1 = Math.max(rand(), 1e-9);
  const u2 = rand();
  return mean + std * Math.sqrt(-2 * Math.log(u1)) * Math.cos(2 * Math.PI * u2);
}
function clamp01to100(v) {
  return Math.min(100, Math.max(0, v));
}
function std(arr) {
  const m = arr.reduce((a, b) => a + b, 0) / arr.length;
  const v = arr.reduce((a, b) => a + (b - m) * (b - m), 0) / arr.length;
  return Math.sqrt(v);
}
function median(arr) {
  const s = [...arr].sort((a, b) => a - b);
  const mid = Math.floor(s.length / 2);
  return s.length % 2 ? s[mid] : (s[mid - 1] + s[mid]) / 2;
}
function kde(samples, grid, bandwidth) {
  return grid.map((x) => {
    let sum = 0;
    for (const v of samples) {
      const u = (x - v) / bandwidth;
      sum += Math.exp(-0.5 * u * u);
    }
    return sum / (samples.length * bandwidth * Math.sqrt(2 * Math.PI));
  });
}

// --- Data: patient recovery scores before/after treatment, per clinic ------
const clinics = [
  { name: "Clinic A", before: { mean: 52, std: 14 }, after: { mean: 68, std: 10 } },
  { name: "Clinic B", before: { mean: 48, std: 16 }, after: { mean: 64, std: 12 } },
  { name: "Clinic C", before: { mean: 58, std: 12 }, after: { mean: 70, std: 9 } },
  { name: "Clinic D", before: { mean: 45, std: 18 }, after: { mean: 60, std: 14 } },
];
const SAMPLES_PER_GROUP = 180;
const HALF_WIDTH = 0.42;
const grid = [];
for (let x = 0; x <= 100; x += 2) grid.push(x);

const areaSeries = [];
const beforeMedians = [];
const afterMedians = [];

clinics.forEach((clinic, i) => {
  const beforeSamples = Array.from({ length: SAMPLES_PER_GROUP }, () =>
    clamp01to100(normal(clinic.before.mean, clinic.before.std)),
  );
  const afterSamples = Array.from({ length: SAMPLES_PER_GROUP }, () =>
    clamp01to100(normal(clinic.after.mean, clinic.after.std)),
  );

  const beforeBw = 1.06 * std(beforeSamples) * Math.pow(beforeSamples.length, -0.2);
  const afterBw = 1.06 * std(afterSamples) * Math.pow(afterSamples.length, -0.2);
  const beforeDensity = kde(beforeSamples, grid, beforeBw);
  const afterDensity = kde(afterSamples, grid, afterBw);
  const beforeMax = Math.max(...beforeDensity);
  const afterMax = Math.max(...afterDensity);

  areaSeries.push({
    name: "Before treatment",
    type: "area",
    color: t.palette[0],
    threshold: i,
    showInLegend: i === 0,
    data: grid.map((x, idx) => ({ x, y: i - (beforeDensity[idx] / beforeMax) * HALF_WIDTH })),
    tooltip: { pointFormatter: function () { return `Before · score ${this.x}`; } },
  });
  areaSeries.push({
    name: "After treatment",
    type: "area",
    color: t.palette[1],
    threshold: i,
    showInLegend: i === 0,
    data: grid.map((x, idx) => ({ x, y: i + (afterDensity[idx] / afterMax) * HALF_WIDTH })),
    tooltip: { pointFormatter: function () { return `After · score ${this.x}`; } },
  });

  beforeMedians.push({ x: median(beforeSamples), y: i });
  afterMedians.push({ x: median(afterSamples), y: i });
});

// --- Chart -------------------------------------------------------------
Highcharts.chart("container", {
  chart: {
    type: "area",
    backgroundColor: "transparent",
    animation: false,
    style: { fontFamily: "inherit" },
  },
  credits: { enabled: false },
  title: {
    text: "violin-split · javascript · highcharts · anyplot.ai",
    style: { color: t.ink, fontSize: "22px", fontWeight: "600" },
  },
  subtitle: {
    text: "Patient recovery scores before vs. after treatment, by clinic",
    style: { color: t.inkSoft, fontSize: "14px" },
  },
  xAxis: {
    min: 0,
    max: 100,
    title: { text: "Recovery Score", style: { color: t.inkSoft, fontSize: "16px" } },
    gridLineColor: t.grid,
    gridLineWidth: 1,
    lineColor: t.inkSoft,
    tickColor: t.inkSoft,
    labels: { style: { color: t.inkSoft, fontSize: "14px" } },
  },
  yAxis: {
    min: -0.6,
    max: clinics.length - 1 + 0.6,
    startOnTick: false,
    endOnTick: false,
    tickPositions: clinics.map((_, i) => i),
    gridLineWidth: 0,
    lineColor: t.inkSoft,
    tickColor: t.inkSoft,
    title: { text: null },
    labels: {
      style: { color: t.inkSoft, fontSize: "14px" },
      formatter: function () {
        return clinics[this.value] ? clinics[this.value].name : "";
      },
    },
    plotLines: clinics.map((_, i) => ({ value: i, color: t.grid, width: 1, zIndex: 2 })),
  },
  legend: {
    itemStyle: { color: t.inkSoft, fontSize: "14px" },
    itemHoverStyle: { color: t.ink },
  },
  plotOptions: {
    series: { animation: false },
    area: {
      lineWidth: 2,
      fillOpacity: 0.75,
      marker: { enabled: false },
      states: { hover: { enabled: false } },
    },
  },
  series: [
    ...areaSeries,
    {
      name: "Median (before)",
      type: "scatter",
      color: t.ink,
      data: beforeMedians,
      marker: { symbol: "diamond", radius: 4, lineWidth: 0 },
      showInLegend: false,
      tooltip: { pointFormatter: function () { return `Median before: ${this.x}`; } },
    },
    {
      name: "Median (after)",
      type: "scatter",
      color: t.ink,
      data: afterMedians,
      marker: { symbol: "diamond", radius: 4, lineWidth: 0 },
      showInLegend: false,
      tooltip: { pointFormatter: function () { return `Median after: ${this.x}`; } },
    },
  ],
});
Runnable source as JSON, for any HTTP client: https://api.anyplot.ai/specs/violin-split/highcharts/code. Any spec id and library id listed in llms-full.txt fit the same URL shape; every URL below is complete and callable.
{
  "spec_id": "violin-split",
  "language": "javascript",
  "library": "highcharts",
  "page": "https://anyplot.ai/violin-split/javascript/highcharts",
  "hub": "https://anyplot.ai/violin-split",
  "code_json": "https://api.anyplot.ai/specs/violin-split/highcharts/code",
  "spec_json": "https://api.anyplot.ai/specs/violin-split",
  "render_light_png": "https://storage.googleapis.com/anyplot-images/plots/violin-split/javascript/highcharts/plot-light.png",
  "render_dark_png": "https://storage.googleapis.com/anyplot-images/plots/violin-split/javascript/highcharts/plot-dark.png",
  "interactive_light_html": "https://storage.googleapis.com/anyplot-images/plots/violin-split/javascript/highcharts/plot-light.html",
  "interactive_dark_html": "https://storage.googleapis.com/anyplot-images/plots/violin-split/javascript/highcharts/plot-dark.html",
  "quality_score": 87.0,
  "license": "MIT",
  "guide": "https://anyplot.ai/llms.txt"
}
Part of Split Violin Plot on anyplot.ai.