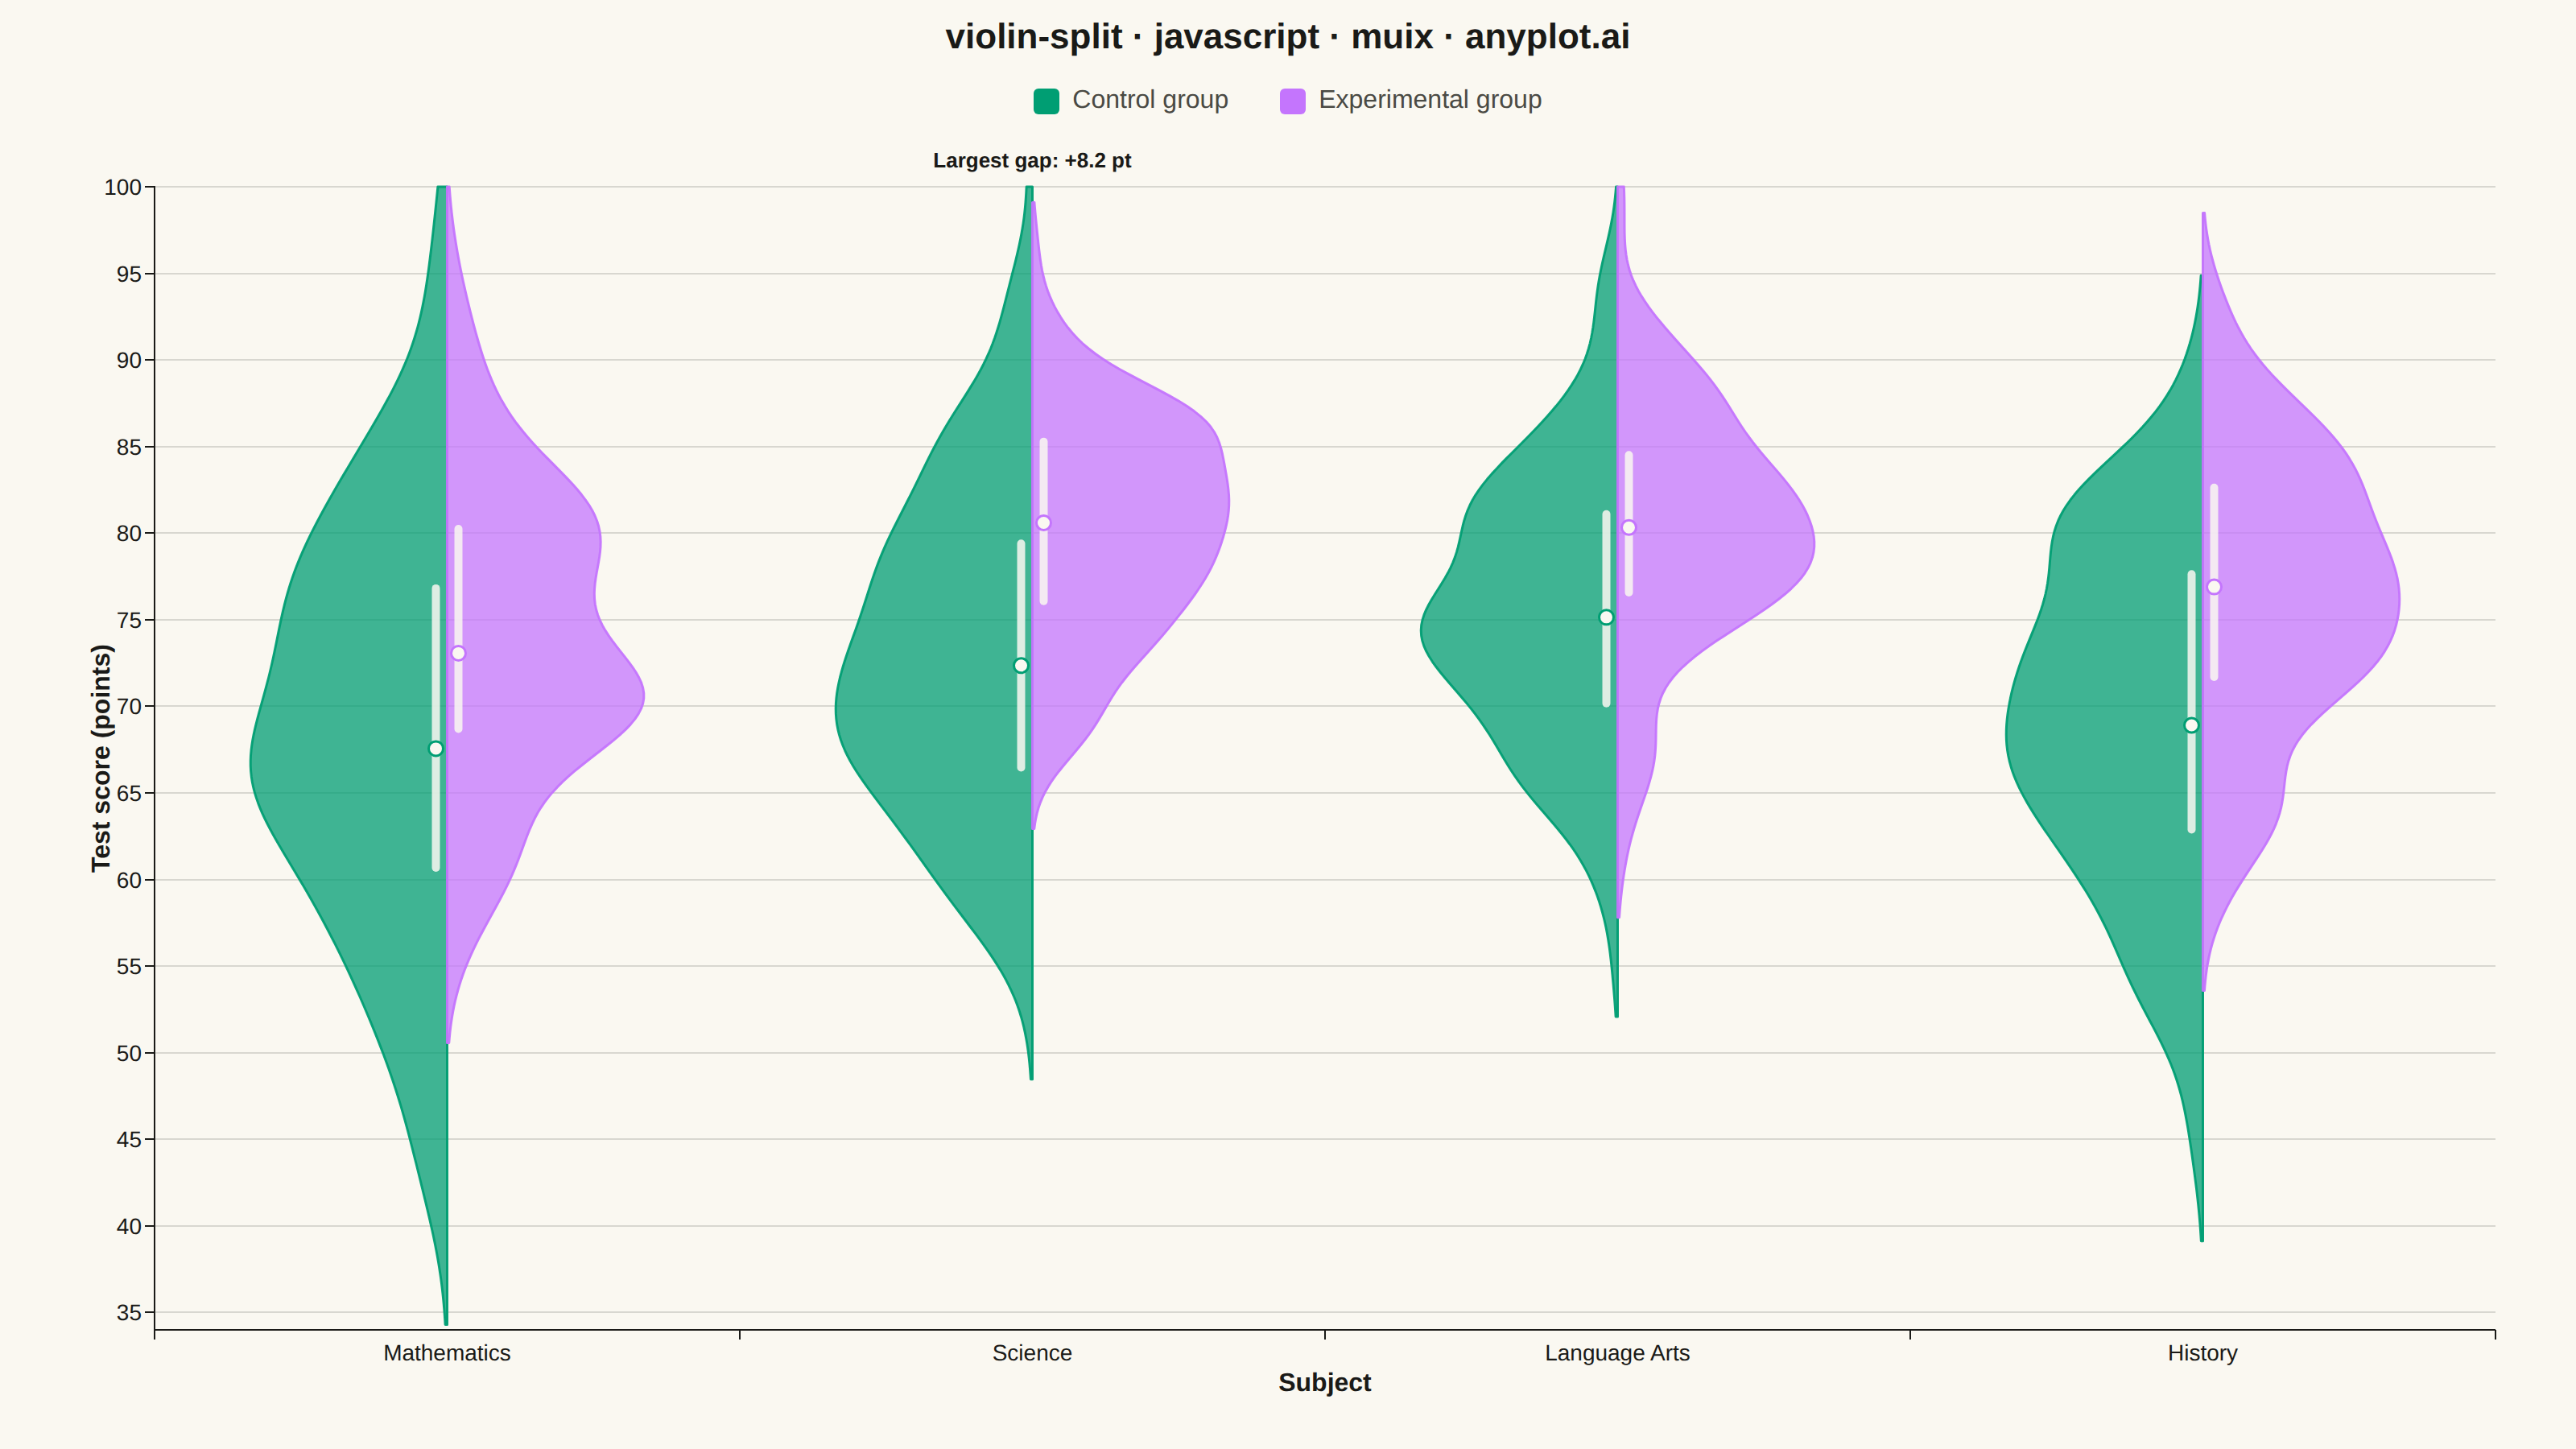
The same plot in 14 other libraries — JavaScript: Chart.js, D3.js, Apache ECharts, Highcharts; Python: Altair, Bokeh, lets-plot, Matplotlib, Plotly, plotnine, Pygal, Seaborn; R: ggplot2; Julia: Makie.jl. Compare all 15 side by side: Split Violin Plot in Python, R, Julia and JavaScript.
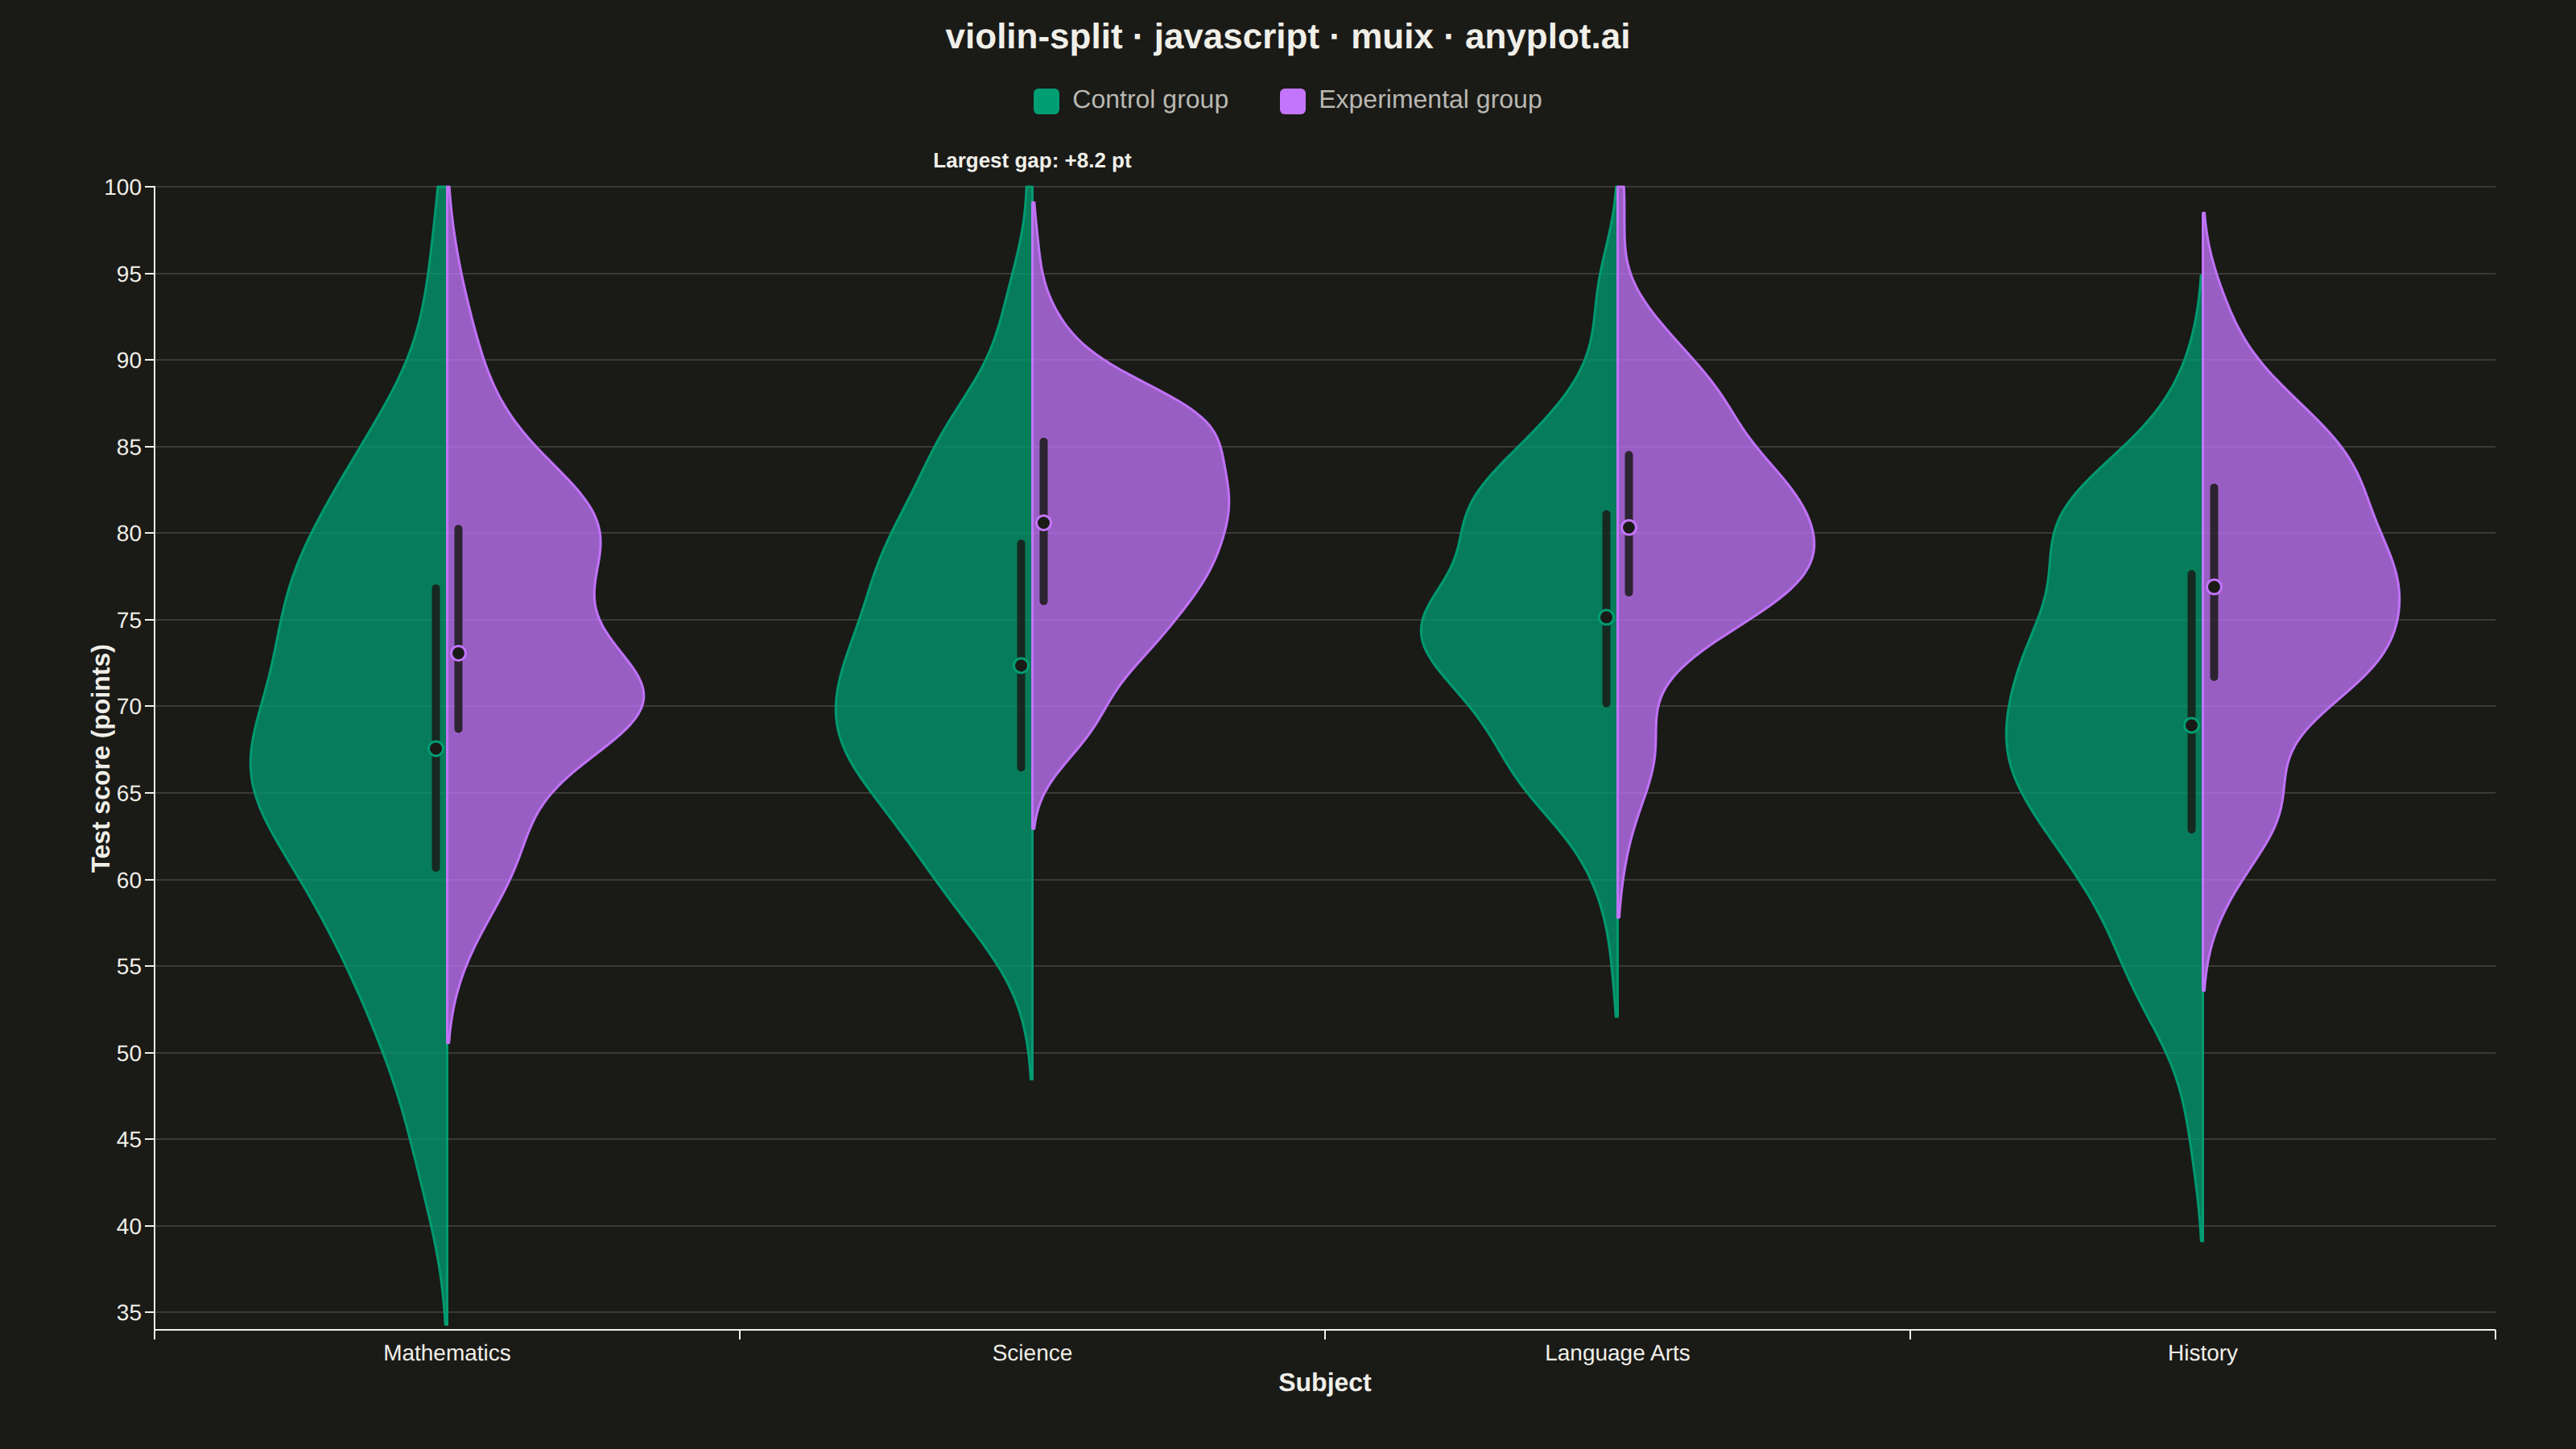
A split violin plot displaying two distributions side-by-side within each violin, with each half representing a different group. Unlike standard violin plots that mirror the same distribution, split violins use the left and right halves to compare two conditions (such as before/after, male/female, or control/treatment) at each category level. This enables direct visual comparison of distribution shapes between paired groups.
// anyplot.ai
// violin-split: Split Violin Plot
// Library: muix 7.29.1 | JavaScript 22.23.2
// Quality: 93/100 | Created: 2026-09-09
import { Box, Typography } from "@mui/material";
import { ChartContainer } from "@mui/x-charts/ChartContainer";
import { ChartsGrid } from "@mui/x-charts/ChartsGrid";
import { ChartsXAxis } from "@mui/x-charts/ChartsXAxis";
import { ChartsYAxis } from "@mui/x-charts/ChartsYAxis";
import { useXScale, useYScale } from "@mui/x-charts/hooks";

const t = window.ANYPLOT_TOKENS;

const CAT_AXIS_ID = "category-axis";
const VAL_AXIS_ID = "value-axis";

// --- Data (in-memory, deterministic — tiny fixed-seed LCG) ------------------
function makeLcg(seed: number) {
  let state = seed >>> 0;
  return function next() {
    state = (Math.imul(1664525, state) + 1013904223) >>> 0;
    return state / 4294967296;
  };
}
const rng = makeLcg(20260909);

function gaussian(mean: number, std: number) {
  let u1 = rng();
  while (u1 <= 1e-12) u1 = rng();
  const u2 = rng();
  const z = Math.sqrt(-2 * Math.log(u1)) * Math.cos(2 * Math.PI * u2);
  return mean + z * std;
}

function clamp(v: number, lo: number, hi: number) {
  return Math.min(hi, Math.max(lo, v));
}

const N_PER_GROUP = 140;
const SPLIT_GROUPS = ["Control group", "Experimental group"];

const CATEGORY_PARAMS = [
  {
    name: "Mathematics",
    control: { mean: 68, std: 11 },
    experimental: { mean: 74, std: 9 },
  },
  {
    name: "Science",
    control: { mean: 74, std: 9 },
    experimental: { mean: 80, std: 7 },
  },
  {
    name: "Language Arts",
    control: { mean: 76, std: 8 },
    experimental: { mean: 81, std: 7 },
  },
  {
    name: "History",
    control: { mean: 70, std: 10 },
    experimental: { mean: 76, std: 8 },
  },
];
const CATEGORIES = CATEGORY_PARAMS.map((c) => c.name);

const DATA: Record<string, Record<string, number[]>> = {};
CATEGORY_PARAMS.forEach(({ name, control, experimental }) => {
  DATA[name] = {
    // Only the physical floor (0) is clamped — a hard clamp at 100 would pile
    // up upper-tail samples on the boundary and flatten the violin's tip.
    "Control group": Array.from({ length: N_PER_GROUP }, () =>
      clamp(gaussian(control.mean, control.std), 0, Infinity),
    ),
    "Experimental group": Array.from({ length: N_PER_GROUP }, () =>
      clamp(gaussian(experimental.mean, experimental.std), 0, Infinity),
    ),
  };
});

const ALL_VALUES = CATEGORIES.flatMap((cat) =>
  SPLIT_GROUPS.flatMap((grp) => DATA[cat][grp]),
);
const RAW_MIN = Math.min(...ALL_VALUES);
const RAW_MAX = Math.max(...ALL_VALUES);
const PAD = (RAW_MAX - RAW_MIN) * 0.1;
const Y_MIN = Math.max(0, Math.floor(RAW_MIN - PAD));
// Test scores don't exceed 100 — cap the axis window there. The underlying
// data stays unclamped (see above) so the KDE tail decays smoothly into this
// boundary instead of piling up on it.
const Y_MAX = Math.min(100, Math.ceil(RAW_MAX + PAD));

const GRID_N = 220;
const GRID_Y = Array.from(
  { length: GRID_N },
  (_, i) => Y_MIN + ((Y_MAX - Y_MIN) * i) / (GRID_N - 1),
);

const GROUP_COLORS = [t.palette[0], t.palette[1]];

// --- KDE (Gaussian kernel, Silverman bandwidth) — draws the violin curves ---
function silvermanBandwidth(values: number[]) {
  const n = values.length;
  const mean = values.reduce((s, v) => s + v, 0) / n;
  const variance = values.reduce((s, v) => s + (v - mean) ** 2, 0) / (n - 1);
  const sigma = Math.sqrt(variance) || 1;
  return Math.max(0.9 * sigma * Math.pow(n, -0.2), 0.6);
}

function kdeCurve(values: number[], gridY: number[]) {
  const h = silvermanBandwidth(values);
  const n = values.length;
  const norm = 1 / (n * h * Math.sqrt(2 * Math.PI));
  return gridY.map((y) => {
    let sum = 0;
    for (let i = 0; i < n; i++) {
      const u = (y - values[i]) / h;
      sum += Math.exp(-0.5 * u * u);
    }
    return sum * norm;
  });
}

// Trims the near-zero density tails so each half pinches to the center spine
// instead of drawing a near-invisible sliver across the whole y-range.
function trimToSupport(density: number[], thresholdRatio: number) {
  const max = Math.max(...density);
  const threshold = max * thresholdRatio;
  let lo = 0;
  let hi = density.length - 1;
  while (lo < hi && density[lo] < threshold) lo++;
  while (hi > lo && density[hi] < threshold) hi--;
  lo = Math.max(0, lo - 1);
  hi = Math.min(density.length - 1, hi + 1);
  return { lo, hi, max };
}

function quartileStats(values: number[]) {
  const sorted = [...values].sort((a, b) => a - b);
  const quantile = (p: number) => {
    const pos = (sorted.length - 1) * p;
    const base = Math.floor(pos);
    const rest = pos - base;
    return sorted[base + 1] !== undefined
      ? sorted[base] + rest * (sorted[base + 1] - sorted[base])
      : sorted[base];
  };
  return { q1: quantile(0.25), median: quantile(0.5), q3: quantile(0.75) };
}

// Largest control-vs-experimental median gap across categories — drives the
// callout annotation that anchors the data-storytelling focal point.
const GAP_INFO = CATEGORIES.map((cat) => {
  const controlMedian = quartileStats(DATA[cat]["Control group"]).median;
  const experimentalMedian = quartileStats(
    DATA[cat]["Experimental group"],
  ).median;
  return {
    category: cat,
    gap: experimentalMedian - controlMedian,
  };
}).reduce((best, cur) => (Math.abs(cur.gap) > Math.abs(best.gap) ? cur : best));

// --- Custom-drawn split violins (community @mui/x-charts has no built-in
// violin mark — composed from ChartContainer's cartesian scales instead) ----
function Violins() {
  const xScale = useXScale(CAT_AXIS_ID);
  const yScale = useYScale(VAL_AXIS_ID);

  return (
    <>
      {CATEGORIES.map((cat) => {
        const bandStart = xScale(cat);
        if (bandStart === undefined) return null;
        const bandwidth = xScale.bandwidth();
        const cx = bandStart + bandwidth / 2;
        const halfWidthMax = bandwidth * 0.42;

        const halves = SPLIT_GROUPS.map((grp, gi) => {
          const values = DATA[cat][grp];
          const density = kdeCurve(values, GRID_Y);
          const { lo, hi, max } = trimToSupport(density, 0.01);
          const side = gi === 0 ? -1 : 1;
          const color = GROUP_COLORS[gi];

          const points: [number, number][] = [];
          for (let i = lo; i <= hi; i++) {
            const w = (density[i] / max) * halfWidthMax;
            points.push([cx + side * w, yScale(GRID_Y[i]) as number]);
          }
          const d =
            `M ${cx} ${points[0][1]} ` +
            points.map(([x, y]) => `L ${x} ${y}`).join(" ") +
            ` L ${cx} ${points[points.length - 1][1]} Z`;

          const { q1, median, q3 } = quartileStats(values);
          const markerX = cx + side * 7;
          // GRID_Y is ascending, so index `hi` is the higher score (top of
          // chart, smaller pixel y) and `lo` is the lower score (bottom).
          const yTop = yScale(GRID_Y[hi]) as number;
          const yBottom = yScale(GRID_Y[lo]) as number;

          return { grp, d, color, q1, median, q3, markerX, yTop, yBottom };
        });

        // Thin spine anchoring the two halves where they meet, spanning the
        // combined vertical extent of both violins for this category.
        const spineTop = Math.min(...halves.flatMap((h) => [h.yTop, h.yBottom]));
        const spineBottom = Math.max(
          ...halves.flatMap((h) => [h.yTop, h.yBottom]),
        );

        const isMaxGap = cat === GAP_INFO.category;

        return (
          <g key={cat}>
            <line
              x1={cx}
              x2={cx}
              y1={spineTop}
              y2={spineBottom}
              stroke={t.inkSoft}
              strokeWidth={1}
              opacity={0.4}
            />
            {halves.map(({ grp, d, color, q1, median, q3, markerX }) => (
              <g key={grp}>
                <path
                  d={d}
                  fill={color}
                  fillOpacity={0.75}
                  stroke={color}
                  strokeWidth={1.5}
                  strokeOpacity={0.95}
                  strokeLinejoin="round"
                />
                <line
                  x1={markerX}
                  x2={markerX}
                  y1={yScale(q1)}
                  y2={yScale(q3)}
                  stroke={t.pageBg}
                  strokeWidth={5}
                  strokeLinecap="round"
                  opacity={0.85}
                />
                <circle
                  cx={markerX}
                  cy={yScale(median)}
                  r={4.5}
                  fill={t.pageBg}
                  stroke={color}
                  strokeWidth={1.5}
                />
              </g>
            ))}
            {isMaxGap && (
              <text
                x={cx}
                y={spineTop - 12}
                textAnchor="middle"
                fontSize={13}
                fontWeight={700}
                fill={t.ink}
              >
                {`Largest gap: ${GAP_INFO.gap >= 0 ? "+" : ""}${GAP_INFO.gap.toFixed(1)} pt`}
              </text>
            )}
          </g>
        );
      })}
    </>
  );
}

// --- Chart (default-exported component — the harness mounts it) -----------
export default function Chart() {
  const W = window.ANYPLOT_SIZE.width;
  const H = window.ANYPLOT_SIZE.height;
  const TITLE_H = 46;
  const LEGEND_H = 34;
  const CHART_H = H - TITLE_H - LEGEND_H;

  return (
    <Box sx={{ width: W, height: H, display: "flex", flexDirection: "column" }}>
      <Typography
        sx={{
          height: TITLE_H,
          lineHeight: `${TITLE_H}px`,
          fontSize: 22,
          fontWeight: 700,
          textAlign: "center",
        }}
      >
        violin-split · javascript · muix · anyplot.ai
      </Typography>
      <Box
        sx={{
          height: LEGEND_H,
          display: "flex",
          justifyContent: "center",
          alignItems: "center",
          gap: 4,
        }}
      >
        {SPLIT_GROUPS.map((grp, i) => (
          <Box key={grp} sx={{ display: "flex", alignItems: "center", gap: 1 }}>
            <Box
              sx={{
                width: 16,
                height: 16,
                borderRadius: "3px",
                backgroundColor: GROUP_COLORS[i],
              }}
            />
            <Typography sx={{ fontSize: 16, color: "text.secondary" }}>
              {grp}
            </Typography>
          </Box>
        ))}
      </Box>
      <ChartContainer
        width={W}
        height={CHART_H}
        series={[]}
        skipAnimation
        margin={{ top: 36, right: 50, bottom: 74, left: 96 }}
        xAxis={[
          {
            id: CAT_AXIS_ID,
            scaleType: "band",
            data: CATEGORIES,
            label: "Subject",
            tickLabelStyle: { fontSize: 14 },
            labelStyle: { fontSize: 16, fontWeight: 600 },
          },
        ]}
        yAxis={[
          {
            id: VAL_AXIS_ID,
            scaleType: "linear",
            min: Y_MIN,
            max: Y_MAX,
            label: "Test score (points)",
            tickLabelStyle: { fontSize: 14 },
            labelStyle: { fontSize: 16, fontWeight: 600 },
          },
        ]}
      >
        <ChartsGrid horizontal />
        <Violins />
        <ChartsXAxis axisId={CAT_AXIS_ID} position="bottom" />
        <ChartsYAxis axisId={VAL_AXIS_ID} position="left" />
      </ChartContainer>
    </Box>
  );
}
Runnable source as JSON, for any HTTP client: https://api.anyplot.ai/specs/violin-split/muix/code. Any spec id and library id listed in llms-full.txt fit the same URL shape; every URL below is complete and callable.
{
  "spec_id": "violin-split",
  "language": "javascript",
  "library": "muix",
  "page": "https://anyplot.ai/violin-split/javascript/muix",
  "hub": "https://anyplot.ai/violin-split",
  "code_json": "https://api.anyplot.ai/specs/violin-split/muix/code",
  "spec_json": "https://api.anyplot.ai/specs/violin-split",
  "render_light_png": "https://storage.googleapis.com/anyplot-images/plots/violin-split/javascript/muix/plot-light.png",
  "render_dark_png": "https://storage.googleapis.com/anyplot-images/plots/violin-split/javascript/muix/plot-dark.png",
  "interactive_light_html": "https://storage.googleapis.com/anyplot-images/plots/violin-split/javascript/muix/plot-light.html",
  "interactive_dark_html": "https://storage.googleapis.com/anyplot-images/plots/violin-split/javascript/muix/plot-dark.html",
  "quality_score": 93.0,
  "license": "MIT",
  "guide": "https://anyplot.ai/llms.txt"
}
Part of Split Violin Plot on anyplot.ai.