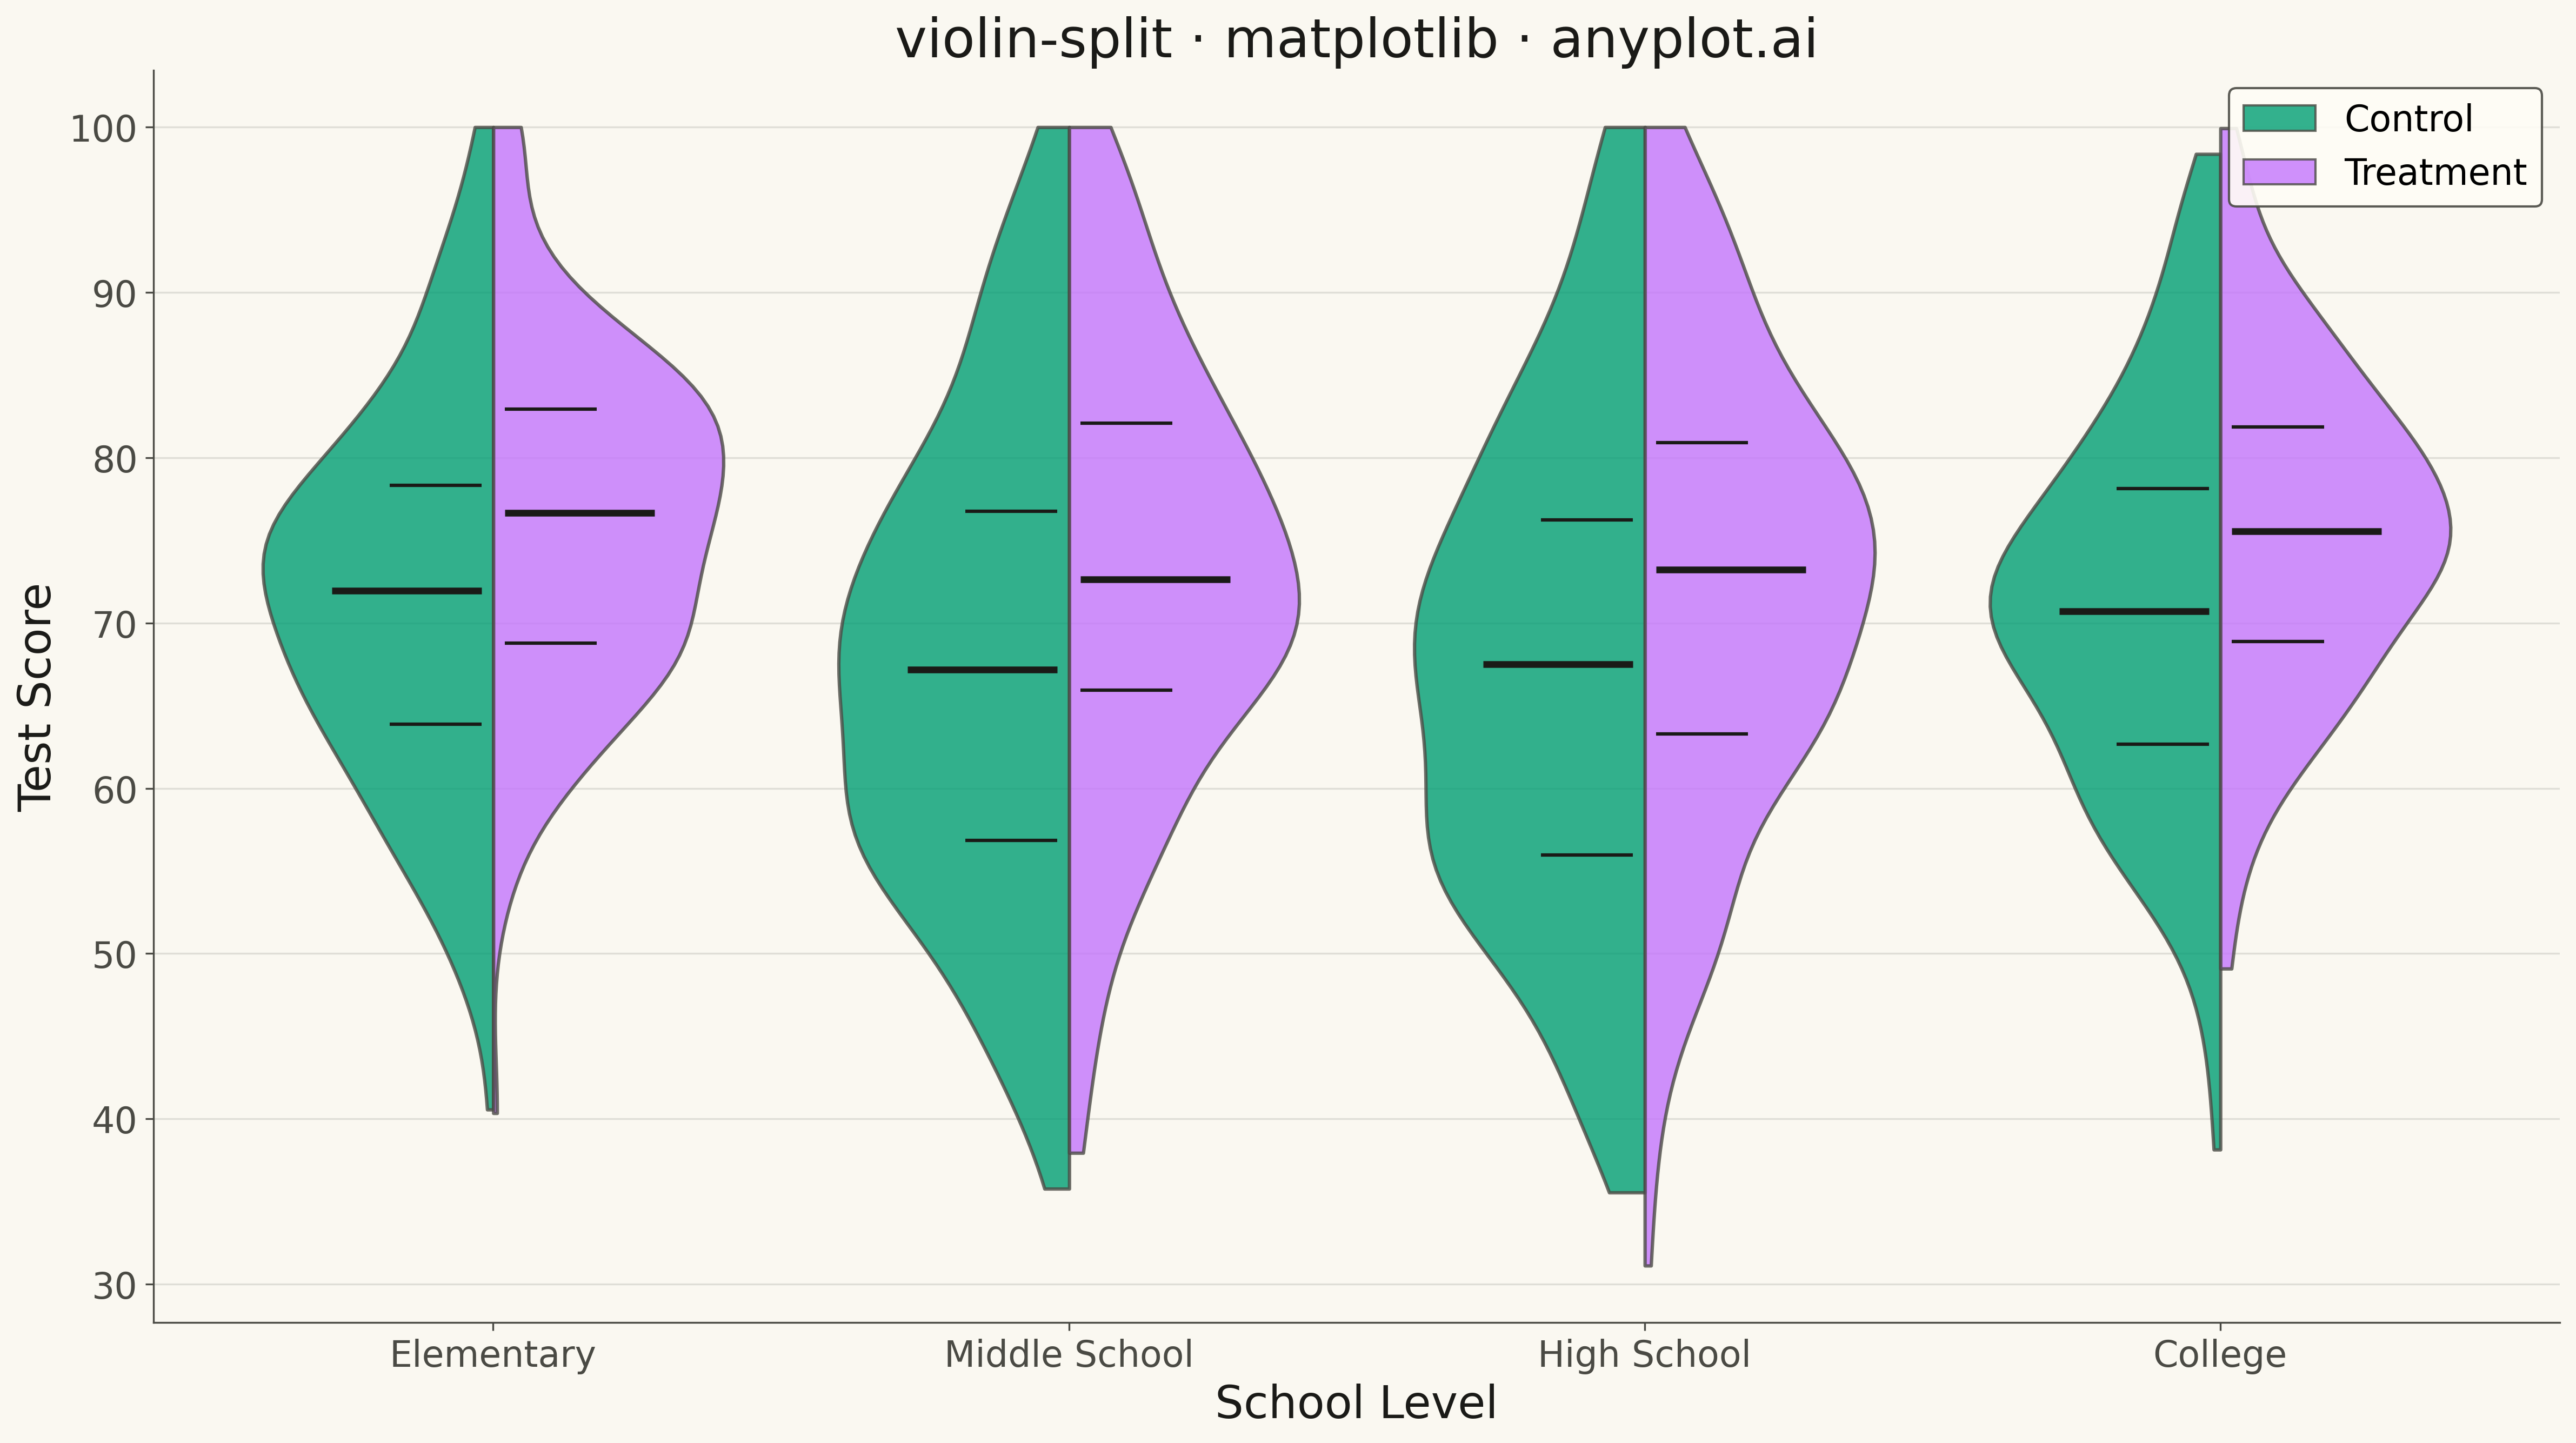
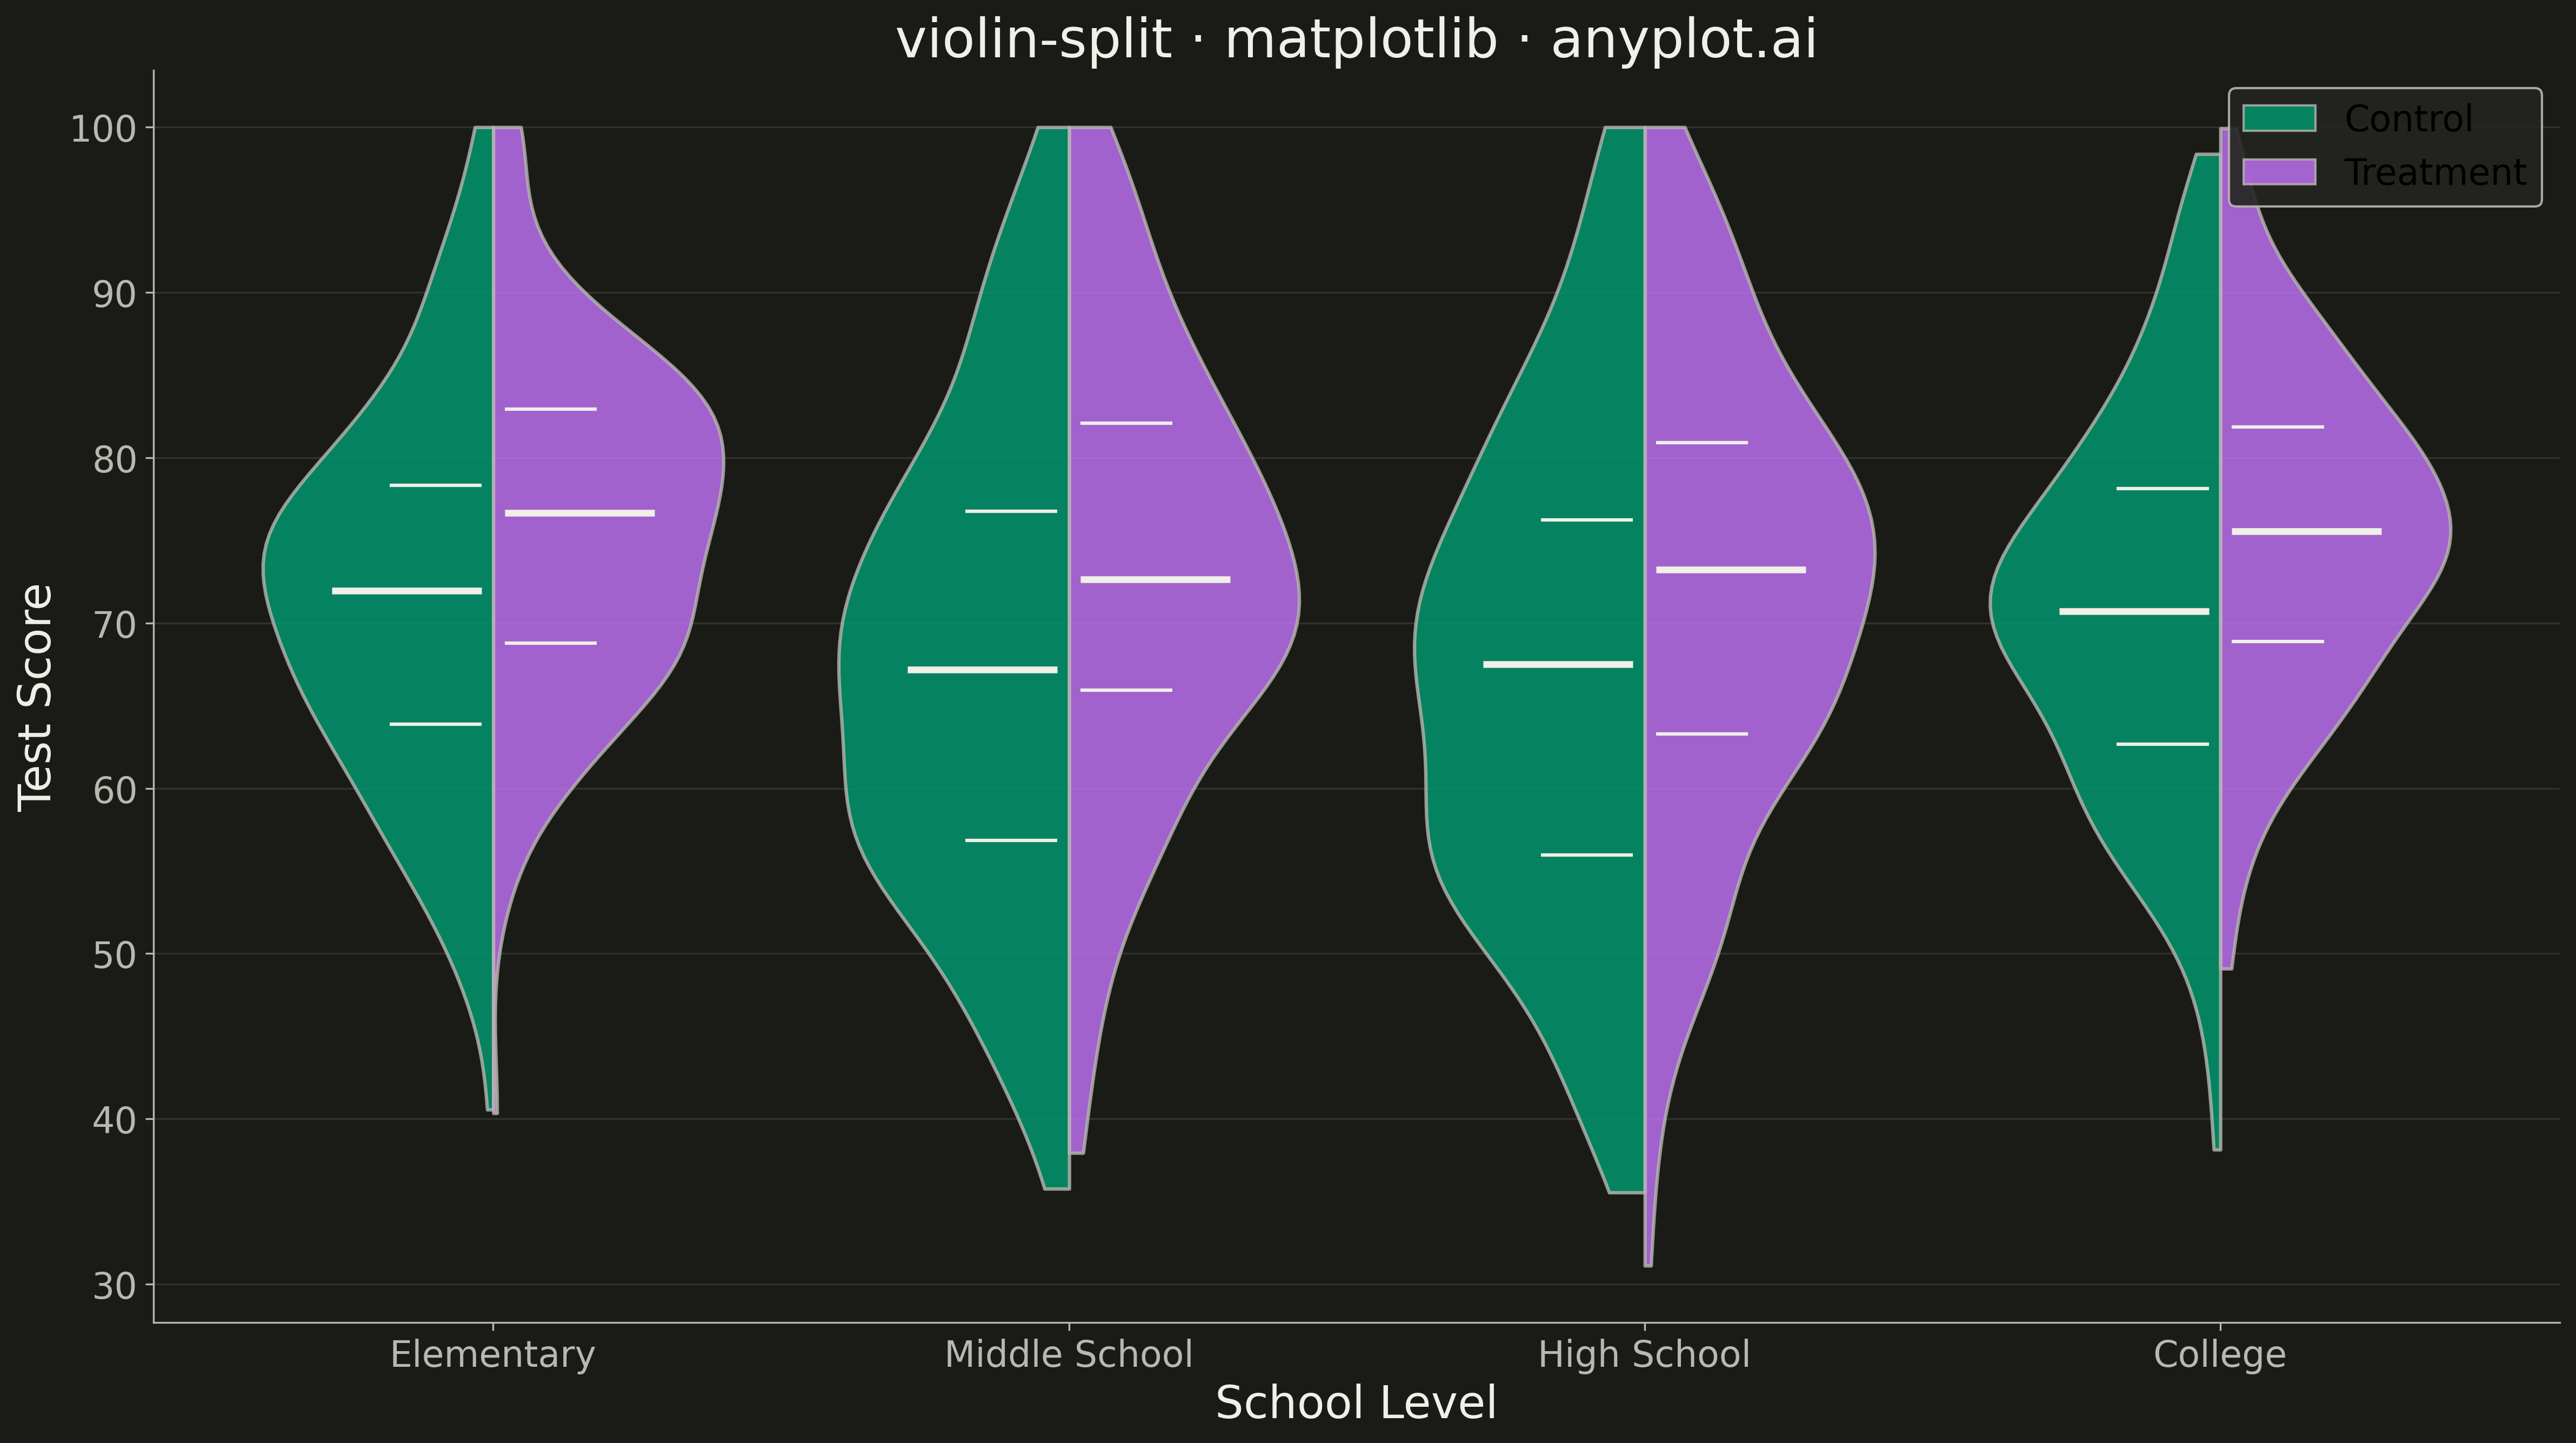
A split violin plot displaying two distributions side-by-side within each violin, with each half representing a different group. Unlike standard violin plots that mirror the same distribution, split violins use the left and right halves to compare two conditions (such as before/after, male/female, or control/treatment) at each category level. This enables direct visual comparison of distribution shapes between paired groups.
""" anyplot.ai
violin-split: Split Violin Plot
Library: matplotlib 3.10.9 | Python 3.13.13
Quality: 88/100 | Updated: 2026-05-08
"""

import os

import matplotlib.pyplot as plt
import numpy as np
from matplotlib.patches import Patch


# Theme tokens
THEME = os.getenv("ANYPLOT_THEME", "light")
PAGE_BG = "#FAF8F1" if THEME == "light" else "#1A1A17"
ELEVATED_BG = "#FFFDF6" if THEME == "light" else "#242420"
INK = "#1A1A17" if THEME == "light" else "#F0EFE8"
INK_SOFT = "#4A4A44" if THEME == "light" else "#B8B7B0"

# Okabe-Ito palette
COLOR_CONTROL = "#009E73"  # Position 1 - brand green
COLOR_TREATMENT = "#C475FD"  # Position 2 - vermillion

# Data - Test score distributions for control vs treatment groups across school levels
np.random.seed(42)

school_levels = ["Elementary", "Middle School", "High School", "College"]
n_per_group = 180

data = {"category": [], "value": [], "split_group": []}

# Generate realistic test score distributions
level_params = {
    "Elementary": {"control_mean": 72, "control_std": 12, "treatment_mean": 76, "treatment_std": 11},
    "Middle School": {"control_mean": 68, "control_std": 14, "treatment_mean": 73, "treatment_std": 13},
    "High School": {"control_mean": 65, "control_std": 16, "treatment_mean": 71, "treatment_std": 14},
    "College": {"control_mean": 70, "control_std": 11, "treatment_mean": 75, "treatment_std": 10},
}

for level in school_levels:
    params = level_params[level]

    # Control group - normal distribution
    control_scores = np.random.normal(params["control_mean"], params["control_std"], n_per_group)
    control_scores = np.clip(control_scores, 20, 100)

    # Treatment group - slightly right-skewed
    treatment_scores = np.random.normal(params["treatment_mean"], params["treatment_std"], n_per_group)
    treatment_scores = np.clip(treatment_scores, 20, 100)

    data["category"].extend([level] * (n_per_group * 2))
    data["value"].extend(list(control_scores) + list(treatment_scores))
    data["split_group"].extend(["Control"] * n_per_group + ["Treatment"] * n_per_group)

# Create figure
fig, ax = plt.subplots(figsize=(16, 9), facecolor=PAGE_BG)
ax.set_facecolor(PAGE_BG)

# Create split violins
positions = np.arange(len(school_levels))

for i, level in enumerate(school_levels):
    # Get data for this school level
    mask_control = [
        j
        for j, (c, g) in enumerate(zip(data["category"], data["split_group"], strict=False))
        if c == level and g == "Control"
    ]
    mask_treatment = [
        j
        for j, (c, g) in enumerate(zip(data["category"], data["split_group"], strict=False))
        if c == level and g == "Treatment"
    ]

    control_vals = [data["value"][j] for j in mask_control]
    treatment_vals = [data["value"][j] for j in mask_treatment]

    # Create violin for control (left side)
    vp_control = ax.violinplot(
        [control_vals], positions=[i], widths=0.8, showmeans=False, showmedians=False, showextrema=False
    )

    # Clip to left half
    for body in vp_control["bodies"]:
        m = np.mean(body.get_paths()[0].vertices[:, 0])
        body.get_paths()[0].vertices[:, 0] = np.clip(body.get_paths()[0].vertices[:, 0], -np.inf, m)
        body.set_facecolor(COLOR_CONTROL)
        body.set_edgecolor(INK_SOFT)
        body.set_linewidth(1.5)
        body.set_alpha(0.8)

    # Create violin for treatment (right side)
    vp_treatment = ax.violinplot(
        [treatment_vals], positions=[i], widths=0.8, showmeans=False, showmedians=False, showextrema=False
    )

    # Clip to right half
    for body in vp_treatment["bodies"]:
        m = np.mean(body.get_paths()[0].vertices[:, 0])
        body.get_paths()[0].vertices[:, 0] = np.clip(body.get_paths()[0].vertices[:, 0], m, np.inf)
        body.set_facecolor(COLOR_TREATMENT)
        body.set_edgecolor(INK_SOFT)
        body.set_linewidth(1.5)
        body.set_alpha(0.8)

    # Add quartile markers
    q1_c, med_c, q3_c = np.percentile(control_vals, [25, 50, 75])
    q1_t, med_t, q3_t = np.percentile(treatment_vals, [25, 50, 75])

    # Control side (left) - median and quartiles
    ax.hlines(med_c, i - 0.28, i - 0.02, colors=INK, linewidth=3, zorder=3)
    ax.hlines([q1_c, q3_c], i - 0.18, i - 0.02, colors=INK, linewidth=1.5, zorder=3)

    # Treatment side (right) - median and quartiles
    ax.hlines(med_t, i + 0.02, i + 0.28, colors=INK, linewidth=3, zorder=3)
    ax.hlines([q1_t, q3_t], i + 0.02, i + 0.18, colors=INK, linewidth=1.5, zorder=3)

# Styling
ax.set_xticks(positions)
ax.set_xticklabels(school_levels, fontsize=16, color=INK_SOFT)
ax.set_xlabel("School Level", fontsize=20, color=INK)
ax.set_ylabel("Test Score", fontsize=20, color=INK)
ax.set_title("violin-split · matplotlib · anyplot.ai", fontsize=24, fontweight="medium", color=INK)
ax.tick_params(axis="both", labelsize=16, colors=INK_SOFT)

# Spine styling
ax.spines["top"].set_visible(False)
ax.spines["right"].set_visible(False)
for s in ("left", "bottom"):
    ax.spines[s].set_color(INK_SOFT)

# Grid - subtle y-axis only
ax.yaxis.grid(True, alpha=0.15, linewidth=0.8, color=INK_SOFT)
ax.set_axisbelow(True)

# Legend
legend_elements = [
    Patch(facecolor=COLOR_CONTROL, edgecolor=INK_SOFT, alpha=0.8, label="Control"),
    Patch(facecolor=COLOR_TREATMENT, edgecolor=INK_SOFT, alpha=0.8, label="Treatment"),
]
leg = ax.legend(handles=legend_elements, fontsize=16, loc="upper right", framealpha=0.9)
leg.get_frame().set_facecolor(ELEVATED_BG)
leg.get_frame().set_edgecolor(INK_SOFT)

plt.tight_layout()
plt.savefig(f"plot-{THEME}.png", dpi=300, bbox_inches="tight", facecolor=PAGE_BG)
Runnable source as JSON, for any HTTP client: https://api.anyplot.ai/specs/violin-split/matplotlib/code. Any spec id and library id listed in llms-full.txt fit the same URL shape; every URL below is complete and callable.
{
  "spec_id": "violin-split",
  "language": "python",
  "library": "matplotlib",
  "page": "https://anyplot.ai/violin-split/python/matplotlib",
  "hub": "https://anyplot.ai/violin-split",
  "code_json": "https://api.anyplot.ai/specs/violin-split/matplotlib/code",
  "spec_json": "https://api.anyplot.ai/specs/violin-split",
  "render_light_png": "https://storage.googleapis.com/anyplot-images/plots/violin-split/python/matplotlib/plot-light.png",
  "render_dark_png": "https://storage.googleapis.com/anyplot-images/plots/violin-split/python/matplotlib/plot-dark.png",
  "quality_score": 88.0,
  "license": "MIT",
  "guide": "https://anyplot.ai/llms.txt"
}
Part of Split Violin Plot on anyplot.ai.