The same plot in 14 other libraries — JavaScript: Chart.js, Apache ECharts, Highcharts, MUI X Charts; Python: Altair, Bokeh, lets-plot, Matplotlib, Plotly, plotnine, Pygal, Seaborn; R: ggplot2; Julia: Makie.jl. Compare all 15 side by side: Split Violin Plot in Python, R, Julia and JavaScript.
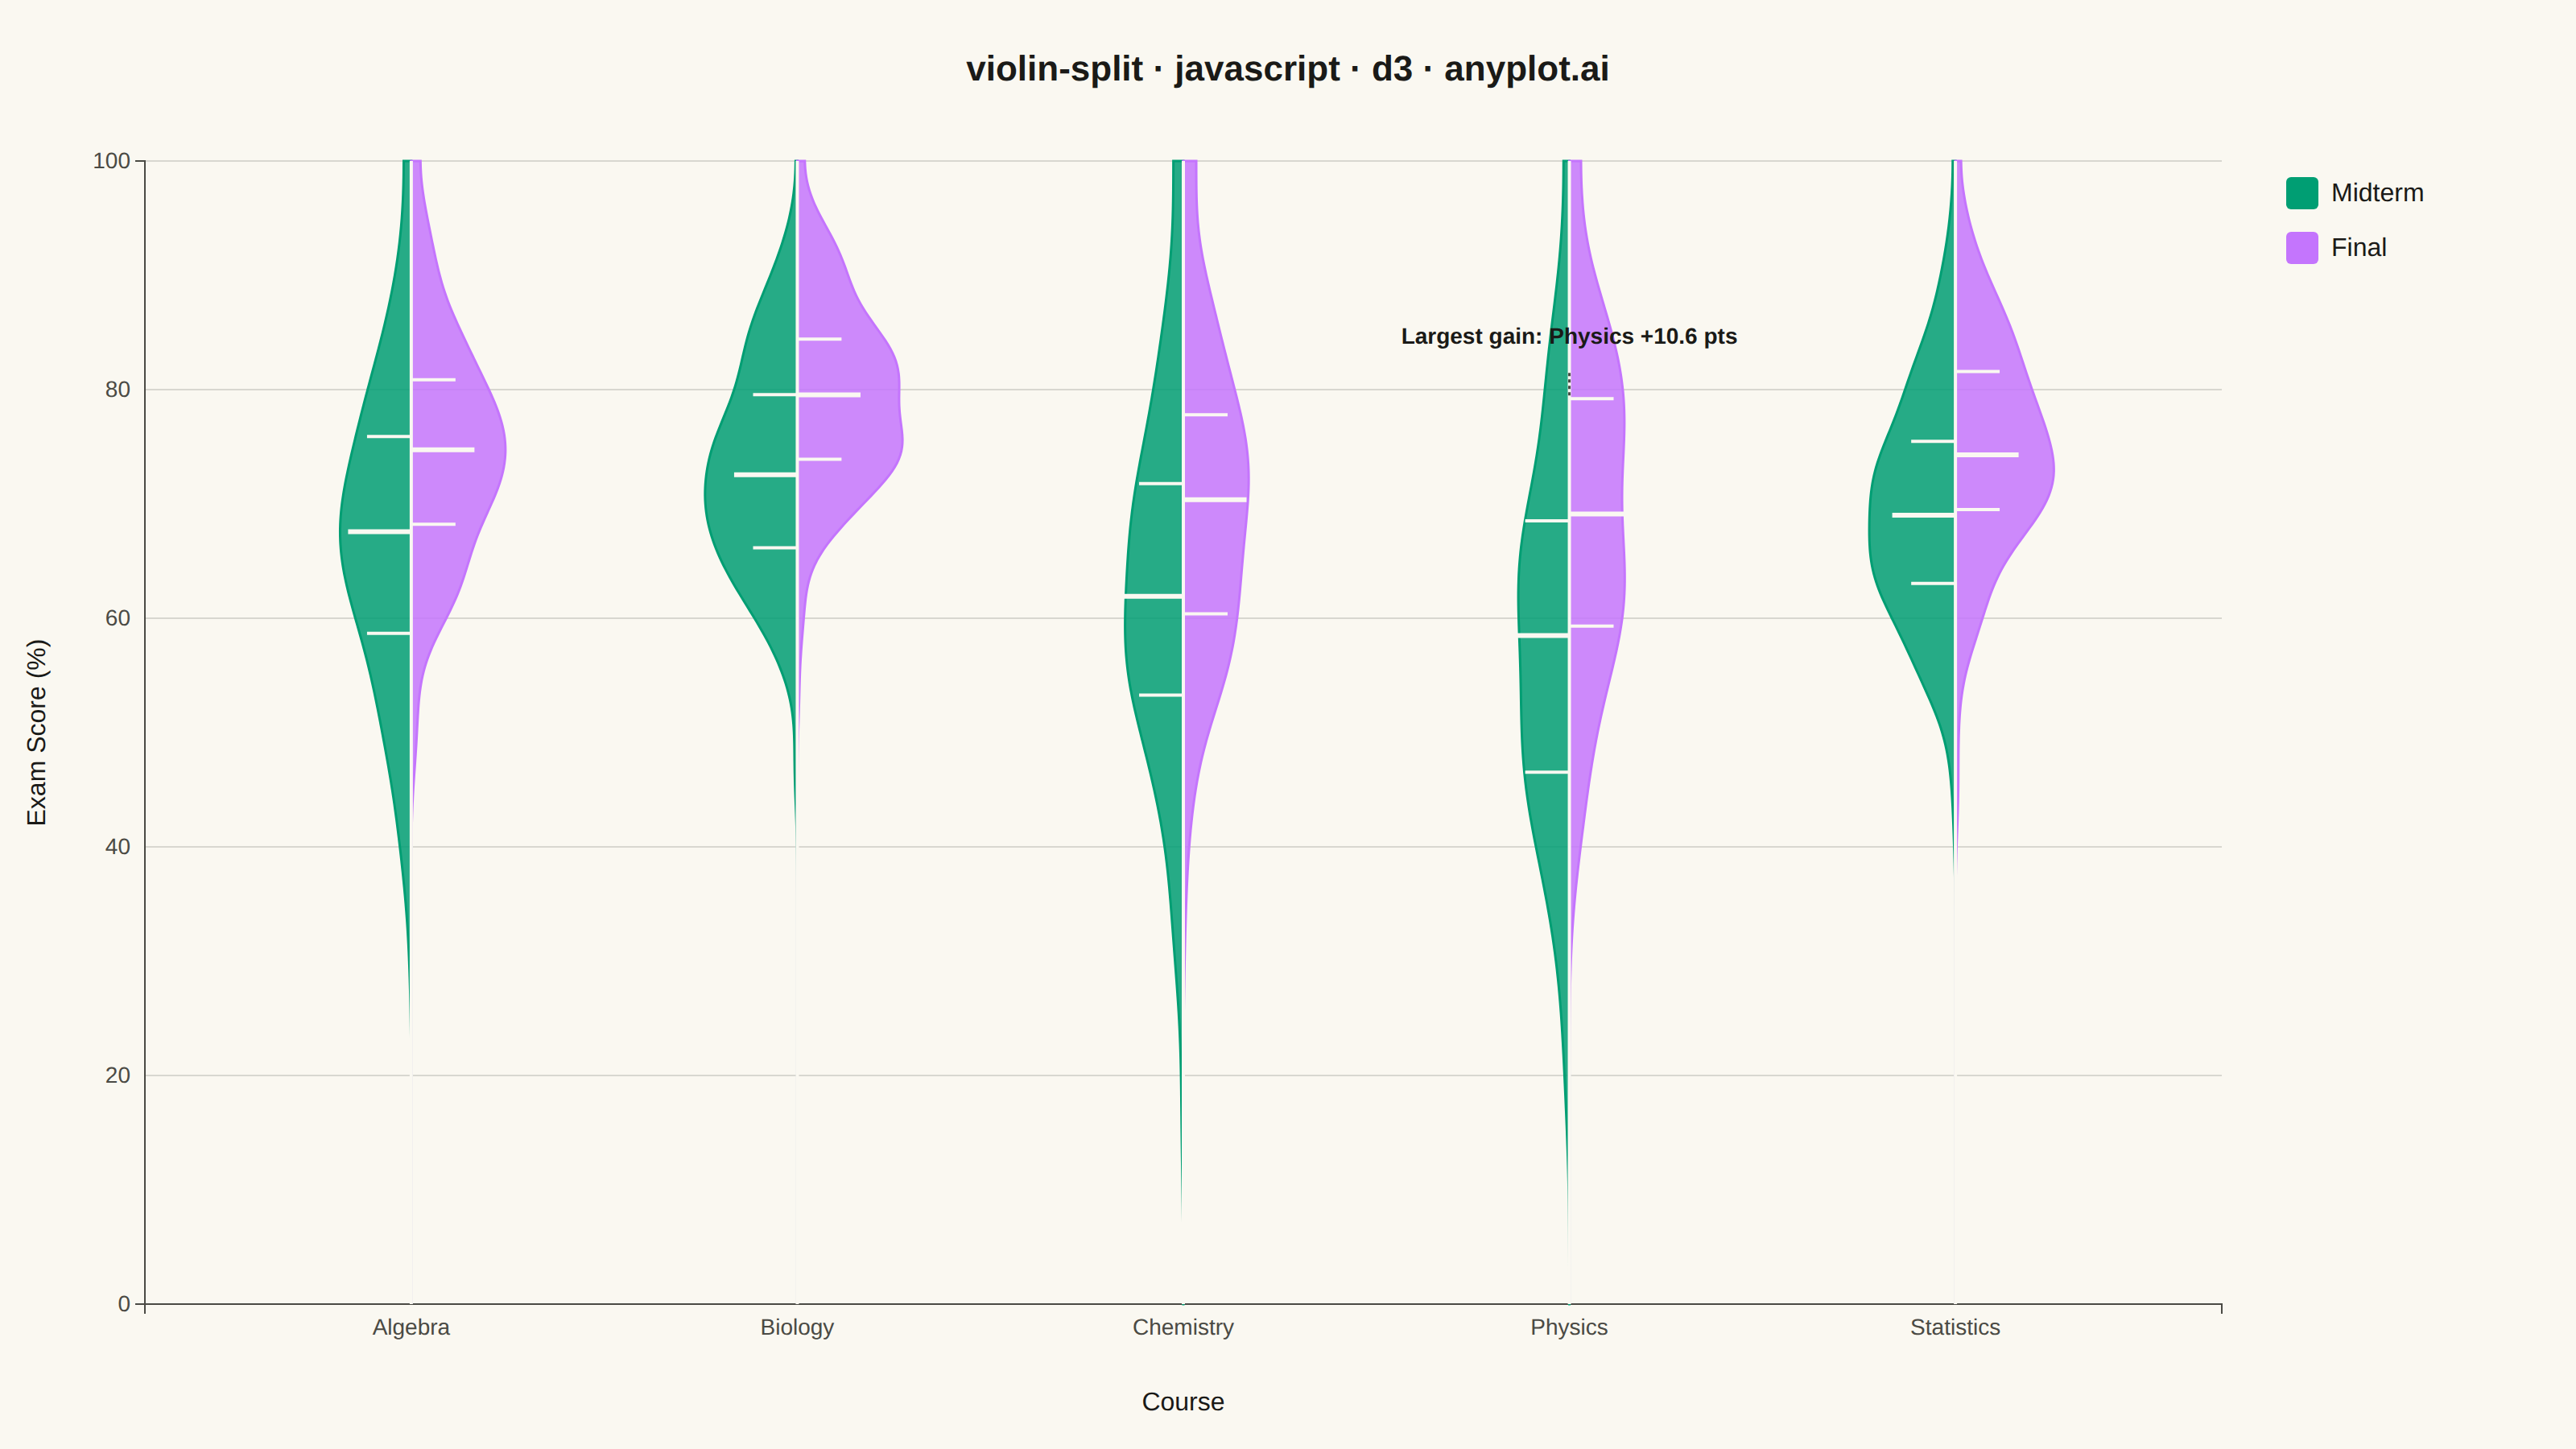
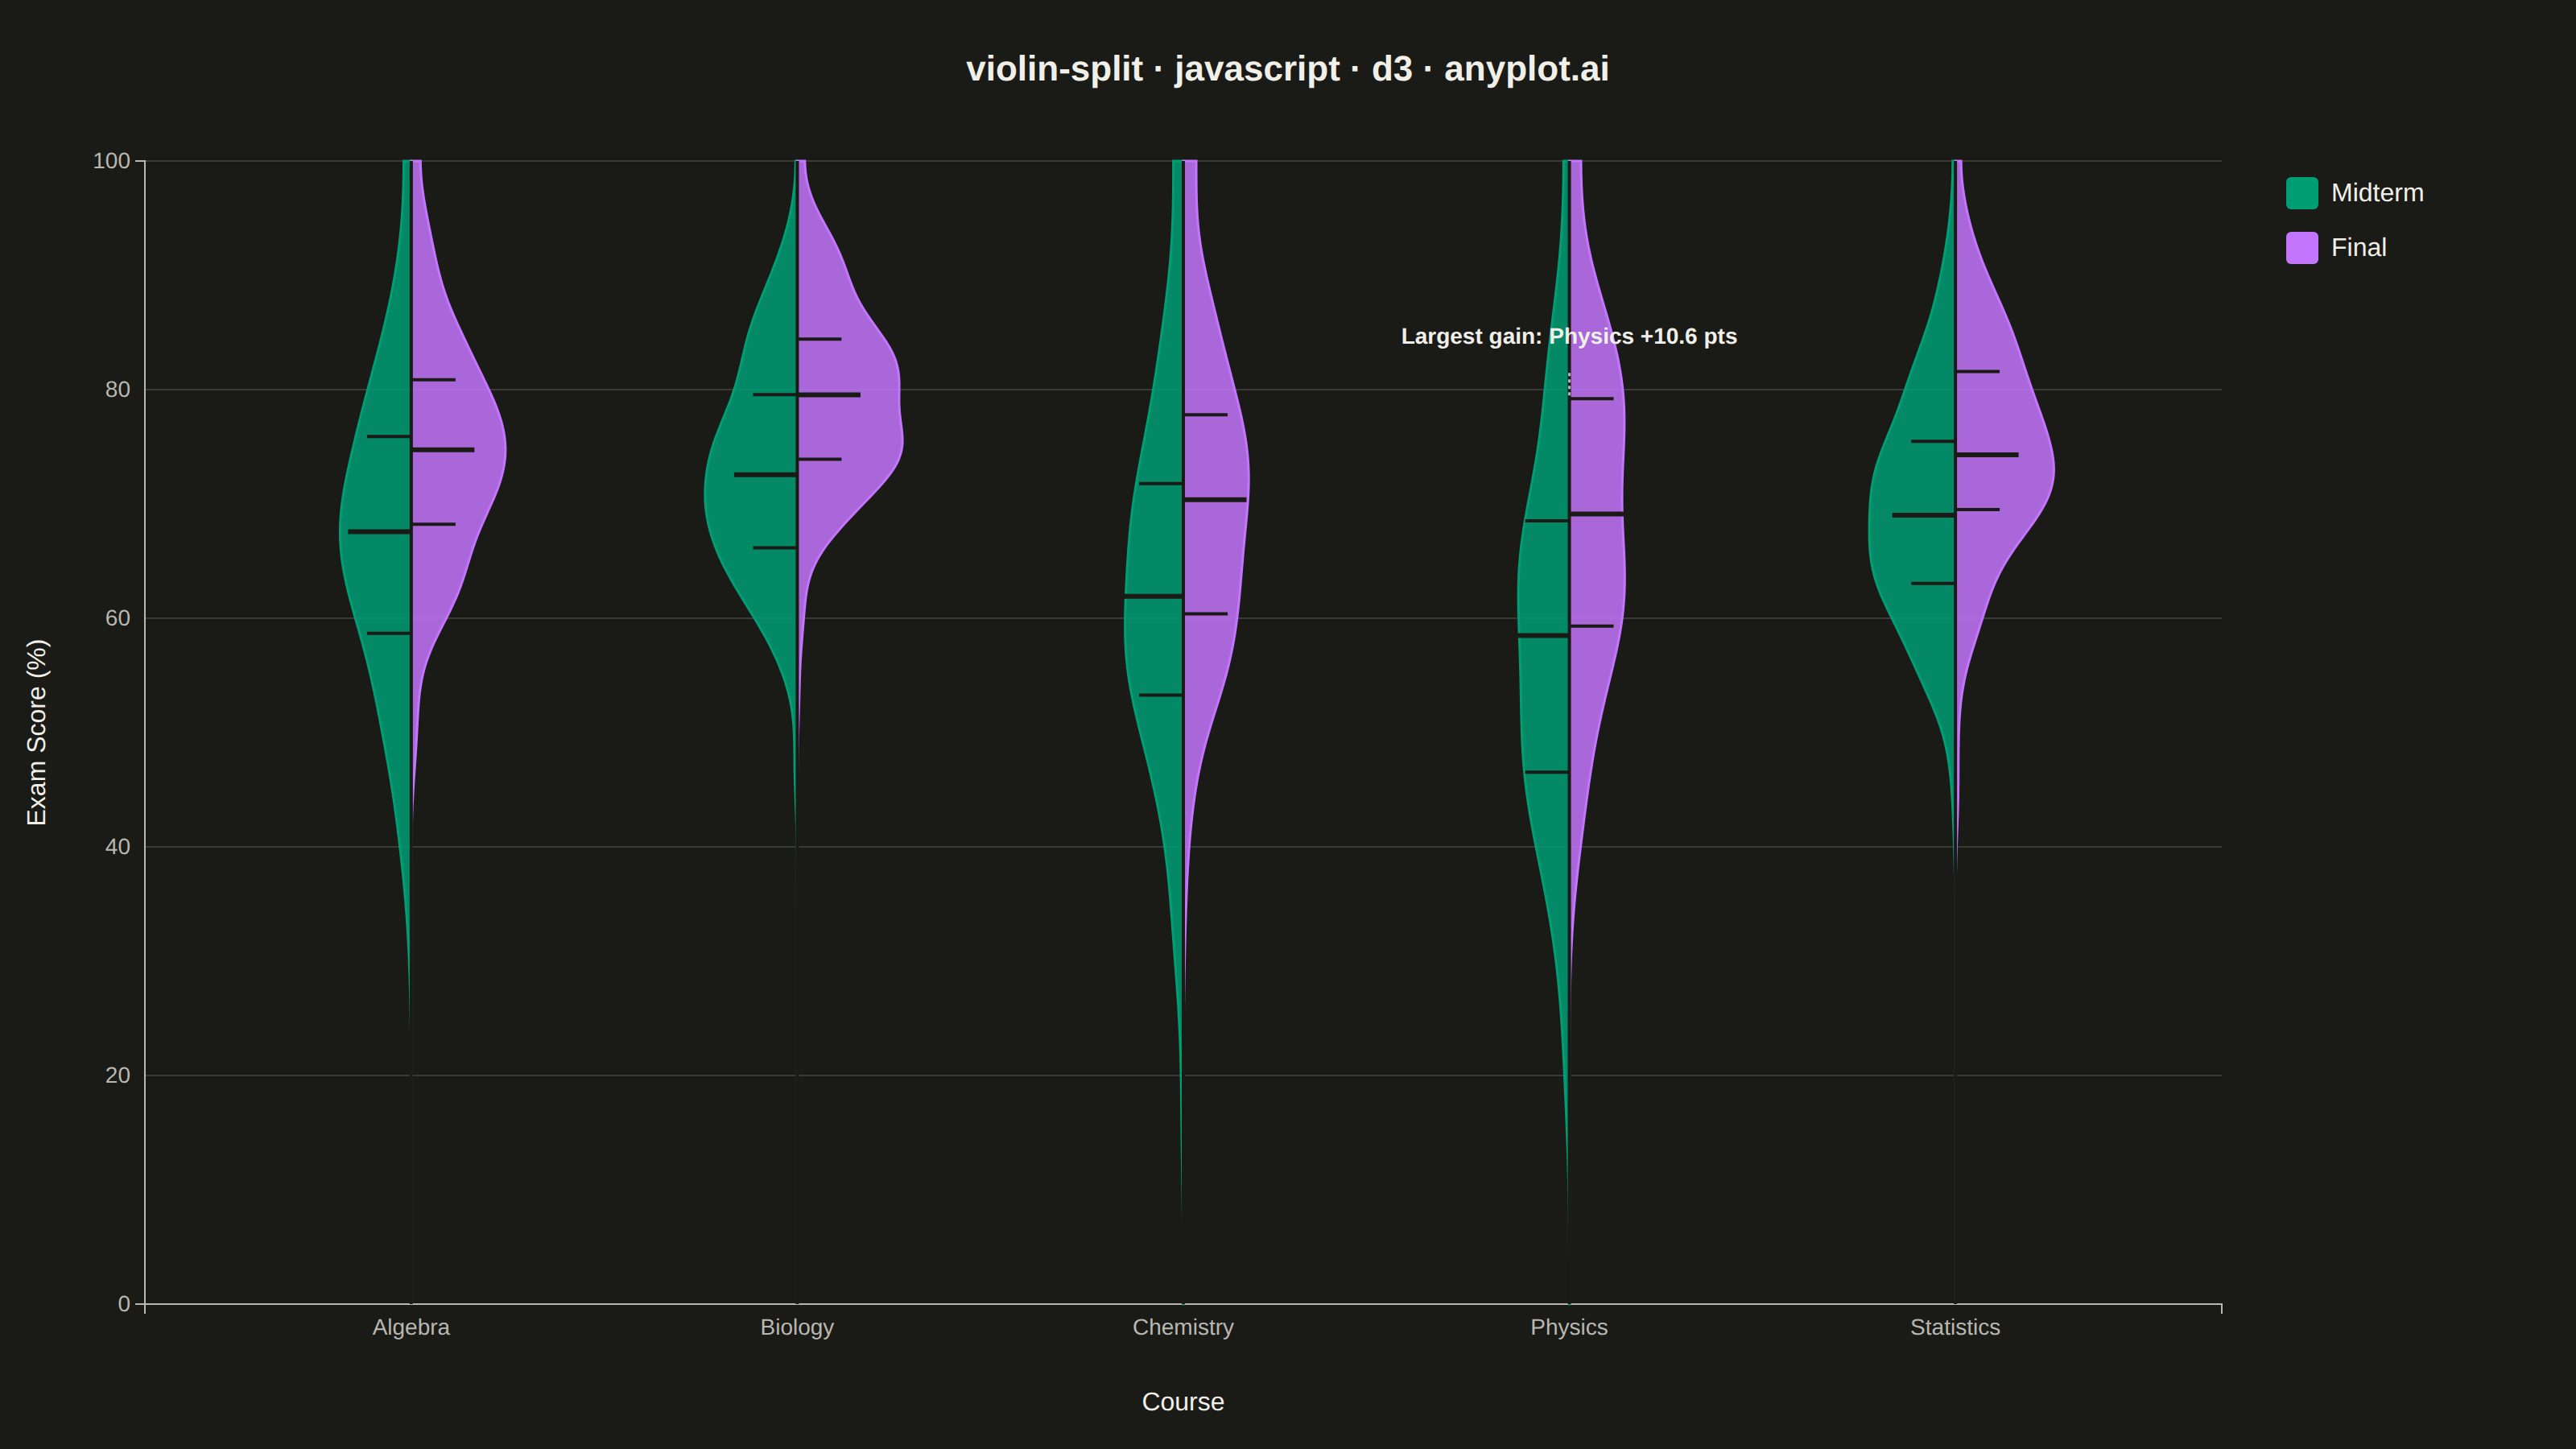
A split violin plot displaying two distributions side-by-side within each violin, with each half representing a different group. Unlike standard violin plots that mirror the same distribution, split violins use the left and right halves to compare two conditions (such as before/after, male/female, or control/treatment) at each category level. This enables direct visual comparison of distribution shapes between paired groups.
// anyplot.ai
// violin-split: Split Violin Plot
// Library: d3 7.9.0 | JavaScript 22.23.2
// Quality: 93/100 | Created: 2026-09-09
//# anyplot-orientation: landscape

const t = window.ANYPLOT_TOKENS;
const { width, height } = window.ANYPLOT_SIZE;
const margin = { top: 100, right: 220, bottom: 90, left: 90 };
const iw = width - margin.left - margin.right;
const ih = height - margin.top - margin.bottom;

// --- Deterministic PRNG (LCG) + Box-Muller normal sampler -------------------
function makeRng(seed) {
  let state = seed >>> 0;
  return function () {
    state = (1103515245 * state + 12345) >>> 0;
    return state / 4294967296;
  };
}
const rng = makeRng(42);
function randNormal(mean, std) {
  const u1 = Math.max(rng(), 1e-9);
  const u2 = rng();
  const z = Math.sqrt(-2 * Math.log(u1)) * Math.cos(2 * Math.PI * u2);
  return mean + z * std;
}
function clamp(v, lo, hi) {
  return Math.max(lo, Math.min(hi, v));
}

// --- Data: midterm vs final exam scores across five courses -----------------
const COURSES = [
  { name: "Algebra", midterm: [68, 12], final: [76, 10] },
  { name: "Biology", midterm: [74, 9], final: [79, 8] },
  { name: "Chemistry", midterm: [63, 14], final: [70, 13] },
  { name: "Physics", midterm: [58, 15], final: [67, 14] },
  { name: "Statistics", midterm: [71, 10], final: [75, 9] },
];
const N = 220;
const courses = COURSES.map((c) => ({
  name: c.name,
  midterm: Array.from({ length: N }, () => clamp(randNormal(c.midterm[0], c.midterm[1]), 0, 100)),
  final: Array.from({ length: N }, () => clamp(randNormal(c.final[0], c.final[1]), 0, 100)),
}));

// --- Kernel density estimate (Gaussian kernel, Silverman bandwidth) ---------
// Boundary-corrected via the reflection method: samples are mirrored across
// the [0, 100] data bounds so the estimate does not taper artificially near
// the edges (courses with means close to 0 or 100 would otherwise show a
// biased, abruptly-cut density there).
const GRID = d3.range(0, 100.001, 100 / 140);
function kde(sample) {
  const std = d3.deviation(sample);
  const bw = 1.06 * std * Math.pow(sample.length, -0.2);
  const gauss = (u) => Math.exp(-0.5 * u * u) / Math.sqrt(2 * Math.PI);
  return GRID.map((x) => {
    let sum = 0;
    for (const v of sample) {
      sum += gauss((x - v) / bw) + gauss((x + v) / bw) + gauss((x - (200 - v)) / bw);
    }
    return { x, density: sum / (sample.length * bw) };
  });
}
for (const c of courses) {
  c.midtermKde = kde(c.midterm);
  c.finalKde = kde(c.final);
}
const maxDensity = d3.max(courses, (c) =>
  Math.max(d3.max(c.midtermKde, (d) => d.density), d3.max(c.finalKde, (d) => d.density))
);

function quartiles(sample) {
  const sorted = [...sample].sort(d3.ascending);
  return {
    q1: d3.quantileSorted(sorted, 0.25),
    median: d3.quantileSorted(sorted, 0.5),
    q3: d3.quantileSorted(sorted, 0.75),
  };
}
for (const c of courses) {
  c.midtermStats = quartiles(c.midterm);
  c.finalStats = quartiles(c.final);
}

// --- Scales -------------------------------------------------------------
const x = d3.scaleBand().domain(courses.map((c) => c.name)).range([0, iw]).padding(0.38);
const y = d3.scaleLinear().domain([0, 100]).nice().range([ih, 0]);
const halfWidth = (x.bandwidth() / 2) * 0.88;
const widthScale = d3.scaleLinear().domain([0, maxDensity]).range([0, halfWidth]);

// --- SVG mount --------------------------------------------------------------
const svg = d3.select("#container").append("svg").attr("width", width).attr("height", height);
const g = svg.append("g").attr("transform", `translate(${margin.left},${margin.top})`);

// --- Y gridlines (drawn first, below the violins) ---------------------------
g.append("g")
  .selectAll("line")
  .data(y.ticks(6))
  .join("line")
  .attr("x1", 0)
  .attr("x2", iw)
  .attr("y1", (d) => y(d))
  .attr("y2", (d) => y(d))
  .attr("stroke", t.grid)
  .attr("stroke-width", 1);

// --- Axes -------------------------------------------------------------------
const xAxis = g.append("g").attr("transform", `translate(0,${ih})`).call(d3.axisBottom(x));
const yAxis = g.append("g").call(d3.axisLeft(y).ticks(6));
for (const ax of [xAxis, yAxis]) {
  ax.selectAll("text").attr("fill", t.inkSoft).style("font-size", "14px");
  ax.selectAll(".tick line").remove();
  ax.select(".domain").attr("stroke", t.inkSoft);
}

// --- Split violin halves ------------------------------------------------
const areaLeft = d3.area().curve(d3.curveBasis).y((d) => y(d.x)).x0(0).x1((d) => -widthScale(d.density));
const areaRight = d3.area().curve(d3.curveBasis).y((d) => y(d.x)).x0(0).x1((d) => widthScale(d.density));

const violin = g
  .selectAll(".violin")
  .data(courses)
  .join("g")
  .attr("class", "violin")
  .attr("transform", (d) => `translate(${x(d.name) + x.bandwidth() / 2},0)`);

violin
  .append("path")
  .attr("d", (d) => areaLeft(d.midtermKde))
  .attr("fill", t.palette[0])
  .attr("fill-opacity", 0.85)
  .attr("stroke", t.palette[0])
  .attr("stroke-width", 1.5);

violin
  .append("path")
  .attr("d", (d) => areaRight(d.finalKde))
  .attr("fill", t.palette[1])
  .attr("fill-opacity", 0.85)
  .attr("stroke", t.palette[1])
  .attr("stroke-width", 1.5);

// center seam where the two halves meet
violin
  .append("line")
  .attr("x1", 0)
  .attr("x2", 0)
  .attr("y1", 0)
  .attr("y2", ih)
  .attr("stroke", t.pageBg)
  .attr("stroke-width", 2);

// --- Inner quartile markers (median tick + IQR ticks) per half --------------
function drawQuartiles(sel, stats, sign) {
  const { q1, median, q3 } = stats;
  sel
    .append("line")
    .attr("x1", 0)
    .attr("x2", sign * halfWidth * 0.42)
    .attr("y1", y(q1))
    .attr("y2", y(q1))
    .attr("stroke", t.pageBg)
    .attr("stroke-width", 2);
  sel
    .append("line")
    .attr("x1", 0)
    .attr("x2", sign * halfWidth * 0.42)
    .attr("y1", y(q3))
    .attr("y2", y(q3))
    .attr("stroke", t.pageBg)
    .attr("stroke-width", 2);
  sel
    .append("line")
    .attr("x1", 0)
    .attr("x2", sign * halfWidth * 0.6)
    .attr("y1", y(median))
    .attr("y2", y(median))
    .attr("stroke", t.pageBg)
    .attr("stroke-width", 3);
}
violin.each(function (d) {
  const sel = d3.select(this);
  drawQuartiles(sel, d.midtermStats, -1);
  drawQuartiles(sel, d.finalStats, 1);
});

// --- Storytelling annotation: call out the course with the largest --------
// midterm -> final median gain
let bestCourse = courses[0];
let bestGain = -Infinity;
for (const c of courses) {
  const gain = c.finalStats.median - c.midtermStats.median;
  if (gain > bestGain) {
    bestGain = gain;
    bestCourse = c;
  }
}
const calloutX = x(bestCourse.name) + x.bandwidth() / 2;
const calloutTopY = Math.max(
  20,
  Math.min(y(bestCourse.midtermStats.q3), y(bestCourse.finalStats.q3)) - 34
);
const callout = g.append("g").attr("class", "callout");
callout
  .append("line")
  .attr("x1", calloutX)
  .attr("x2", calloutX)
  .attr("y1", calloutTopY + 18)
  .attr("y2", calloutTopY + 32)
  .attr("stroke", t.inkSoft)
  .attr("stroke-width", 1.5)
  .attr("stroke-dasharray", "2,2");
callout
  .append("text")
  .attr("x", calloutX)
  .attr("y", calloutTopY)
  .attr("text-anchor", "middle")
  .attr("fill", t.ink)
  .style("font-size", "14px")
  .style("font-weight", "600")
  .text(`Largest gain: ${bestCourse.name} +${bestGain.toFixed(1)} pts`);

// --- Legend -------------------------------------------------------------
const legendData = [
  { label: "Midterm", color: t.palette[0] },
  { label: "Final", color: t.palette[1] },
];
const legend = svg.append("g").attr("transform", `translate(${margin.left + iw + 40}, ${margin.top + 10})`);
const legendRows = legend
  .selectAll("g")
  .data(legendData)
  .join("g")
  .attr("transform", (d, i) => `translate(0, ${i * 34})`);
legendRows.append("rect").attr("width", 20).attr("height", 20).attr("rx", 3).attr("fill", (d) => d.color);
legendRows
  .append("text")
  .attr("x", 28)
  .attr("y", 15)
  .attr("fill", t.ink)
  .style("font-size", "16px")
  .text((d) => d.label);

// --- Axis labels --------------------------------------------------------
svg
  .append("text")
  .attr("x", margin.left + iw / 2)
  .attr("y", height - 24)
  .attr("text-anchor", "middle")
  .attr("fill", t.ink)
  .style("font-size", "16px")
  .text("Course");

svg
  .append("text")
  .attr("transform", `translate(28, ${margin.top + ih / 2}) rotate(-90)`)
  .attr("text-anchor", "middle")
  .attr("fill", t.ink)
  .style("font-size", "16px")
  .text("Exam Score (%)");

// --- Title --------------------------------------------------------------
svg
  .append("text")
  .attr("x", width / 2)
  .attr("y", 50)
  .attr("text-anchor", "middle")
  .attr("fill", t.ink)
  .style("font-size", "22px")
  .style("font-weight", "600")
  .text("violin-split · javascript · d3 · anyplot.ai");
Runnable source as JSON, for any HTTP client: https://api.anyplot.ai/specs/violin-split/d3/code. Any spec id and library id listed in llms-full.txt fit the same URL shape; every URL below is complete and callable.
{
  "spec_id": "violin-split",
  "language": "javascript",
  "library": "d3",
  "page": "https://anyplot.ai/violin-split/javascript/d3",
  "hub": "https://anyplot.ai/violin-split",
  "code_json": "https://api.anyplot.ai/specs/violin-split/d3/code",
  "spec_json": "https://api.anyplot.ai/specs/violin-split",
  "render_light_png": "https://storage.googleapis.com/anyplot-images/plots/violin-split/javascript/d3/plot-light.png",
  "render_dark_png": "https://storage.googleapis.com/anyplot-images/plots/violin-split/javascript/d3/plot-dark.png",
  "interactive_light_html": "https://storage.googleapis.com/anyplot-images/plots/violin-split/javascript/d3/plot-light.html",
  "interactive_dark_html": "https://storage.googleapis.com/anyplot-images/plots/violin-split/javascript/d3/plot-dark.html",
  "quality_score": 93.0,
  "license": "MIT",
  "guide": "https://anyplot.ai/llms.txt"
}
Part of Split Violin Plot on anyplot.ai.