The same plot in 14 other libraries — JavaScript: Chart.js, Apache ECharts, Highcharts, MUI X Charts; Python: Altair, Bokeh, lets-plot, Matplotlib, Plotly, plotnine, Pygal, Seaborn; R: ggplot2; Julia: Makie.jl. Compare all 15 side by side: Violin Plot with Overlaid Swarm Points in Python, R, Julia and JavaScript.
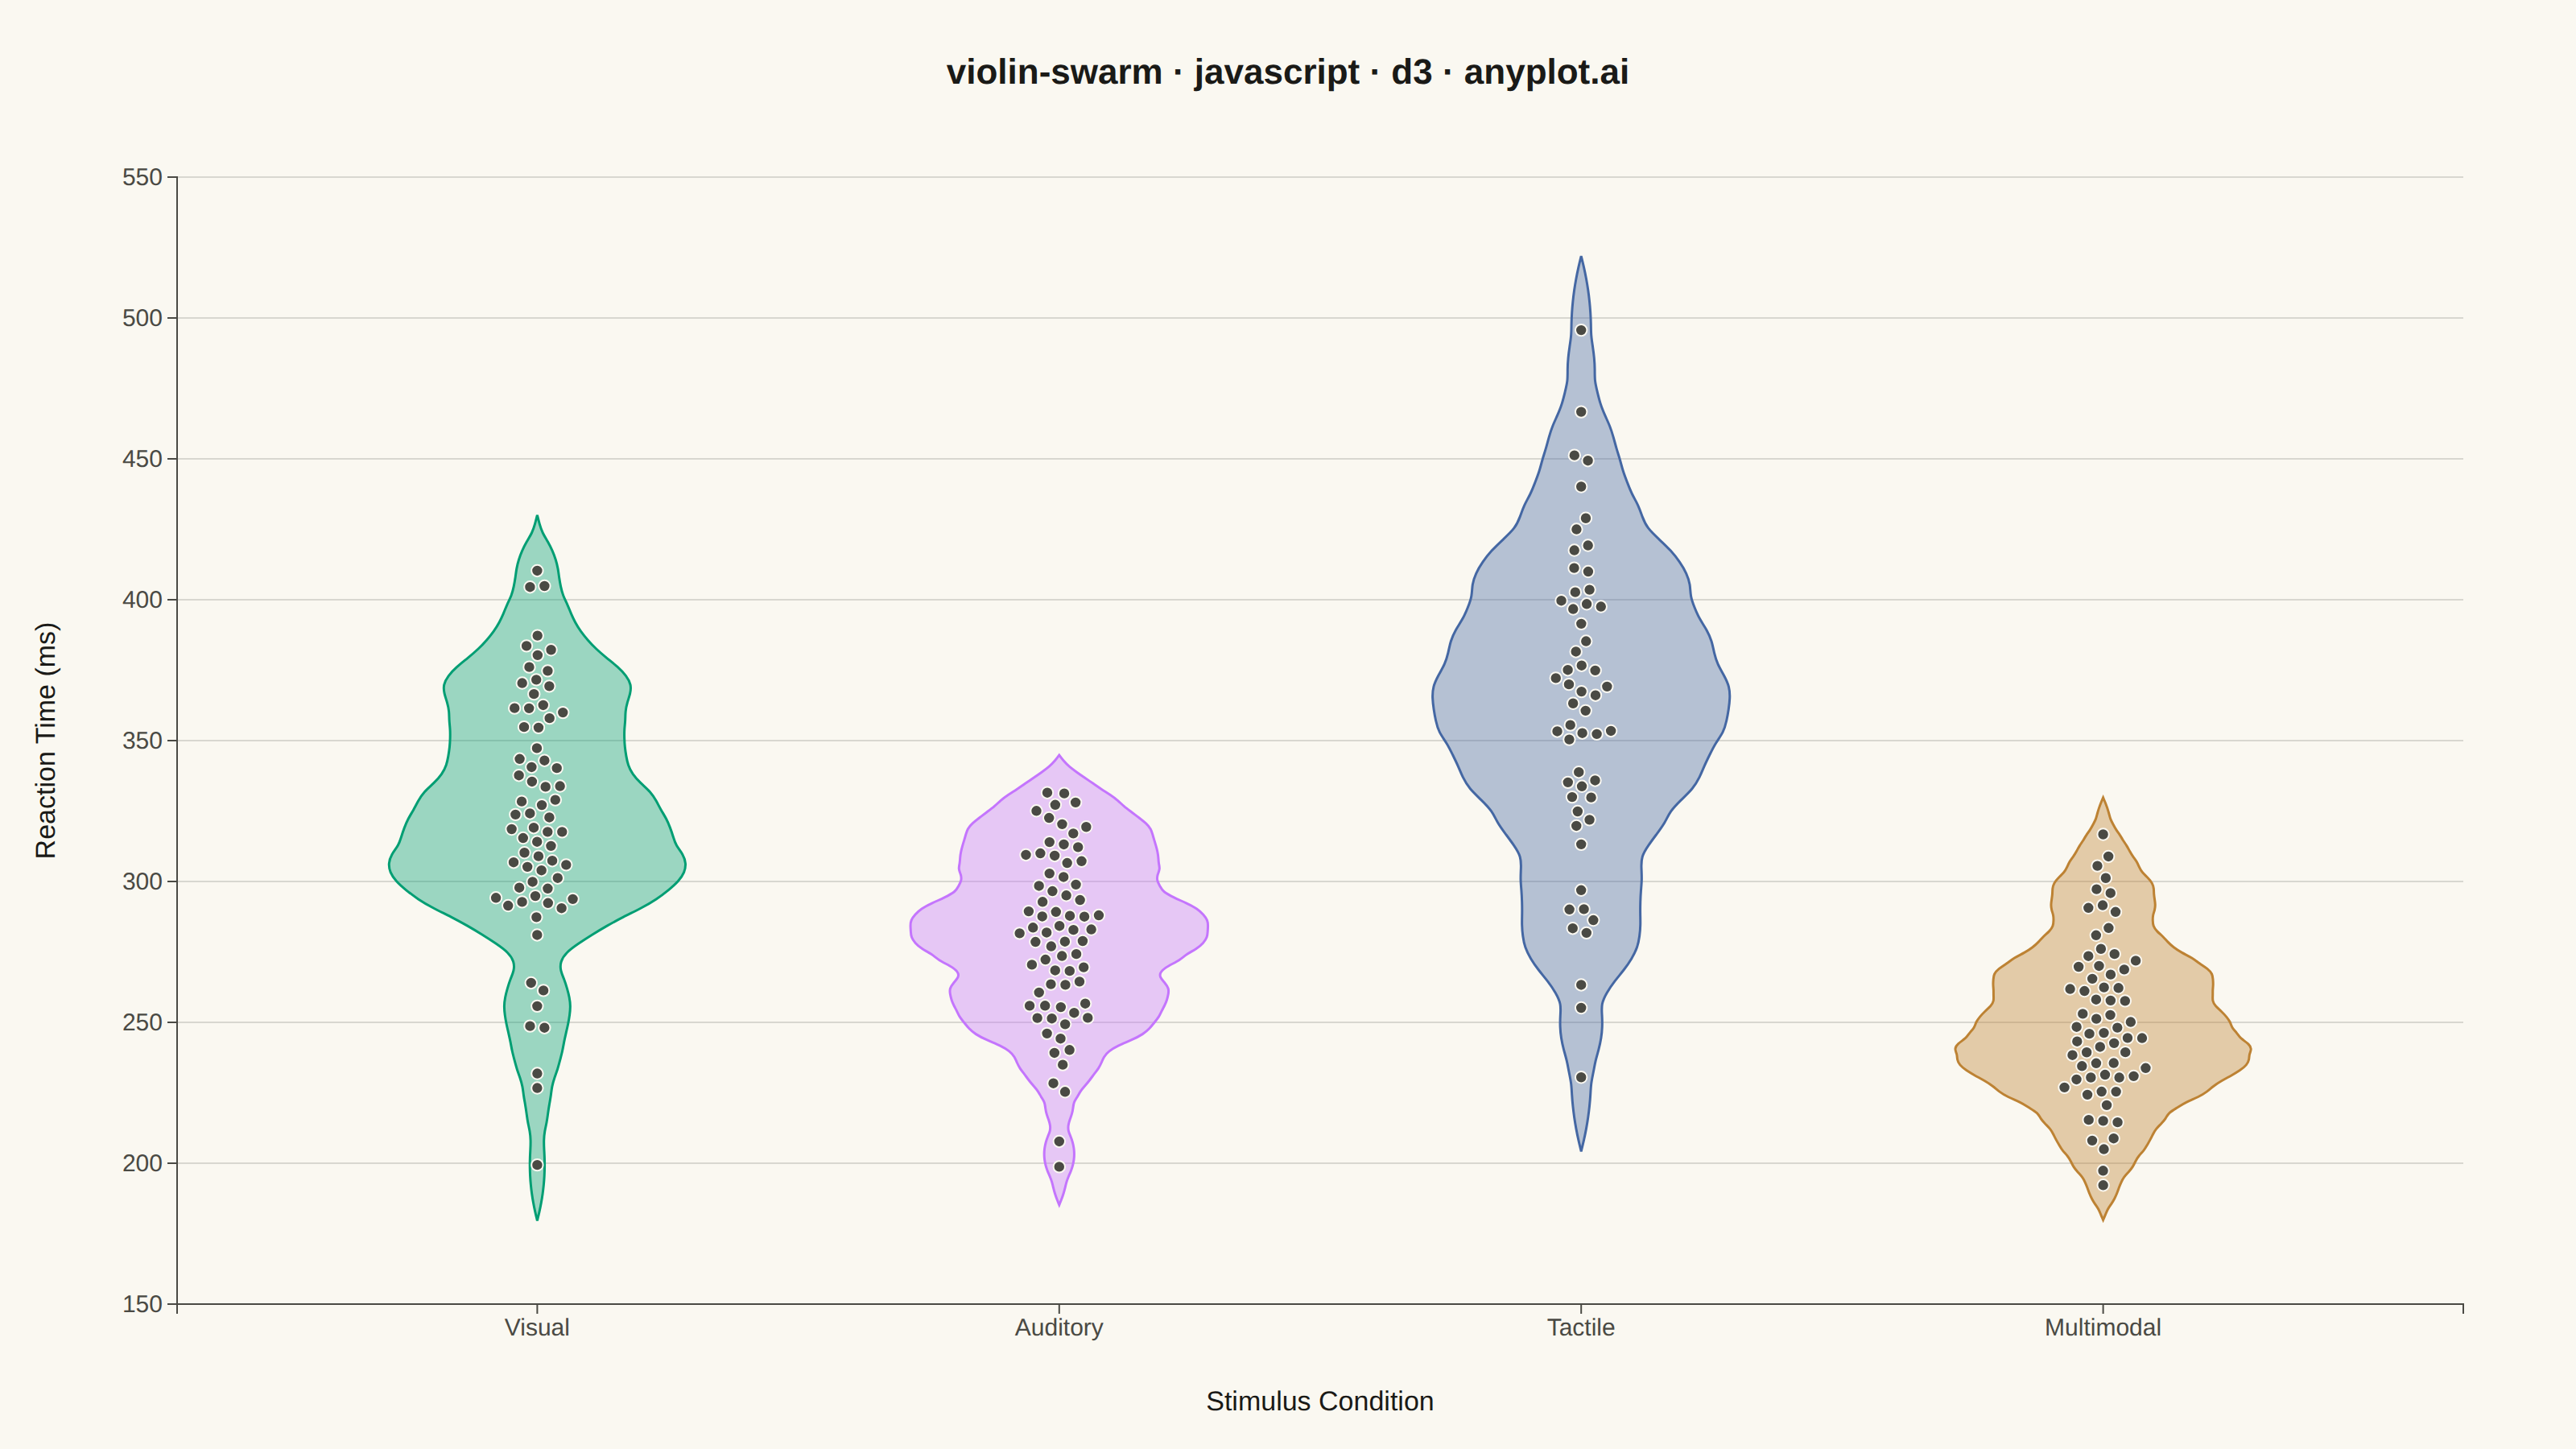
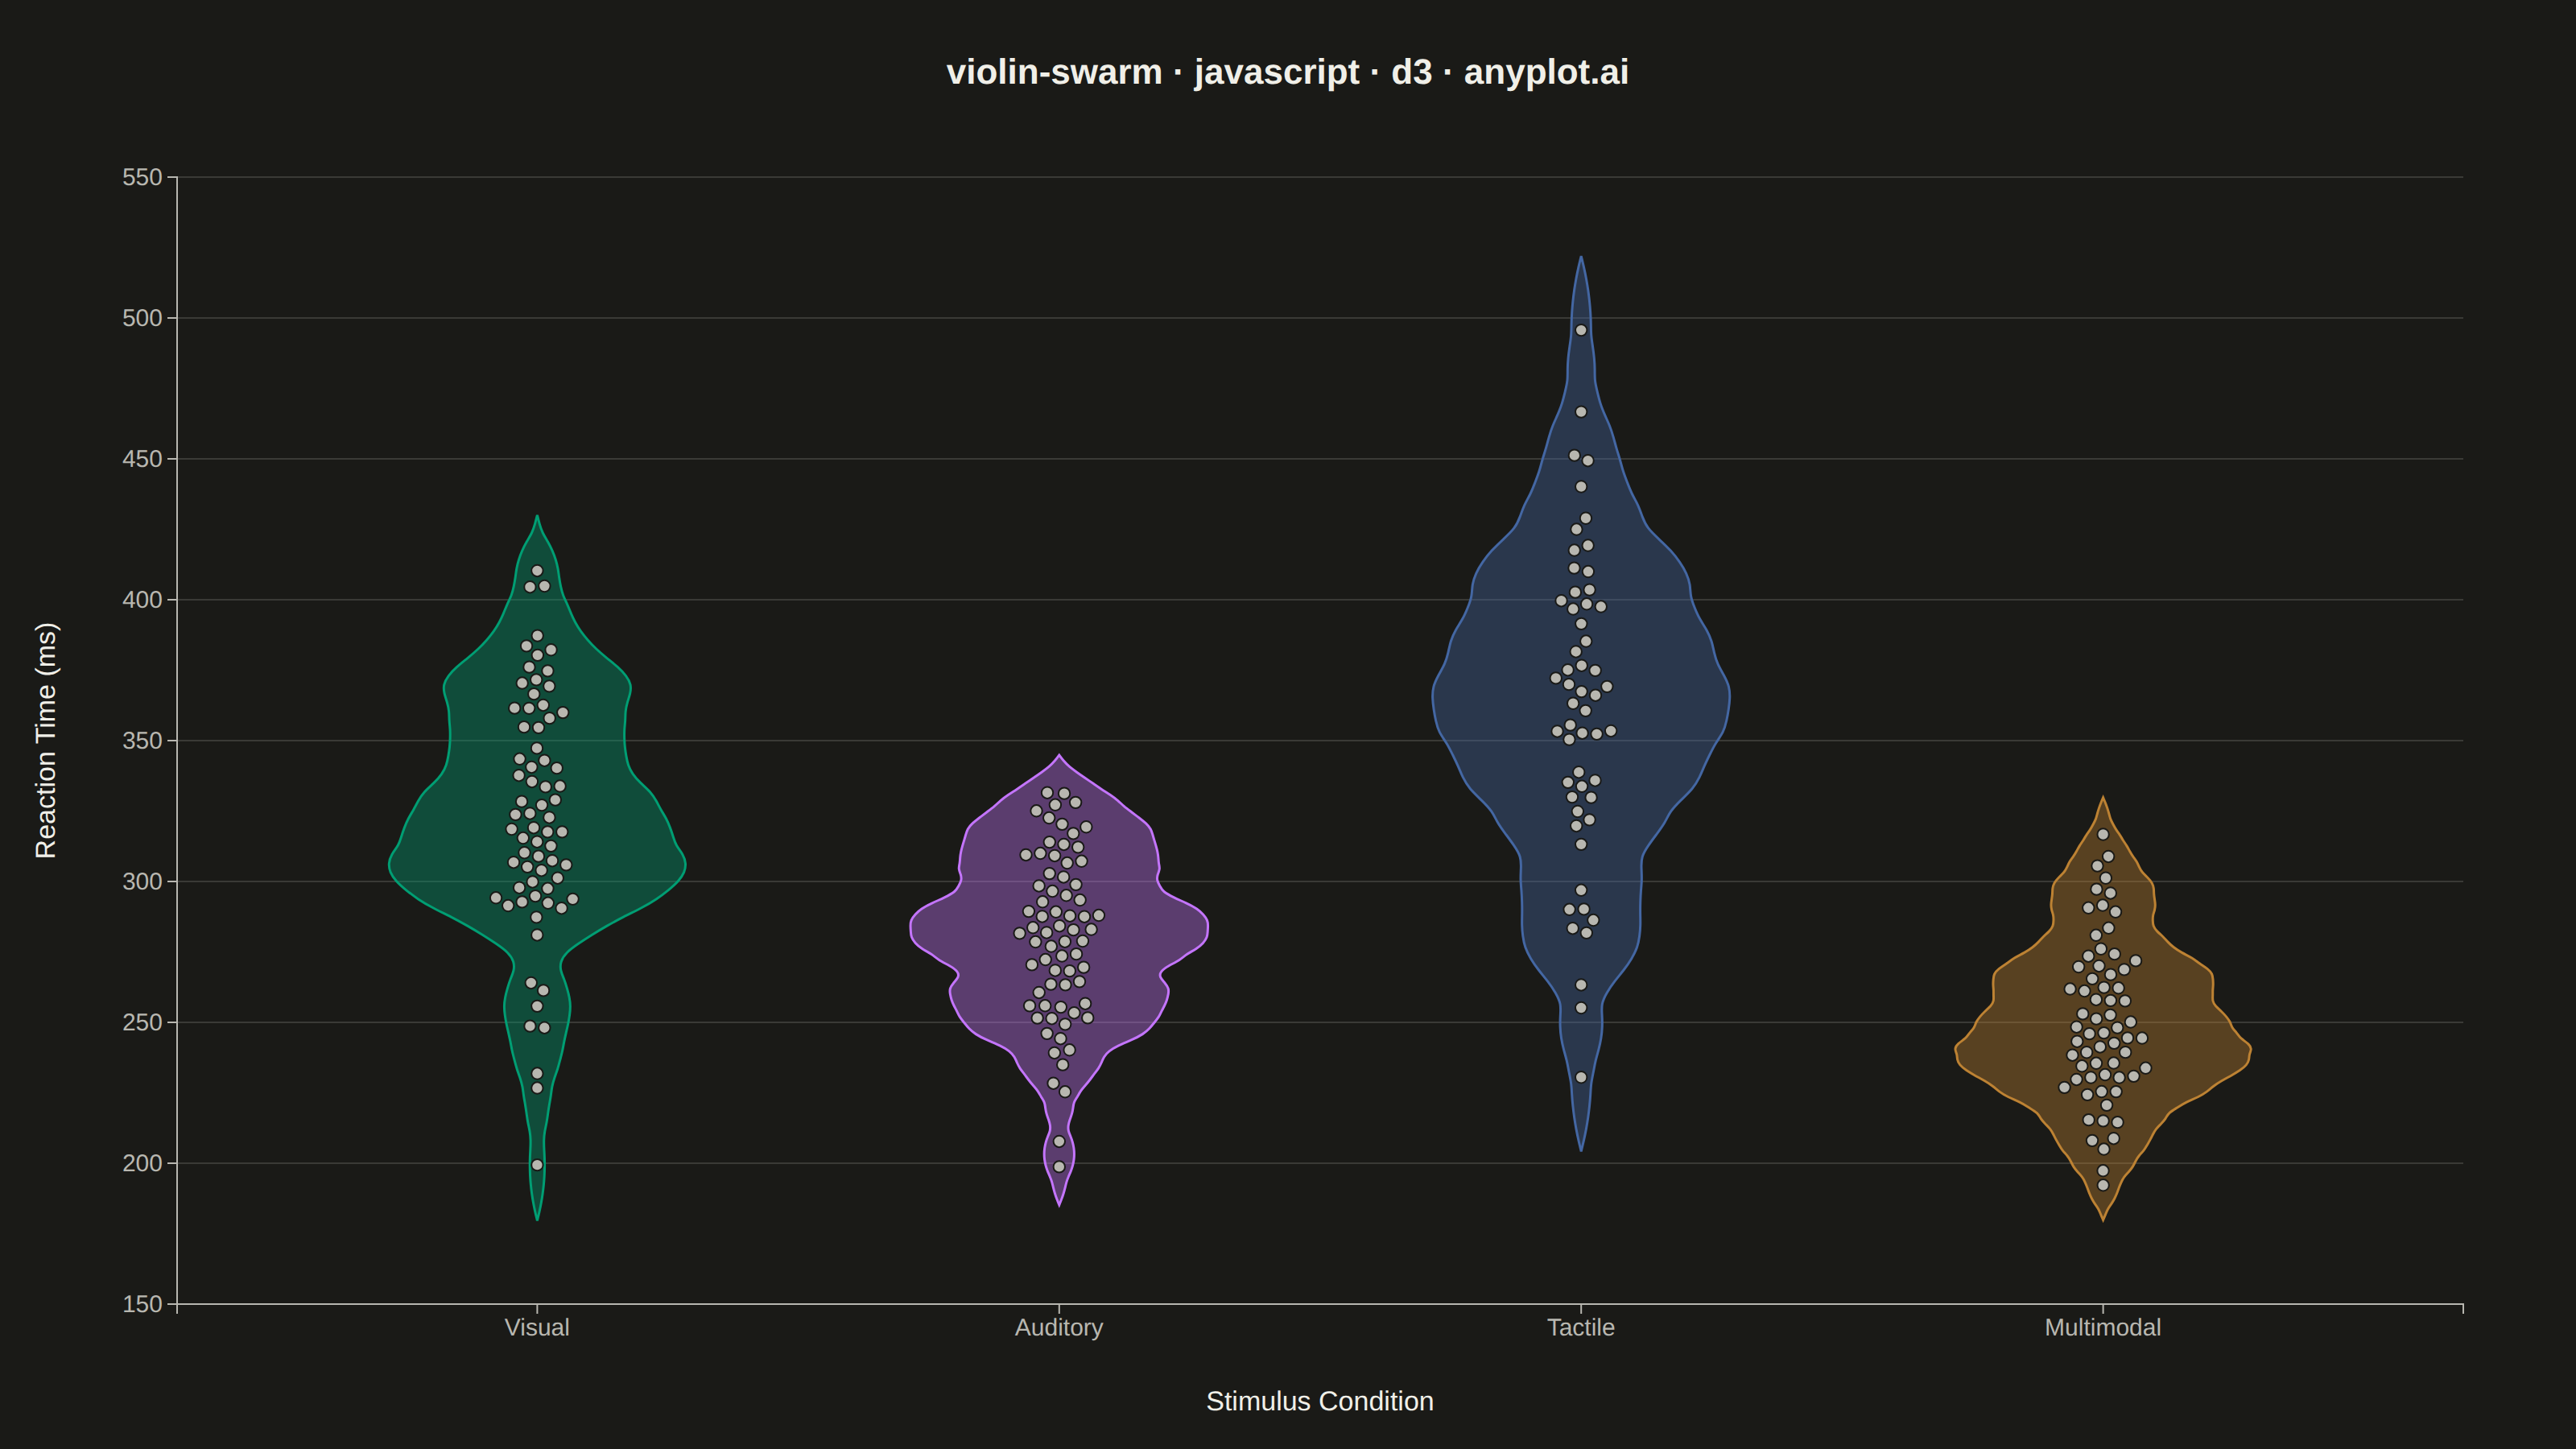
A violin plot with individual data points overlaid as a swarm plot, combining smooth kernel density estimation with raw data visibility. The violin shape shows the distribution density while the swarm points reveal actual observations, enabling viewers to see both the overall distribution pattern and individual data values simultaneously. This hybrid approach provides maximum transparency, showing exactly how many observations exist at each level while maintaining the smooth distribution visualization.
// anyplot.ai
// violin-swarm: Violin Plot with Overlaid Swarm Points
// Library: d3 7.9.0 | JavaScript 22.23.2
// Quality: 93/100 | Created: 2026-09-02

const t = window.ANYPLOT_TOKENS;
const { width, height } = window.ANYPLOT_SIZE;
const margin = { top: 110, right: 70, bottom: 90, left: 110 };
const iw = width - margin.left - margin.right;
const ih = height - margin.top - margin.bottom;

// --- Data: reaction times (ms) across 4 stimulus conditions, individual ----
// trials overlaid on the smoothed distribution. Deterministic LCG + Box-Muller
// stand in for a seeded RNG (the browser has none).
let seed = 42;
function rand() {
  seed = (seed * 1664525 + 1013904223) % 4294967296;
  return seed / 4294967296;
}
function randNormal(mean, std) {
  const u1 = Math.max(rand(), 1e-9);
  const u2 = rand();
  const z = Math.sqrt(-2 * Math.log(u1)) * Math.cos(2 * Math.PI * u2);
  return mean + z * std;
}

const conditions = [
  { category: "Visual", mean: 320, std: 45, n: 70 },
  { category: "Auditory", mean: 280, std: 35, n: 70 },
  { category: "Tactile", mean: 360, std: 55, n: 55 },
  { category: "Multimodal", mean: 250, std: 30, n: 65 },
];

const data = conditions.map((c) => ({
  category: c.category,
  values: Array.from({ length: c.n }, () => Math.max(120, randNormal(c.mean, c.std))),
}));

const allValues = data.flatMap((d) => d.values);

// --- Scales ------------------------------------------------------------------
const x = d3
  .scaleBand()
  .domain(data.map((d) => d.category))
  .range([0, iw])
  .padding(0.38);

const y = d3
  .scaleLinear()
  .domain([d3.min(allValues) - 30, d3.max(allValues) + 30])
  .nice()
  .range([ih, 0]);

// --- Kernel density estimation (Epanechnikov, Silverman bandwidth) ---------
function kernelEpanechnikov(bandwidth) {
  return (v) => (Math.abs((v /= bandwidth)) <= 1 ? (0.75 * (1 - v * v)) / bandwidth : 0);
}
function kde(kernel, sample, grid) {
  return grid.map((x0) => [x0, d3.mean(sample, (v) => kernel(x0 - v))]);
}

const gridPoints = 80;
const [yMin, yMax] = y.domain();

// Each violin is sampled over its own data extent (± one bandwidth, the
// Epanechnikov kernel's support) rather than the shared axis range — sampling
// past that support only adds an exact-zero-density tail, which collapses the
// area shape into a spurious spike reaching the axis limits.
const densities = data.map((d) => {
  const std = d3.deviation(d.values);
  const bandwidth = 1.06 * std * Math.pow(d.values.length, -0.2);
  const kernel = kernelEpanechnikov(bandwidth);
  const lo = Math.max(yMin, d3.min(d.values) - bandwidth);
  const hi = Math.min(yMax, d3.max(d.values) + bandwidth);
  const localGrid = d3.range(gridPoints).map((i) => lo + (i / (gridPoints - 1)) * (hi - lo));
  return { category: d.category, points: kde(kernel, d.values, localGrid) };
});

// --- Violin half-width scale, fit per category to its own lane -------------
const maxHalfWidth = (x.bandwidth() / 2) * 0.92;
const widthScales = densities.map((d) => {
  const maxDensity = d3.max(d.points, (p) => p[1]);
  return d3.scaleLinear().domain([0, maxDensity]).range([0, maxHalfWidth]);
});

// Interpolated half-width at an arbitrary value, used to keep swarm points
// inside the violin's smoothed outline rather than a fixed rectangular lane.
function halfWidthAt(points, widthScale, value) {
  const bis = d3.bisector((p) => p[0]).left;
  const idx = Math.max(1, Math.min(points.length - 1, bis(points, value)));
  const p0 = points[idx - 1];
  const p1 = points[idx];
  const frac = p1[0] === p0[0] ? 0 : (value - p0[0]) / (p1[0] - p0[0]);
  const density = p0[1] + frac * (p1[1] - p0[1]);
  return widthScale(density);
}

// --- SVG mount ---------------------------------------------------------------
const svg = d3.select("#container").append("svg").attr("width", width).attr("height", height);
const g = svg.append("g").attr("transform", `translate(${margin.left},${margin.top})`);

// --- Y grid (subtle, value axis only) ---------------------------------------
g.append("g")
  .call(d3.axisLeft(y).tickSize(-iw).tickFormat(""))
  .call((sel) => sel.select(".domain").remove())
  .selectAll("line")
  .attr("stroke", t.grid);

// --- Violins -------------------------------------------------------------
densities.forEach((d, i) => {
  const centerX = x(d.category) + x.bandwidth() / 2;
  const widthScale = widthScales[i];
  const color = t.palette[i % t.palette.length];
  const area = d3
    .area()
    .curve(d3.curveBasis)
    .y((p) => y(p[0]))
    .x0((p) => centerX - widthScale(p[1]))
    .x1((p) => centerX + widthScale(p[1]));

  g.append("path")
    .datum(d.points)
    .attr("fill", color)
    .attr("fill-opacity", 0.38)
    .attr("stroke", color)
    .attr("stroke-width", 1.5)
    .attr("d", area);
});

// --- Swarm points: force-settled beeswarm, clamped to the violin outline ---
// Radius kept small so points stay distinguishable even in the densest bands
// (Tactile, Auditory); fill uses the ink tone (not the violin's own hue) so
// individual observations read as a contrasting layer on top of the density
// shape, per the spec's "consider a contrasting color" guidance.
const radius = 3.6;
data.forEach((d, i) => {
  const centerX = x(d.category) + x.bandwidth() / 2;
  const points = densities[i].points;
  const widthScale = widthScales[i];
  const nodes = d.values.map((v) => ({ value: v, x: centerX, y: y(v) }));

  const sim = d3
    .forceSimulation(nodes)
    .force(
      "y",
      d3.forceY((n) => y(n.value)).strength(1)
    )
    .force("x", d3.forceX(centerX).strength(0.03))
    .force("collide", d3.forceCollide(radius + 0.9))
    .stop();
  for (let k = 0; k < 260; k++) sim.tick();

  g.selectAll(null)
    .data(nodes)
    .join("circle")
    .attr("cx", (n) => {
      const maxOffset = Math.max(halfWidthAt(points, widthScale, n.value) - radius * 0.6, 1);
      return centerX + Math.max(-maxOffset, Math.min(maxOffset, n.x - centerX));
    })
    .attr("cy", (n) => n.y)
    .attr("r", radius)
    .attr("fill", t.inkSoft)
    .attr("stroke", t.pageBg)
    .attr("stroke-width", 1);
});

// --- Axes ------------------------------------------------------------------
const xAxis = g.append("g").attr("transform", `translate(0,${ih})`).call(d3.axisBottom(x));
const yAxis = g.append("g").call(d3.axisLeft(y));
for (const ax of [xAxis, yAxis]) {
  ax.selectAll("text").attr("fill", t.inkSoft).style("font-size", "15px");
  ax.selectAll("line").attr("stroke", t.inkSoft);
  ax.select(".domain").attr("stroke", t.inkSoft);
}

g.append("text")
  .attr("x", -ih / 2)
  .attr("y", -margin.left + 34)
  .attr("transform", "rotate(-90)")
  .attr("text-anchor", "middle")
  .attr("fill", t.ink)
  .style("font-size", "17px")
  .text("Reaction Time (ms)");

g.append("text")
  .attr("x", iw / 2)
  .attr("y", ih + margin.bottom - 24)
  .attr("text-anchor", "middle")
  .attr("fill", t.ink)
  .style("font-size", "17px")
  .text("Stimulus Condition");

// --- Title -------------------------------------------------------------------
svg
  .append("text")
  .attr("x", width / 2)
  .attr("y", 52)
  .attr("text-anchor", "middle")
  .attr("fill", t.ink)
  .style("font-size", "22px")
  .style("font-weight", "600")
  .text("violin-swarm · javascript · d3 · anyplot.ai");
Runnable source as JSON, for any HTTP client: https://api.anyplot.ai/specs/violin-swarm/d3/code. Any spec id and library id listed in llms-full.txt fit the same URL shape; every URL below is complete and callable.
{
  "spec_id": "violin-swarm",
  "language": "javascript",
  "library": "d3",
  "page": "https://anyplot.ai/violin-swarm/javascript/d3",
  "hub": "https://anyplot.ai/violin-swarm",
  "code_json": "https://api.anyplot.ai/specs/violin-swarm/d3/code",
  "spec_json": "https://api.anyplot.ai/specs/violin-swarm",
  "render_light_png": "https://storage.googleapis.com/anyplot-images/plots/violin-swarm/javascript/d3/plot-light.png",
  "render_dark_png": "https://storage.googleapis.com/anyplot-images/plots/violin-swarm/javascript/d3/plot-dark.png",
  "interactive_light_html": "https://storage.googleapis.com/anyplot-images/plots/violin-swarm/javascript/d3/plot-light.html",
  "interactive_dark_html": "https://storage.googleapis.com/anyplot-images/plots/violin-swarm/javascript/d3/plot-dark.html",
  "quality_score": 93.0,
  "license": "MIT",
  "guide": "https://anyplot.ai/llms.txt"
}
Part of Violin Plot with Overlaid Swarm Points on anyplot.ai.