The same plot in 14 other libraries — JavaScript: Chart.js, D3.js, Highcharts, MUI X Charts; Python: Altair, Bokeh, lets-plot, Matplotlib, Plotly, plotnine, Pygal, Seaborn; R: ggplot2; Julia: Makie.jl. Compare all 15 side by side: Violin Plot with Overlaid Swarm Points in Python, R, Julia and JavaScript.
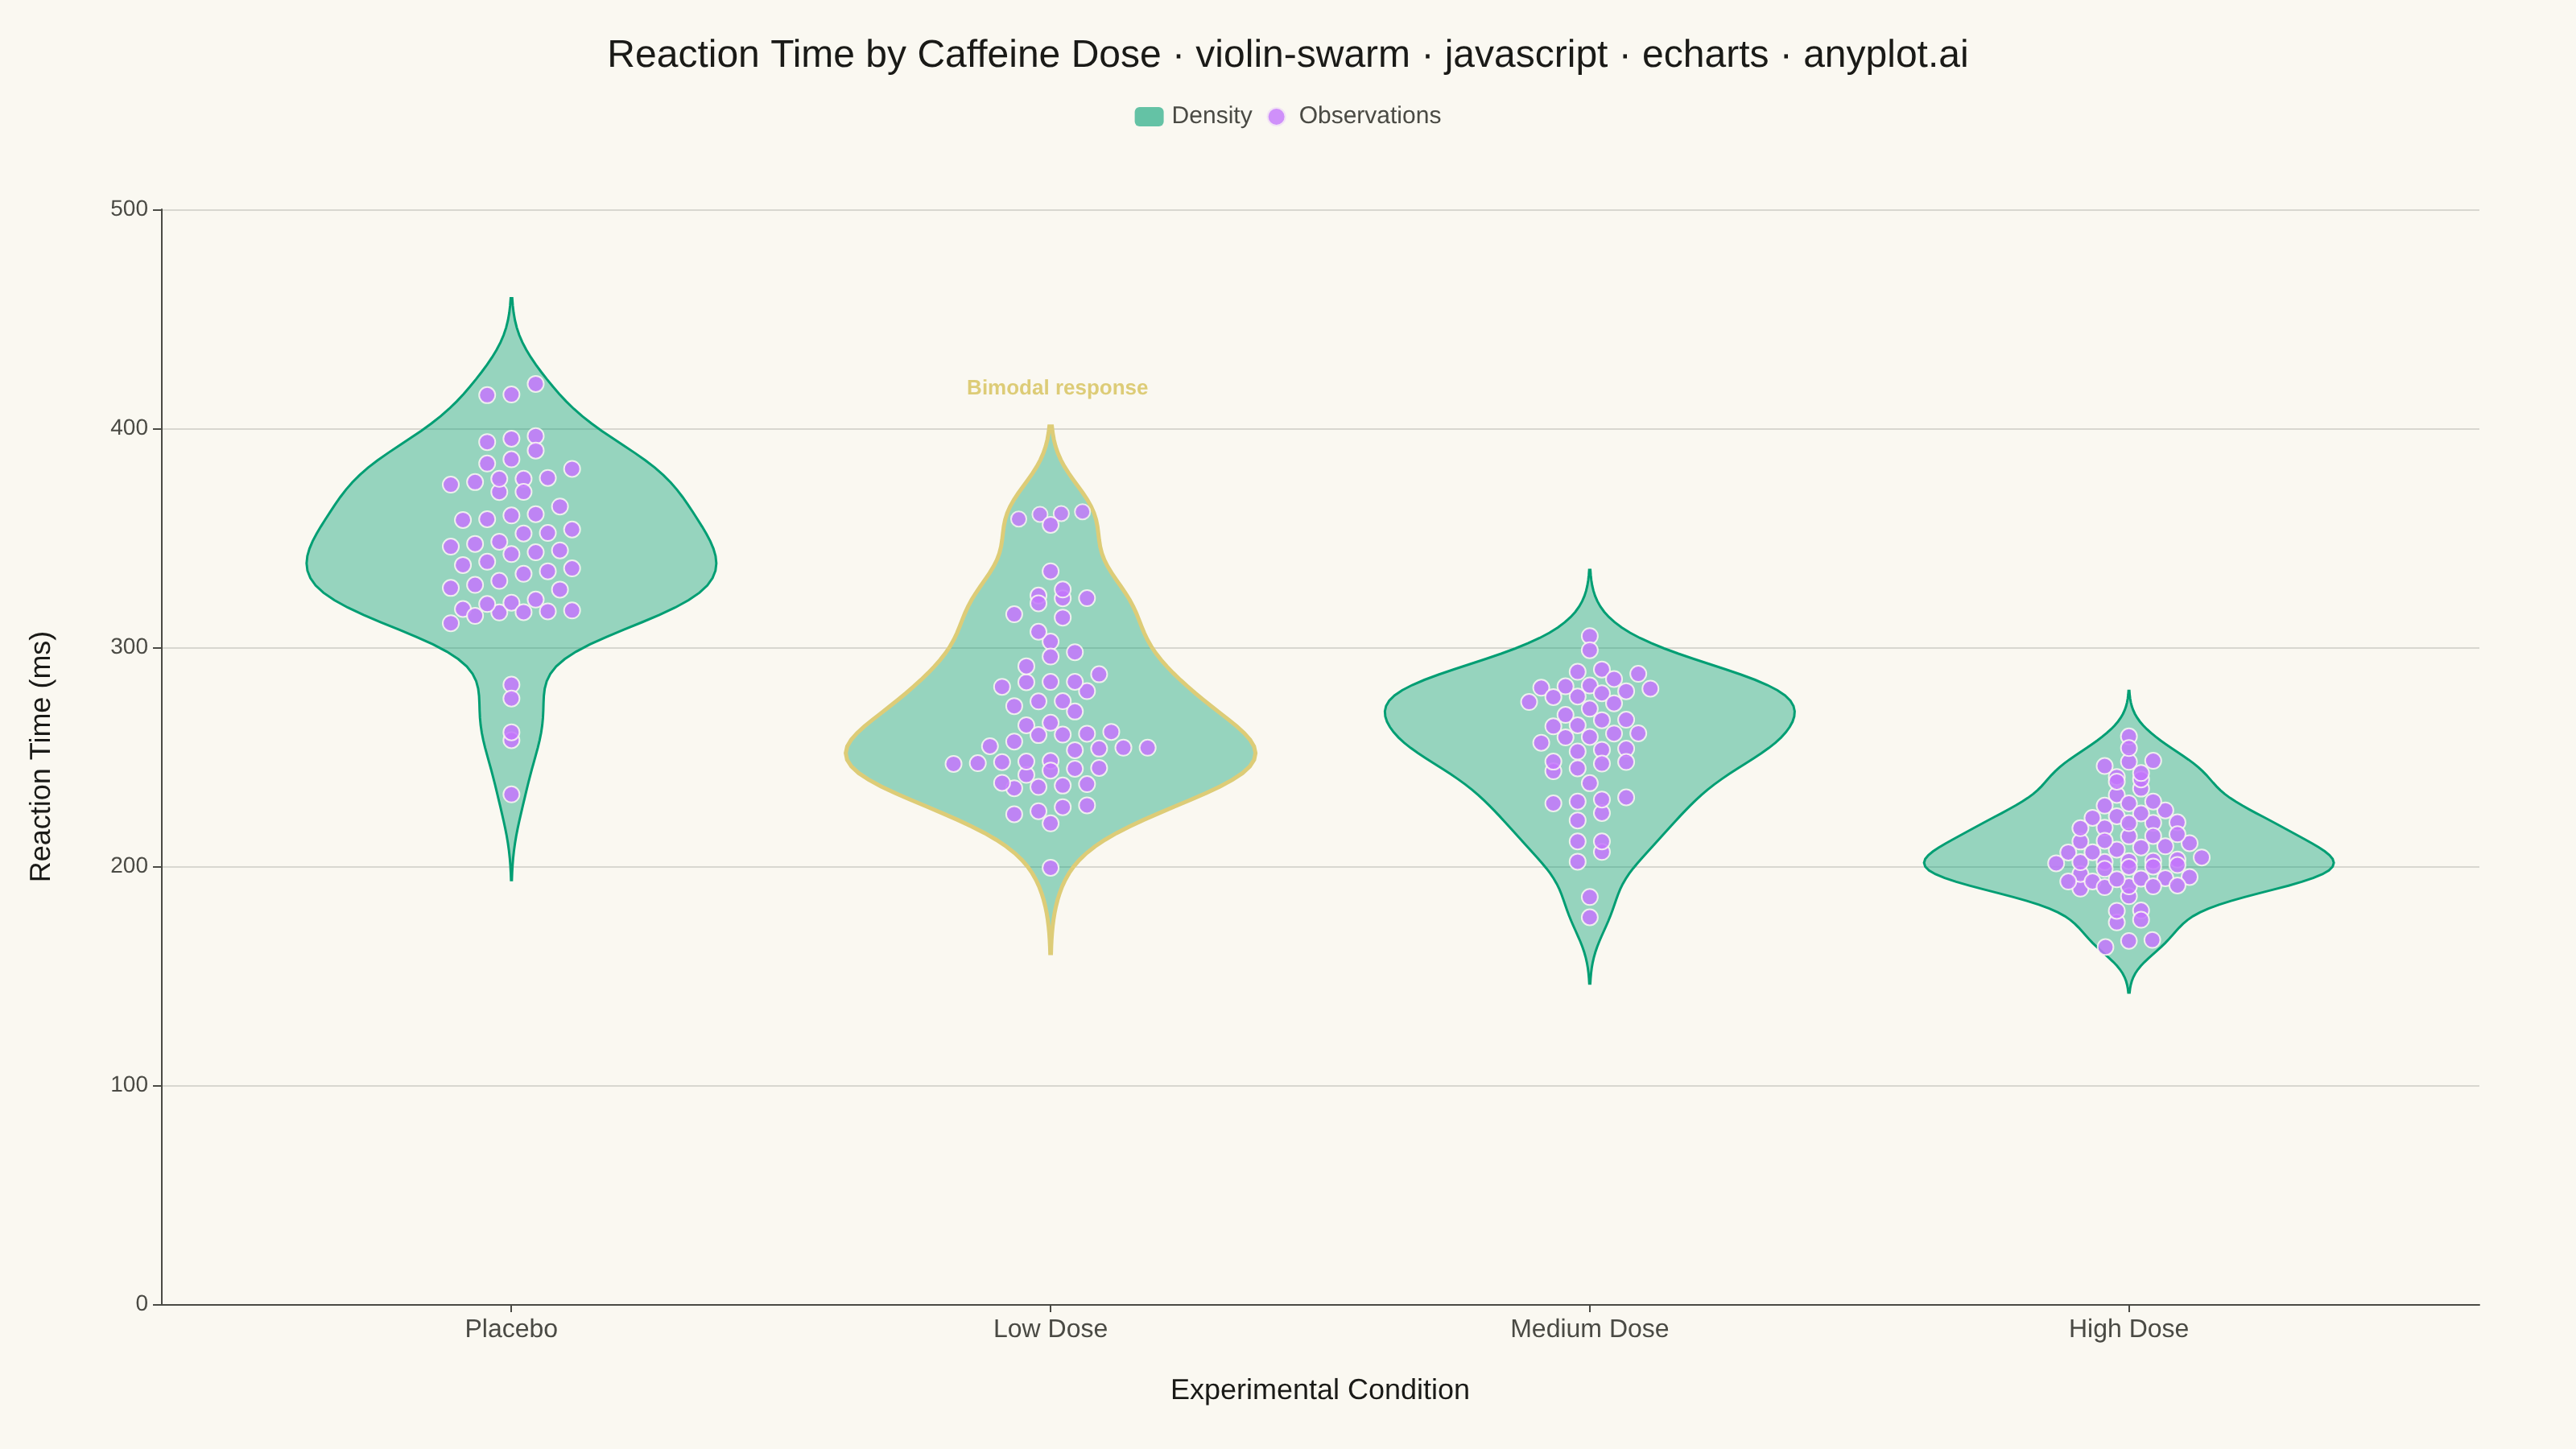
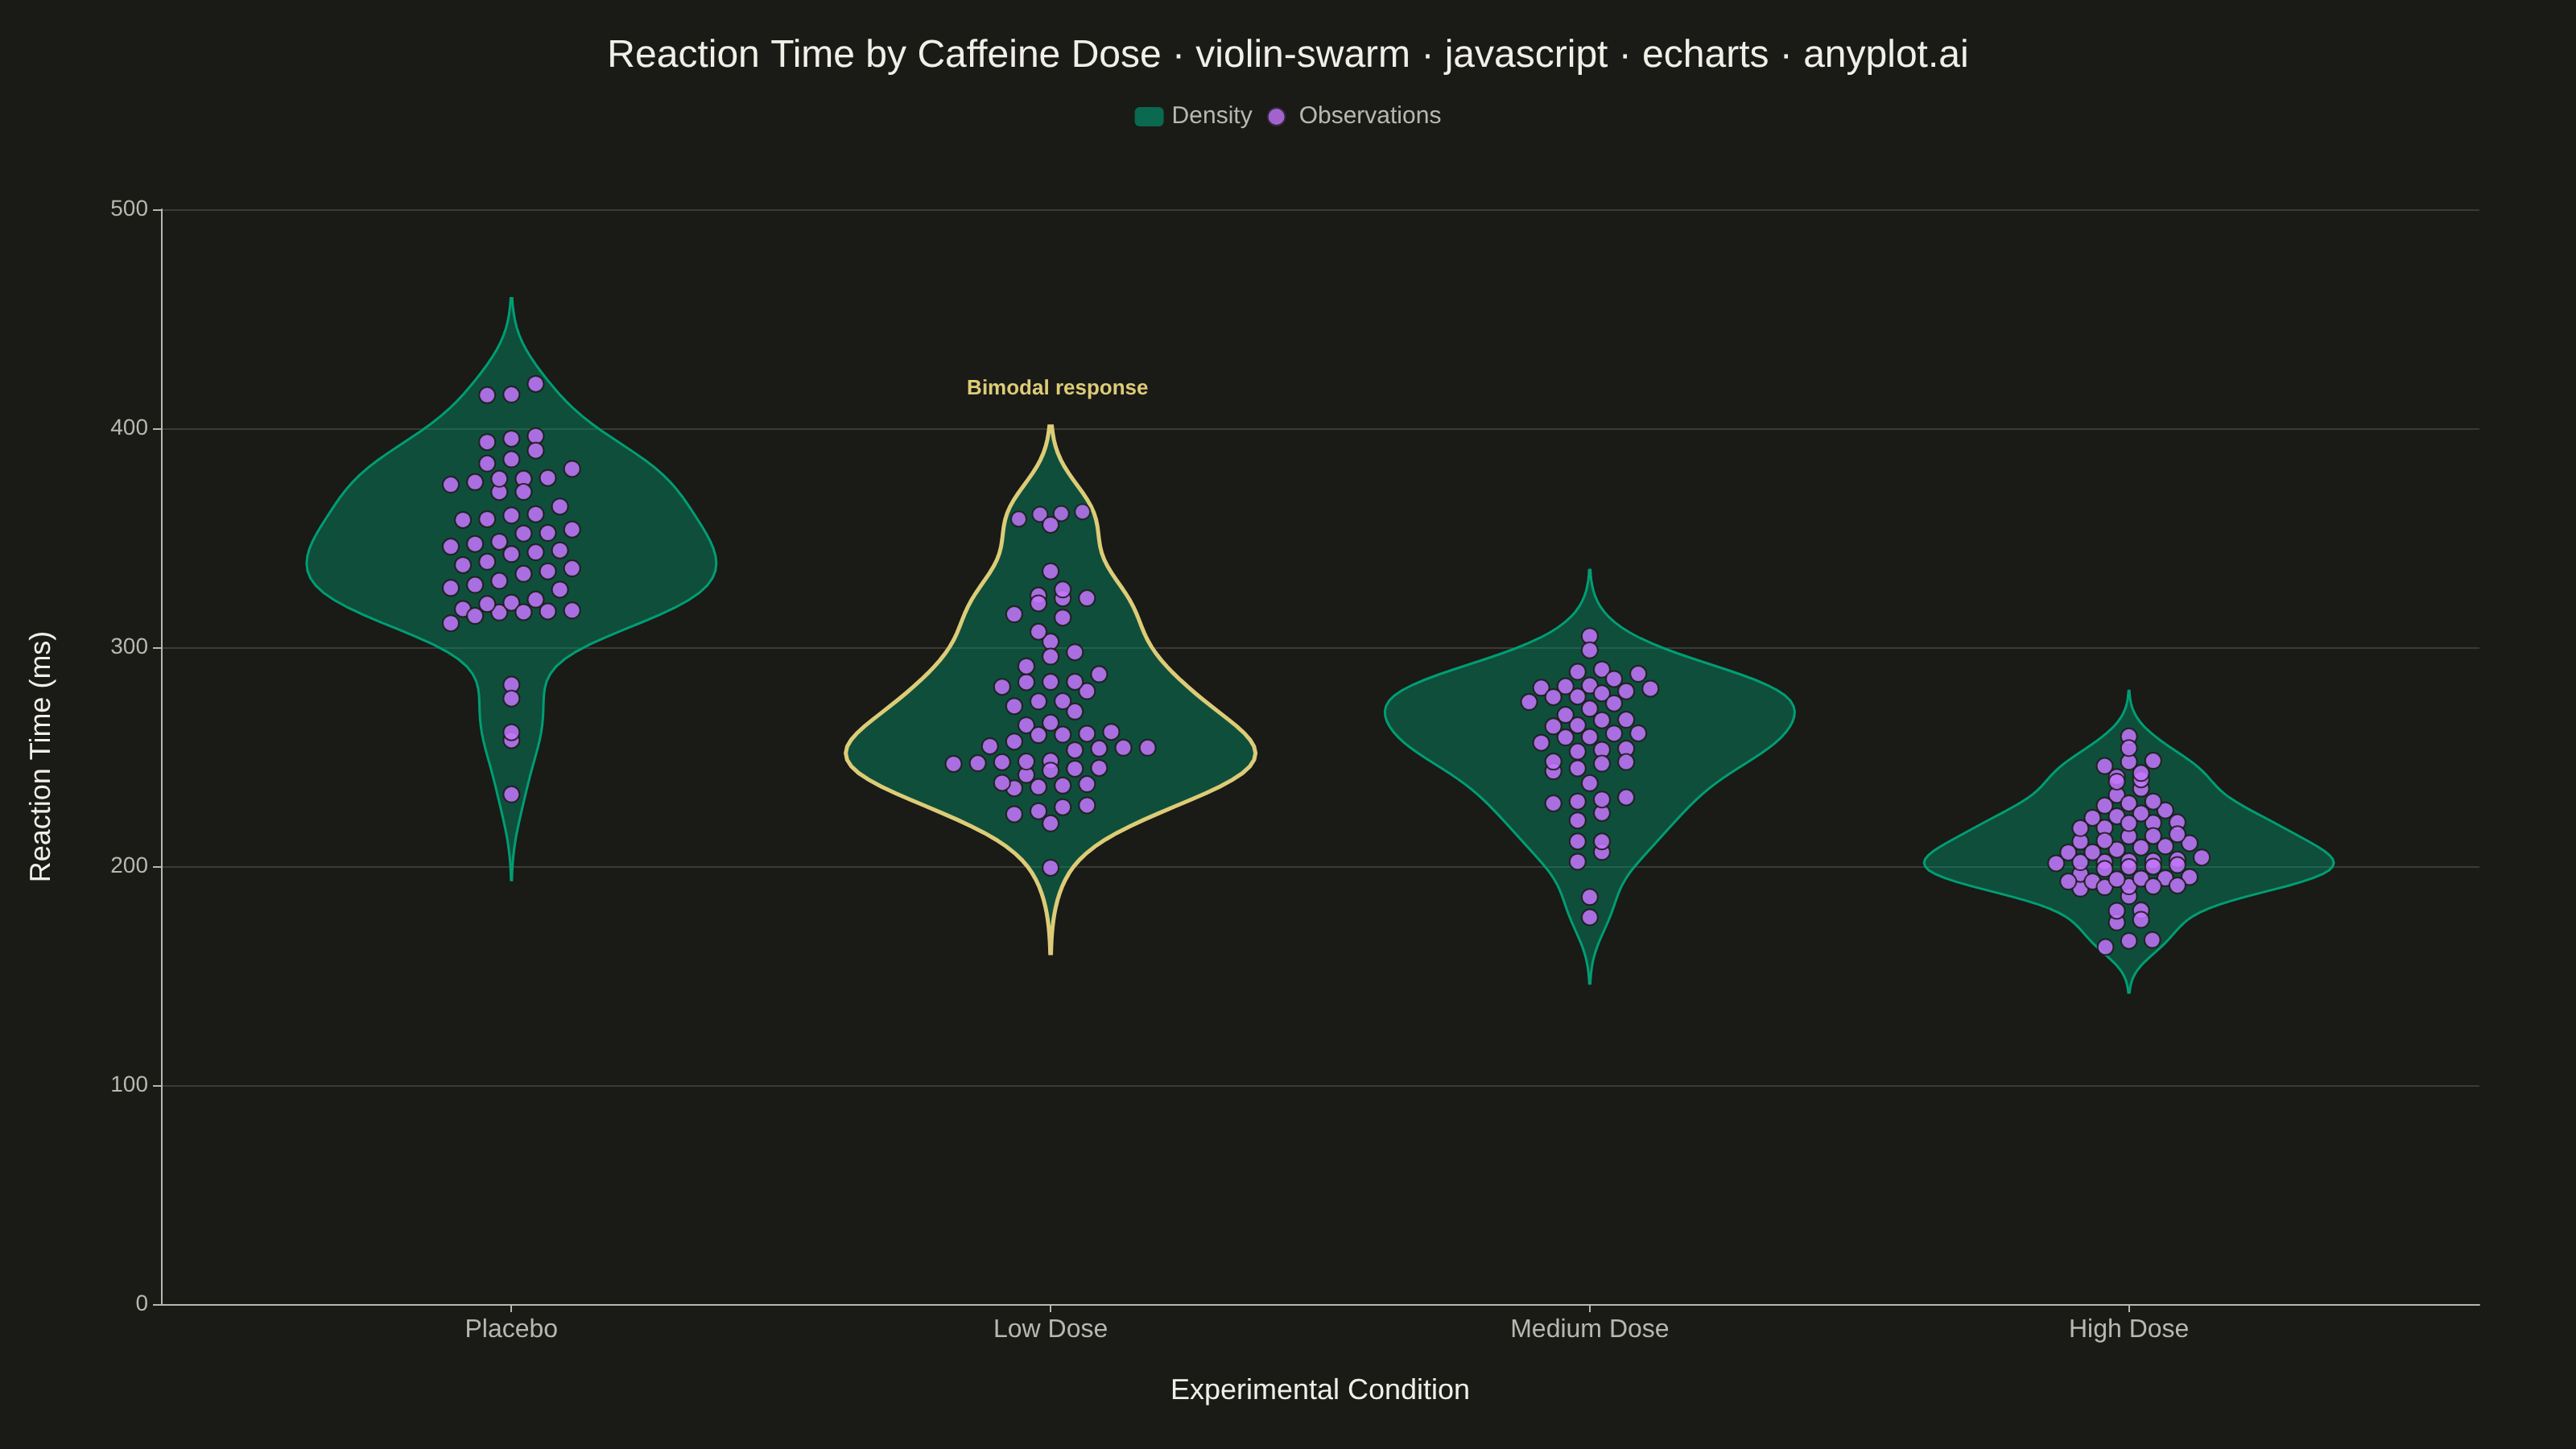
A violin plot with individual data points overlaid as a swarm plot, combining smooth kernel density estimation with raw data visibility. The violin shape shows the distribution density while the swarm points reveal actual observations, enabling viewers to see both the overall distribution pattern and individual data values simultaneously. This hybrid approach provides maximum transparency, showing exactly how many observations exist at each level while maintaining the smooth distribution visualization.
// anyplot.ai
// violin-swarm: Violin Plot with Overlaid Swarm Points
// Library: echarts 6.1.0 | JavaScript 22.23.2
// Quality: 88/100 | Created: 2026-09-02

const t = window.ANYPLOT_TOKENS;

// --- Deterministic PRNG (LCG) + Box-Muller for reproducible normal samples --
let seed = 42;
function lcgRandom() {
  seed = (seed * 1664525 + 1013904223) % 4294967296;
  return seed / 4294967296;
}
function randomNormal(mean, stdDev) {
  const u1 = lcgRandom() || 1e-9;
  const u2 = lcgRandom();
  const z = Math.sqrt(-2 * Math.log(u1)) * Math.cos(2 * Math.PI * u2);
  return mean + z * stdDev;
}

// --- Data: reaction times (ms) across 4 caffeine dosage conditions ---------
const categories = ["Placebo", "Low Dose", "Medium Dose", "High Dose"];
const samplesByCategory = [
  Array.from({ length: 55 }, () => randomNormal(340, 40)),
  // bimodal: a subset of subjects respond strongly to the low dose
  Array.from({ length: 60 }, (_, i) =>
    i % 3 === 0 ? randomNormal(320, 28) : randomNormal(255, 24)
  ),
  Array.from({ length: 48 }, () => randomNormal(252, 32)),
  Array.from({ length: 65 }, () => randomNormal(205, 22)),
];

// --- Kernel density estimation (Gaussian kernel, Silverman bandwidth) ------
function meanAndStdDev(values) {
  const m = values.reduce((sum, v) => sum + v, 0) / values.length;
  const variance = values.reduce((sum, v) => sum + (v - m) ** 2, 0) / values.length;
  return { mean: m, stdDev: Math.sqrt(variance) };
}
function quantile(sortedValues, q) {
  const pos = (sortedValues.length - 1) * q;
  const base = Math.floor(pos);
  const rest = pos - base;
  return sortedValues[base + 1] !== undefined
    ? sortedValues[base] + rest * (sortedValues[base + 1] - sortedValues[base])
    : sortedValues[base];
}
function silvermanBandwidth(values) {
  const sorted = [...values].sort((a, b) => a - b);
  const { stdDev } = meanAndStdDev(values);
  const spread = Math.min(stdDev, (quantile(sorted, 0.75) - quantile(sorted, 0.25)) / 1.34);
  return 0.9 * (spread || stdDev) * Math.pow(values.length, -0.2);
}
function gaussianKde(values, bandwidth) {
  return (y) => {
    const sum = values.reduce((acc, v) => {
      const u = (y - v) / bandwidth;
      return acc + Math.exp(-0.5 * u * u);
    }, 0);
    return sum / (values.length * bandwidth * Math.sqrt(2 * Math.PI));
  };
}

// --- Violin geometry: one density profile per category, normalized width --
const GRID_POINTS = 80;
const MAX_HALF_WIDTH = 0.38;

const violins = categories.map((category, index) => {
  const values = samplesByCategory[index];
  const bandwidth = silvermanBandwidth(values);
  const yMin = Math.min(...values) - 2.5 * bandwidth;
  const yMax = Math.max(...values) + 2.5 * bandwidth;
  const density = gaussianKde(values, bandwidth);
  const grid = Array.from(
    { length: GRID_POINTS },
    (_, i) => yMin + (i / (GRID_POINTS - 1)) * (yMax - yMin)
  );
  const densities = grid.map(density);
  const maxDensity = Math.max(...densities);
  const halfWidths = densities.map((d) => (d / maxDensity) * MAX_HALF_WIDTH);
  return { category, index, values, grid, halfWidths };
});

function halfWidthAt(violin, y) {
  const { grid, halfWidths } = violin;
  if (y <= grid[0]) return halfWidths[0];
  if (y >= grid[grid.length - 1]) return halfWidths[halfWidths.length - 1];
  for (let i = 0; i < grid.length - 1; i++) {
    if (y >= grid[i] && y <= grid[i + 1]) {
      const frac = (y - grid[i]) / (grid[i + 1] - grid[i]);
      return halfWidths[i] + frac * (halfWidths[i + 1] - halfWidths[i]);
    }
  }
  return 0;
}

// --- Swarm layout: bin observations along y, spread them within the local -
// --- violin half-width so points never spill past the density outline -----
const SWARM_BINS = 28;
const MAX_POINT_SPACING = 0.045;

function beeswarmOffsets(violin) {
  const { values, grid } = violin;
  const yMin = grid[0];
  const yMax = grid[grid.length - 1];
  const binWidth = (yMax - yMin) / SWARM_BINS;
  const bins = Array.from({ length: SWARM_BINS }, () => []);
  values
    .map((_, i) => i)
    .sort((a, b) => values[a] - values[b])
    .forEach((i) => {
      const binIndex = Math.min(
        SWARM_BINS - 1,
        Math.max(0, Math.floor((values[i] - yMin) / binWidth))
      );
      bins[binIndex].push(i);
    });
  const offsets = new Array(values.length).fill(0);
  // Density-scaled marker size: bins forced below MAX_POINT_SPACING (crowded)
  // get a ratio < 1 so renderer can shrink/lighten points to stay distinguishable.
  const sizeRatios = new Array(values.length).fill(1);
  bins.forEach((indices, binIndex) => {
    const count = indices.length;
    if (count === 0) return;
    const binCenterY = yMin + (binIndex + 0.5) * binWidth;
    const spacing = Math.min(MAX_POINT_SPACING, (2 * halfWidthAt(violin, binCenterY)) / count);
    const ratio = Math.max(0.4, Math.min(1, spacing / MAX_POINT_SPACING));
    indices.forEach((valueIndex, k) => {
      offsets[valueIndex] = (k - (count - 1) / 2) * spacing;
      sizeRatios[valueIndex] = ratio;
    });
  });
  return { offsets, sizeRatios };
}

violins.forEach((violin) => {
  const { offsets, sizeRatios } = beeswarmOffsets(violin);
  violin.offsets = offsets;
  violin.sizeRatios = sizeRatios;
});

// --- Series data --------------------------------------------------------
const violinOutlines = violins.map((violin) => {
  const points = [];
  for (let i = 0; i < violin.grid.length; i++) {
    points.push([violin.index + violin.halfWidths[i], violin.grid[i]]);
  }
  for (let i = violin.grid.length - 1; i >= 0; i--) {
    points.push([violin.index - violin.halfWidths[i], violin.grid[i]]);
  }
  return points;
});

// Low Dose is the deliberately bimodal category (see data generation above);
// give it a subtle accent so the storytelling point isn't purely implicit.
const BIMODAL_INDEX = 1;

const swarmPoints = violins.flatMap((violin) =>
  violin.values.map((value, i) => {
    const ratio = violin.sizeRatios[i];
    return {
      value: [violin.index + violin.offsets[i], value],
      symbolSize: 6 + ratio * 4,
      itemStyle: { opacity: 0.55 + ratio * 0.3 },
    };
  })
);

function hexToRgba(hex, alpha) {
  const r = parseInt(hex.slice(1, 3), 16);
  const g = parseInt(hex.slice(3, 5), 16);
  const b = parseInt(hex.slice(5, 7), 16);
  return `rgba(${r}, ${g}, ${b}, ${alpha})`;
}

function renderViolin(params, api) {
  const points = violinOutlines[params.dataIndex].map((p) => api.coord(p));
  const isBimodal = params.dataIndex === BIMODAL_INDEX;
  return {
    type: "polygon",
    shape: { points },
    style: {
      fill: hexToRgba(t.palette[0], 0.4),
      stroke: isBimodal ? t.amber : t.palette[0],
      lineWidth: isBimodal ? 2.5 : 1.5,
    },
  };
}

// --- Chart ----------------------------------------------------------------
const titleText = "Reaction Time by Caffeine Dose · violin-swarm · javascript · echarts · anyplot.ai";
// Moderately-long descriptive titles (up to 110 chars) hold a higher floor so
// they keep visual presence; only titles beyond that shrink proportionally.
const titleFontSize =
  titleText.length > 110
    ? Math.max(16, Math.round(24 * (110 / titleText.length)))
    : titleText.length > 67
      ? 24
      : 22;

const chart = echarts.init(document.getElementById("container"));
chart.setOption({
  animation: false,
  backgroundColor: "transparent",
  color: t.palette,
  title: {
    text: titleText,
    left: "center",
    top: 18,
    textStyle: { color: t.ink, fontSize: titleFontSize, fontWeight: 500 },
  },
  legend: {
    top: 60,
    left: "center",
    itemWidth: 18,
    itemHeight: 12,
    textStyle: { color: t.inkSoft, fontSize: 15 },
    data: ["Density", "Observations"],
  },
  grid: { left: 100, right: 60, top: 130, bottom: 90 },
  xAxis: {
    type: "value",
    min: -0.65,
    max: categories.length - 1 + 0.65,
    axisLabel: {
      customValues: categories.map((_, i) => i),
      formatter: (val) => categories[val],
      color: t.inkSoft,
      fontSize: 16,
    },
    axisTick: { customValues: categories.map((_, i) => i) },
    axisLine: { lineStyle: { color: t.inkSoft } },
    splitLine: { show: false },
    name: "Experimental Condition",
    nameLocation: "middle",
    nameGap: 45,
    nameTextStyle: { color: t.ink, fontSize: 18 },
  },
  yAxis: {
    type: "value",
    name: "Reaction Time (ms)",
    nameLocation: "middle",
    nameGap: 65,
    nameTextStyle: { color: t.ink, fontSize: 18 },
    axisLabel: { color: t.inkSoft, fontSize: 14 },
    axisLine: { onZero: false, lineStyle: { color: t.inkSoft } },
    splitLine: { lineStyle: { color: t.grid } },
  },
  series: [
    {
      name: "Density",
      type: "custom",
      coordinateSystem: "cartesian2d",
      xAxisIndex: 0,
      yAxisIndex: 0,
      renderItem: renderViolin,
      data: categories.map((_, i) => i),
      itemStyle: { color: hexToRgba(t.palette[0], 0.6) },
      clip: true,
      silent: true,
      z: 2,
    },
    {
      name: "Observations",
      type: "scatter",
      data: swarmPoints,
      itemStyle: {
        color: t.palette[1],
        borderColor: t.pageBg,
        borderWidth: 1,
      },
      z: 3,
    },
  ],
});

// --- Storytelling callout: label the deliberately bimodal Low Dose group ---
const bimodalViolin = violins[BIMODAL_INDEX];
const bimodalTopY = bimodalViolin.grid[bimodalViolin.grid.length - 1];
const [labelX, labelY] = chart.convertToPixel(
  { xAxisIndex: 0, yAxisIndex: 0 },
  [bimodalViolin.index, bimodalTopY]
);
chart.setOption({
  graphic: [
    {
      type: "text",
      left: labelX - 52,
      top: labelY - 30,
      z: 10,
      style: {
        text: "Bimodal response",
        fill: t.amber,
        fontSize: 13,
        fontWeight: 600,
      },
    },
  ],
});
Runnable source as JSON, for any HTTP client: https://api.anyplot.ai/specs/violin-swarm/echarts/code. Any spec id and library id listed in llms-full.txt fit the same URL shape; every URL below is complete and callable.
{
  "spec_id": "violin-swarm",
  "language": "javascript",
  "library": "echarts",
  "page": "https://anyplot.ai/violin-swarm/javascript/echarts",
  "hub": "https://anyplot.ai/violin-swarm",
  "code_json": "https://api.anyplot.ai/specs/violin-swarm/echarts/code",
  "spec_json": "https://api.anyplot.ai/specs/violin-swarm",
  "render_light_png": "https://storage.googleapis.com/anyplot-images/plots/violin-swarm/javascript/echarts/plot-light.png",
  "render_dark_png": "https://storage.googleapis.com/anyplot-images/plots/violin-swarm/javascript/echarts/plot-dark.png",
  "interactive_light_html": "https://storage.googleapis.com/anyplot-images/plots/violin-swarm/javascript/echarts/plot-light.html",
  "interactive_dark_html": "https://storage.googleapis.com/anyplot-images/plots/violin-swarm/javascript/echarts/plot-dark.html",
  "quality_score": 88.0,
  "license": "MIT",
  "guide": "https://anyplot.ai/llms.txt"
}
Part of Violin Plot with Overlaid Swarm Points on anyplot.ai.